Creating and Configuring Data Models
This article explains how to create data models in ReportWORQ, based on ReportWORQ datasources.
Each ReportWORQ Distribution Job is based on one or more existing source reports, often from an Excel workbook (.xslx file). ReportWORQ uses these reports to generate report output based on financial planning systems data or other supported data sources. Report authors can also create these source reports using the ReportWORQ add-in for Excel.
Each authored report is based on a ReportWORQ data model. The data model connects to a ReportWORQ datasource and stores the contents and structure of a data table in ReportWORQ. Report authors select and filter data from the data model for their reports.
After you finish creating data models, you can use them to author reports.
The main steps for creating and configuring a ReportWORQ data model are as follows:
Additional topics in this article include:
Creating a New Data Model
To create a new data model:
Open the Data Models interface by selecting the Data Models icon.

The Data Models pane appears.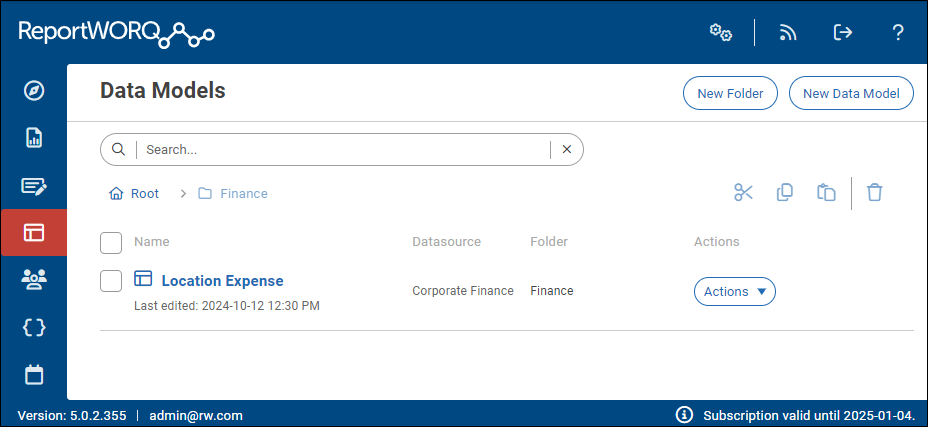
Data models are stored within nested folders. In the example above, the Location Expense data model is in the Finance folder.Select the New Data Model button.
The New Project dialog appears..png)
Assign the data model a Project Name, and then select OK.
The new data model is added to the list.Select the data model to open it. The model contains no data fields because it is not yet connected to a data table.
.png)
Connecting a Data Table
Each data model is based on a data table derived from a ReportWORQ datasource. You can connect to a table that is already defined in the datasource, or you can define the table by specifying a query filter.
The procedure in this section is based on using an Excel spreadsheet as the datasource. Depending on the type of datasource, additional or different information may be required.
To connect a data table:
Select Connect Data Table.

The Connect Data Table dialog appears.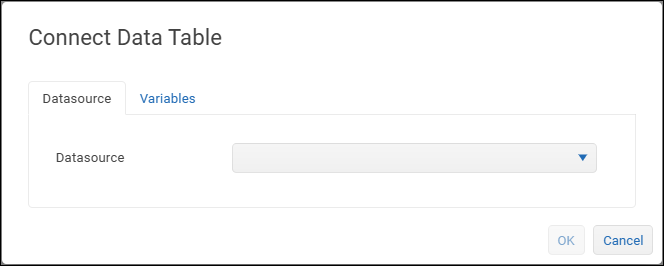
On the Datasource tab, select the ReportWORQ datasource that contains the data for your reports.
.png)
Additional information is required. The requests that appear vary depending on the type of datasource. For SQL-based datasources such as OleDB connections, CData connections, or Excel spreadsheets, the Query Type list appears.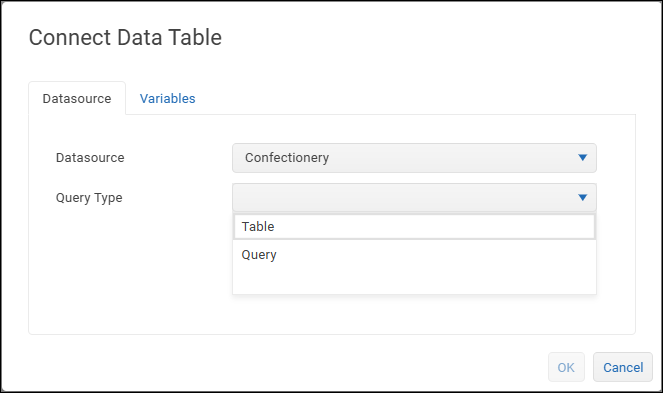
Select a Query Type.
Query types for a SQL-based datasource are as follows:Table — Select the table that contains data fields that are required in the data model.
If fields from multiple tables are required, select a table that contains fields that can act as common key for joining to the other table(s)..png)
Query — In the SQL Query box, specify the query filter(s) to define a data table for the data model.
Filter queries can include ReportWORQ variables. The format for specifying variables is to enclose the variable name in two sets of curly brackets, for example, {{variableName}}..png)
If you specified any variables on the Datasource tab, you must provide sample preview values for them on the Variables tab. These preview values are not defaults. They enable ReportWORQ to run a query and view the table structure and output for a data model.
For each variable listed on the Variables tab, provide a preview value.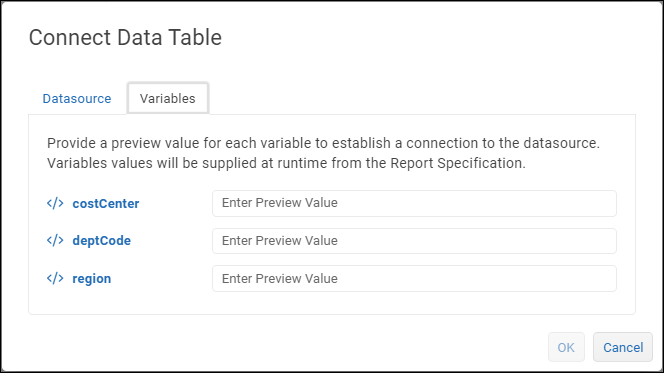
Select OK.
The data model page shows a list of fields derived from the connected table..png)
Select Save Changes.
Excluding Data Fields
You can limit the data that the model provides to report authors by excluding entire data fields.
To exclude a data field:
Select the eye icon beside the field Title:
The open eye icon
 indicates that the field is included in the model.
The closed eye icon
 indicates that the field is excluded from the model.
Tip: To reduce visual clutter as you work on the data model, you can Hide Excluded Fields from view. 
Setting Model Filters
Model filters are a set of grouped and nested data filters which are conditionally applied based on Boolean operators (AND, OR). Only data that satisfies the full set of model filters is made available for report authoring.
Individual filters are grouped in a nested hierarchy. Each group within the hierarchy contains zero or more filter expressions, and/or zero or more subgroups (also called groups).
For the purposes of discussion, filter expressions and groups within a given group are considered child elements of that group. They are considered sibling elements of each other.
Each group has a header, which features controls that enable you to define the group.

Group controls are as follows:
AND / OR buttons: Boolean logical operators that define how the child elements of the group are evaluated for inclusion:
AND — Only data that satisfies ALL sibling elements is included.
OR — Data that satisfies one or more sibling elements is included.
Add Expression button: Adds a filter expression, as a child element of the group.
To define the filter expression, you select a data field from the table, select a test, and specify a data value to test against (if applicable)..png)
Add Group button: Adds a new group, as a child element of the group.
.png)
You can add any number of filter expressions and groups. By nesting these elements, you can define precisely what data is made available to report authors.
Tip: To experiment with filters and preview the results, you can Browse Data.
Example of a Model Filter
In the following example, model filters are applied to a table of data about candy bar products. The top level group contains two child elements: a filter expression and a group. The AND operator is selected, so only data that satisfies both child elements is made available for report authoring.
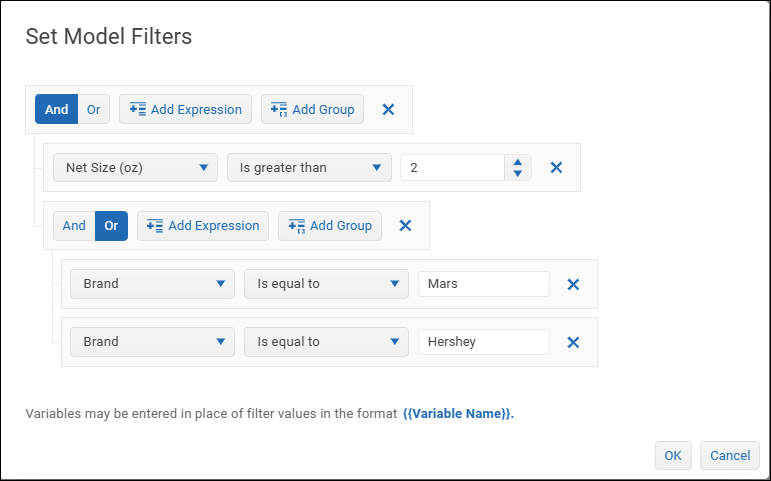
The second level group contains two filter expressions. The OR operator is selected, so data that satisfies either or both filter expressions satisfies this group of filters.
Tip: Filter expressions can reference any field in the data table, even if the field is excluded from the data model. This enables you to test against data in excluded tables, even though data from those tables is not included in the model.
Put into words, the preceding example functions as follows: Include data rows where the product size is greater than 2 oz AND the brand is equal to either Mars or Hershey.
The figure below shows returned data for this example:
.png)
Without model filters, the returned data would be as follows:
.png)
To set model filters:
Select the Filters icon.

The Set Model Filters pane appears and shows the top-level group header.
In the group header, select a Boolean operator (AND or OR) to define how the child elements of the group are evaluated for inclusion.
If you want to add a subgroup, select Add Group.
A new group header appears, one level lower in the hierarchy than its parent group.
If you want to add a filter expression to any group, select Add Expression in the group header and then:
From the leftmost list, select the field to which the filter applies.
.png)
From the center list, select a relational operator to evaluate the data.
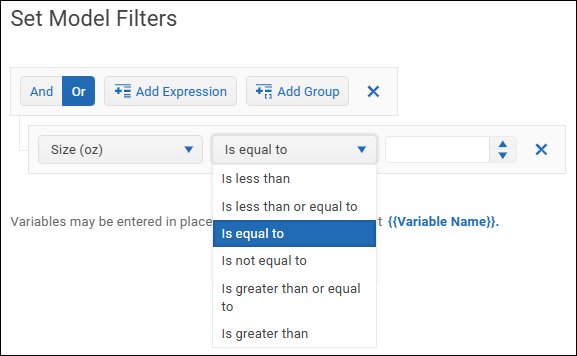
If the right box is present, specify the data value to test against.
You can type the value, or specify a ReportWORQ variable. The format for specifying a variable is to enclose the variable name in two sets of curly brackets, for example, {{variableName}}.
Continue to add filter expressions and/or groups as required until the model filters are fully defined.
Tip: As you continue to define the model filters, you can test them anytime. Select OK, select Save Changes, and then Browse Data.When you are finished defining model filters, select OK.
Connecting Additional Data Tables
You can join an additional table to a table already in the model. Each of the two tables must contain a common field that can act as the key field to join them. All tables must be from the same datasource.
The procedure in this section is based on using an Excel spreadsheet as the datasource. Depending on the type of datasource, additional or different information may be required.
To connect an additional table:
In the list of tables, beside the field that acts as the key field, select the Add/Edit Data Table Mapping icon.

The Connect Data Table prompt appears..png)
Select Connect Data Table.
The Connect Data Table dialog appears.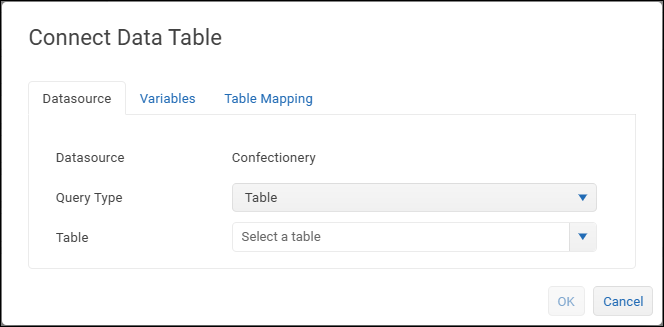
Additional information is required. The requests that appear vary depending on the type of datasource.
For SQL-based datasources, such as ODBC connections, CData connections, or Excel spreadsheets, the Query Type list appears.Select a Query Type.
The Query Type options available, and the information required for them, varies depending on the datasource. Queries for some datasources may require variables to provide necessary data to construct a valid query.
For this example, the available Query Types are as follows:Table — Select the table that contains data fields that are required in the data model.
Query — In the SQL Query box, specify one or more queries to define a data table.
Queries can include ReportWORQ variables. The format for specifying variables is to enclose the variable name in two sets of curly brackets, for example, {{variableName}}.
If you specified any variables on the Datasource tab, you must provide sample preview values for them on the Variables tab. These preview values are not defaults. They enable ReportWORQ to run a query to help it establish the table structure.
For each variable listed on the Variables tab, specify a preview value.
On the Table Mapping tab (if present), select the Target Field.
This is the field that acts as the key field.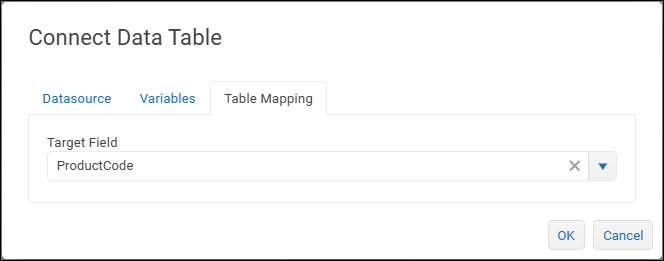
Click OK.
The updated list of fields appears.
Beside the original field, you can select the arrow icon to show/hide the connected fields. They appear indented below the original field.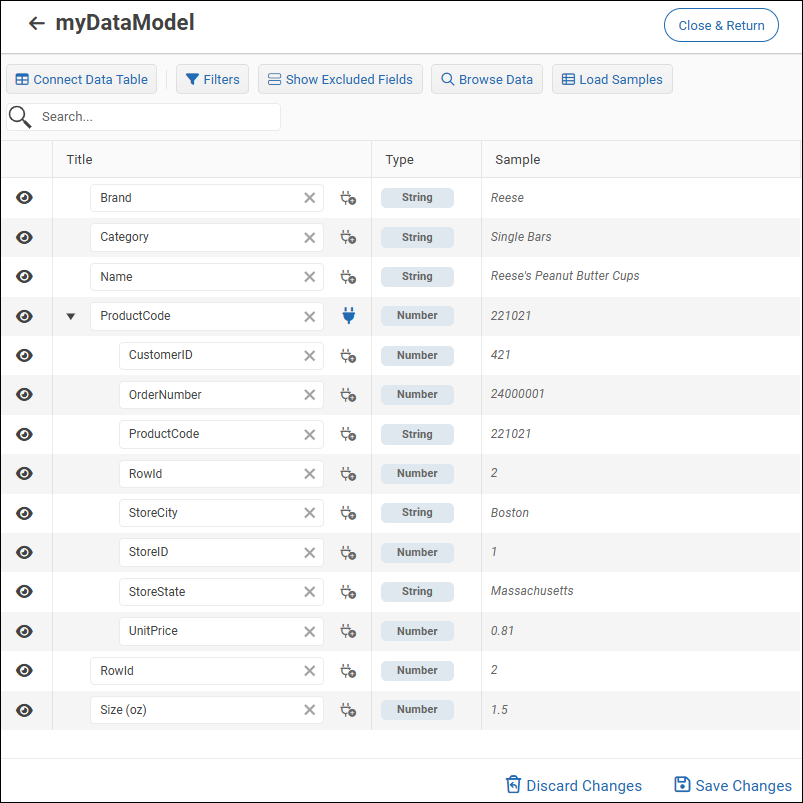
Tip: If you want to modify or remove the table mapping, select the Add/Edit Data Table Mapping icon..png)
If any two fields in the data model have the same Title, change one of them. All field titles must be unique.
Select Save Changes.
Additional Options
This section describes additional options and features for data modeling:
Browsing Data — Test the data model and experiment with filters.
Loading Samples — View sample data to better understand the sort of data each field contains.
Editing Field Titles — Ensure all field titles are unique and meaningful to report authors.
Browsing Data
Data browsing enables you to test the data model and to experiment with query filters.
When you browse data, you can Run Report to test the data model as-is or select additional options first. You can specify which fields to include, define query filters to apply in addition to the model filters, and provide variable values.
When you run the report, ReportWORQ queries the datasource based on the data model and on the options you selected.
Query filters and other settings you configure in the Browse Data page are not retained in the data model. If required, you can note the filter settings and then recreate them in the data model.
To browse data:
Select Save Changes.
Select the Browse Data button.

The Browse Data page appears.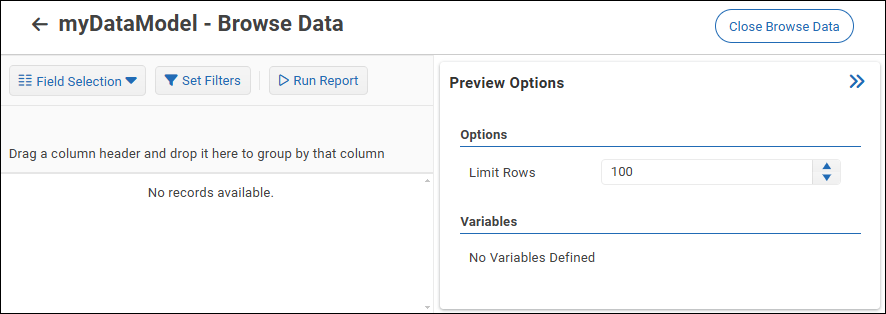
In the Preview Options pane, configure the following as needed:
Limit Rows: Select or type the maximum number of rows of data you want to preview.
Variables: If your data model includes variables, specify a valid value for each variable.
If you want to specify which fields to include, select Field Selection and then select/deselect fields as required.
By default, all fields are included.If you want to apply additional query filters to the data, select Set Filters and then define the filters.
The process for setting filters for browsing data is the same as Setting Model Filters.
Any filters you define here are report filters, which are applied in addition to the model filters. The returned data is a subset of the data that would be returned by the model filters only.
The query results appear.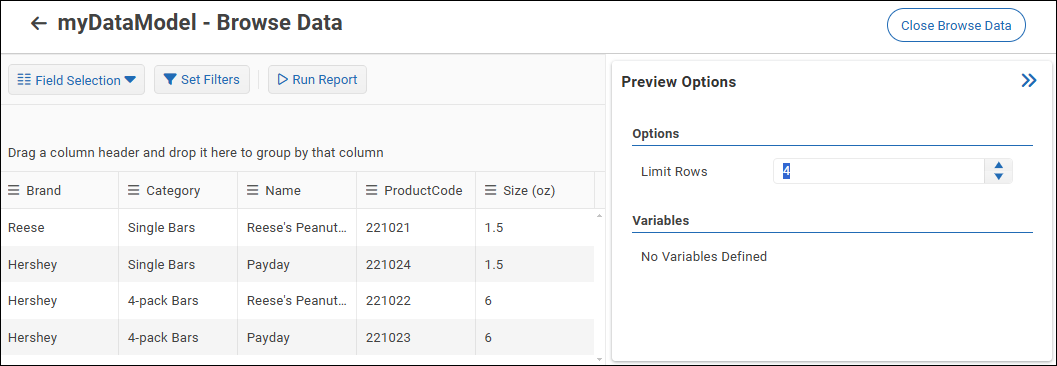
When you are finished browsing data, select Close Browse Data to return to the data model.
Loading Samples
You can load and view data samples to better understand the sort of data each field contains.
Tip: The Type column shows the data type for each data field.
To load samples:
Select Load Samples.

ReportWORQ queries the datasource and displays one data value for each field, in the Sample column.
Editing Field Titles
When you connect a table to the data model, the field names from the datasource appear as field Titles in the list of data fields. When report authors use the data model, they see the field titles.
You can change the title of any field to an alias. Doing so may help report authors identify which fields to use in their reports.
Each field title must be unique. Each time you connect an additional table, check for duplicate titles and edit them as required to eliminate duplicates.
To edit a field title:
Type a new title in the Title box.
Tip: The Title box cannot be blank. If the title is deleted, it reverts to the original title.
To restore a field title:
Select the X on the right side of the Title box.
The alias is cleared and the original title is restored.