
The report catalog#
Eight jobs live in Workspace ▸ Timberline ▸ Financial Reports. They are not variations on one idea, each was built to show a different part of the product.
The eight#
Board Packet#
Executive board deck for total company and regions.
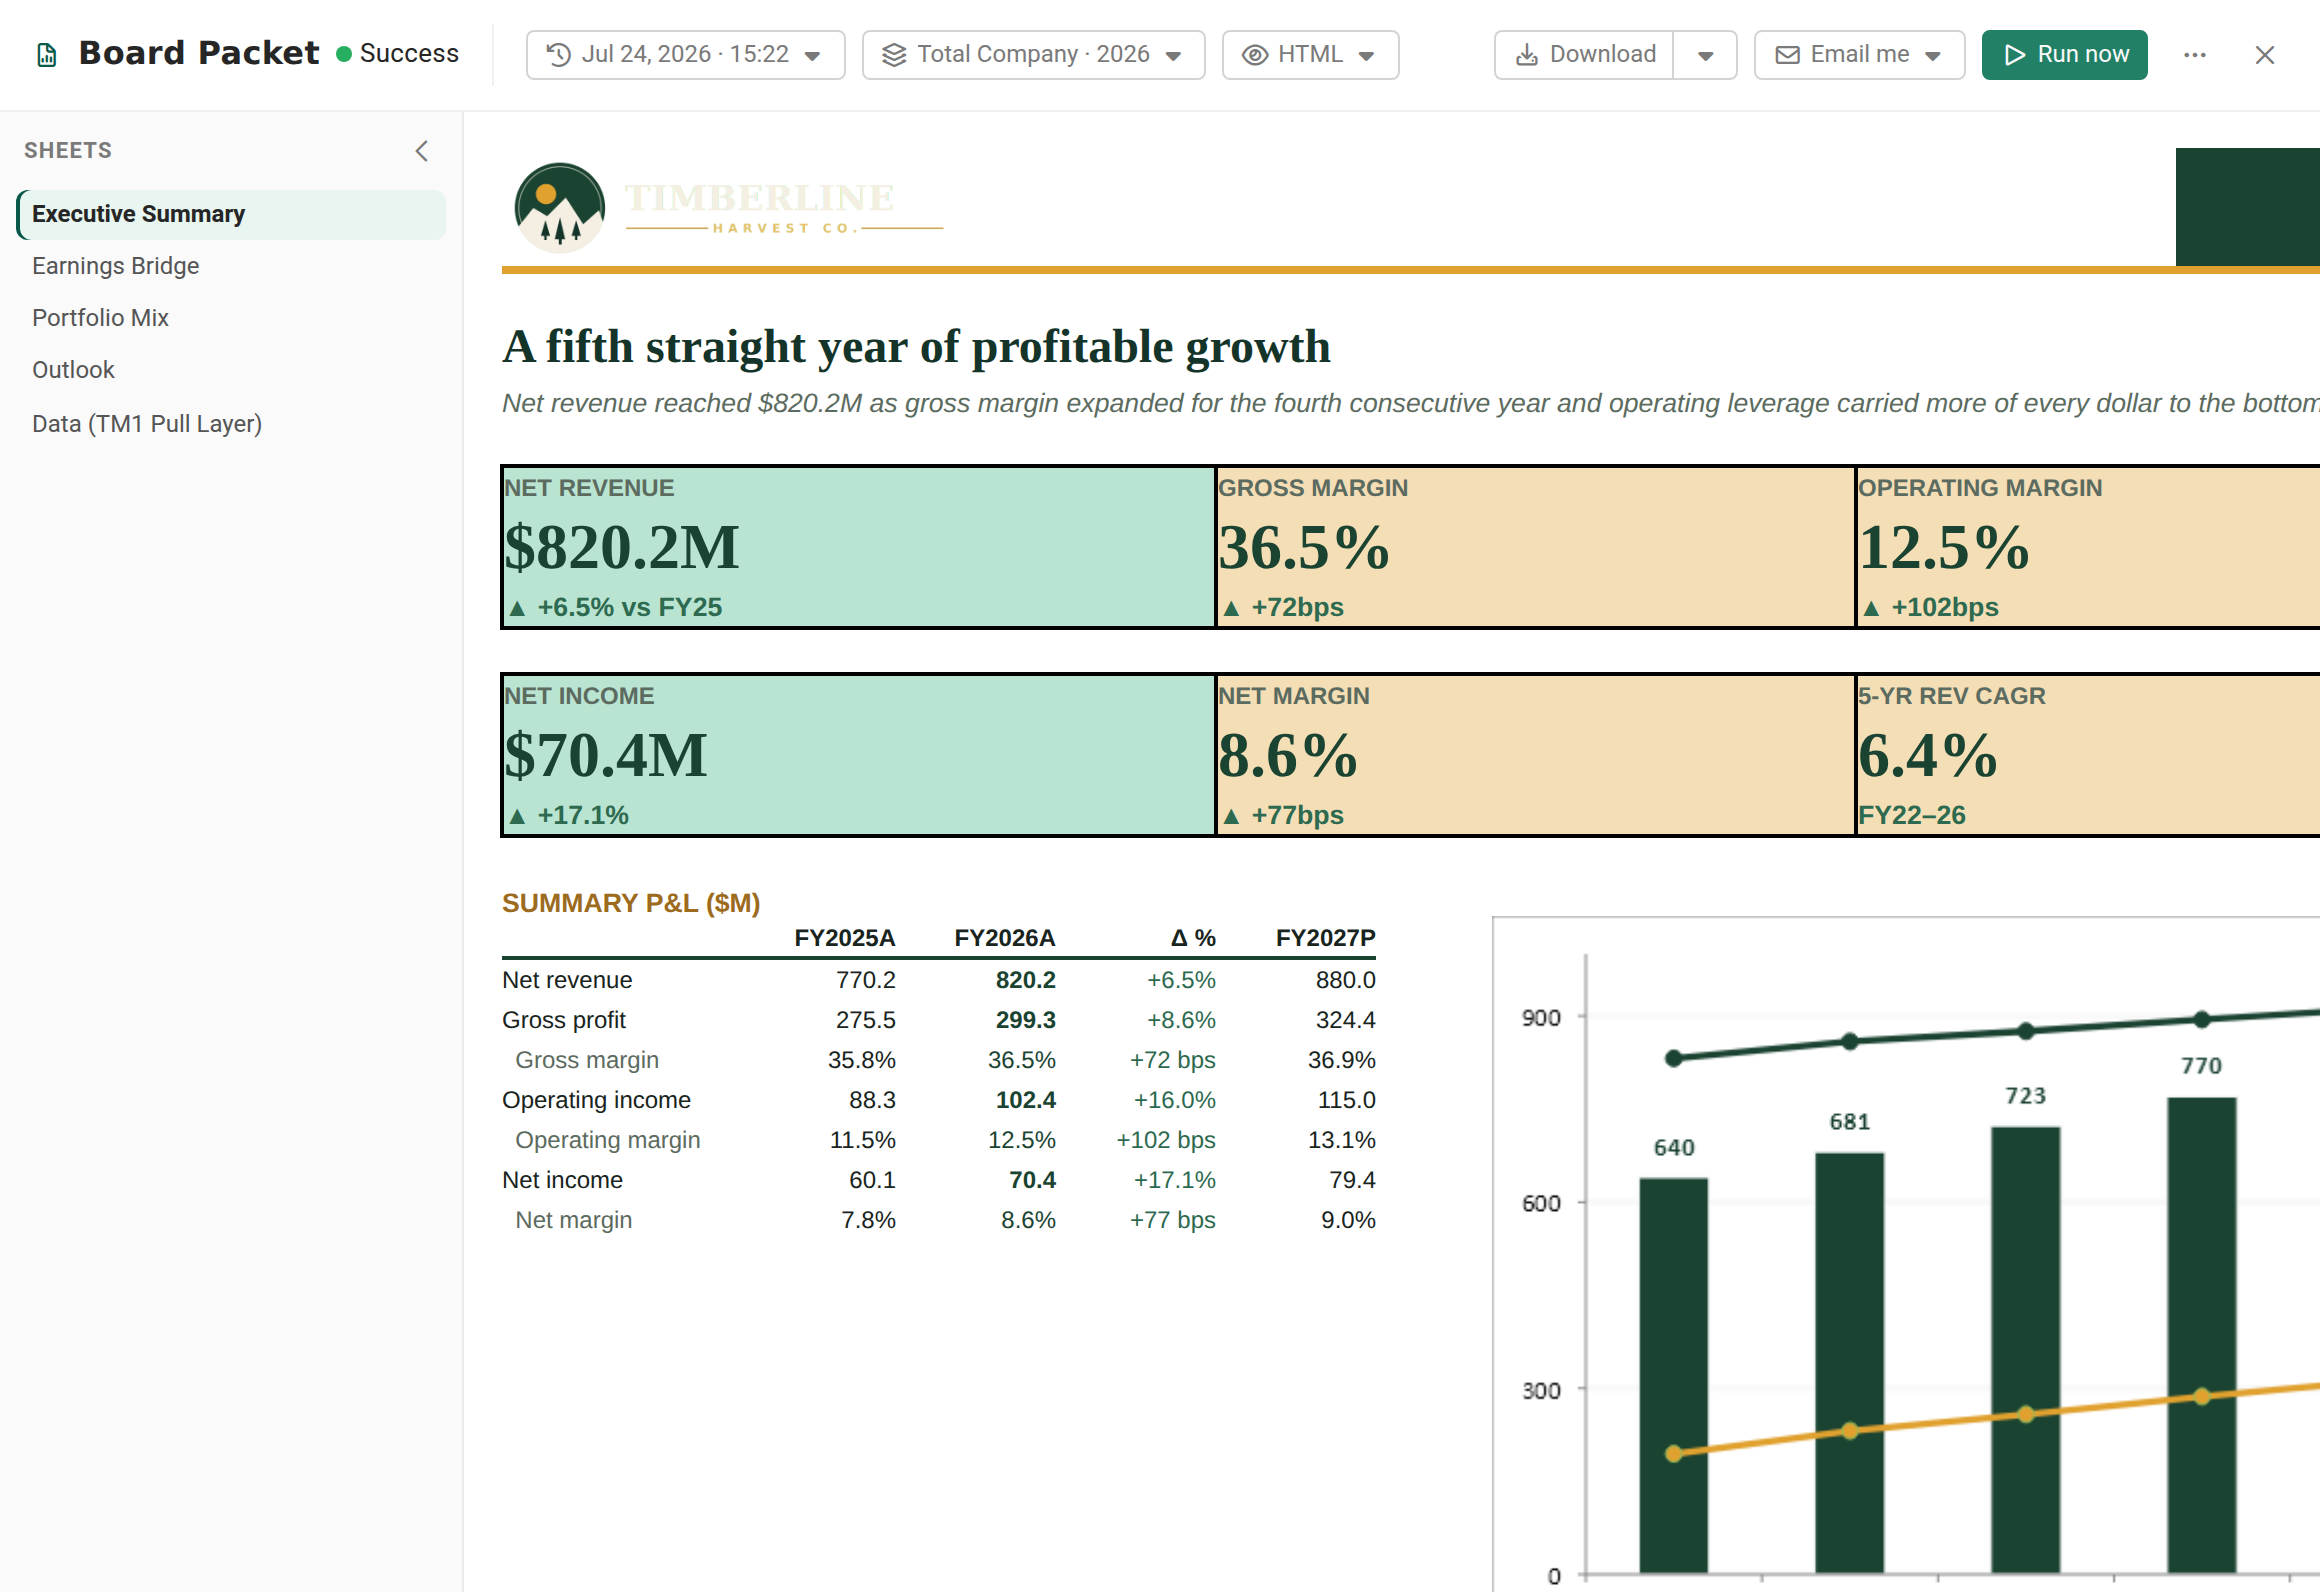
Produces a PowerPoint deck per region, four decks, one each for Total Company, North America, EMEA
and APAC. The deck is built from Timberline_Board_Pack.pptx, whose slides are linked back to named
ranges and charts in the workbook, so nobody edits PowerPoint.
The email is the other half: a greeting pulled from the workbook, a 50%-scaled screenshot of the KPI band, and the summary P&L rendered as a live HTML table.
Read this one when you want Excel to PowerPoint, or an email people actually read.
Board Packet with Division Slides#
One high-level deck, with a division section repeated inside it.
This job exists to show replication in PowerPoint. Its second source workbook contributes a single Revenue Review tab, which repeats per market, and the slide section bound to it repeats with it. That is the only reason the extra workbook is there.
Same content as Board Packet, different mechanics. The pack stays at Total Company level and
Market is set to one page per item across four values, so instead of four decks you get one
deck whose sales revenue slide repeats once per division. Outputs Excel, PDF and PowerPoint.
Read this one when you want the difference between "a file per thing" and "a page per thing".
Divisional Packet#
A board deck per division, each containing only that division's markets.
The most interesting job in the workspace, and the counterpart to the one above. Where the division-slides deck stays at total-company level and repeats divisions inside one deck, this one runs per division and then repeats each market under that division inside the pack it produces.
Both parameters are MDX, and the second depends on the first:
Regiondrills one level down from Total Company: so one output per region.Marketdrills down from whichever region this output is: so each divisional pack contains exactly its own markets.
Nothing is hard-coded. Add a region to the planning model and a new pack appears. Emails are combined by region, and the PDF gets a table-of-contents title built from the region name.
Read this one when you are wondering whether you will have to maintain a list. You will not. Read it next to Board Packet with Division Slides when you want the two replication modes side by side, which is the fastest way to understand them.
Financial Statements#
Income statement, balance sheet and cash flow, per market.
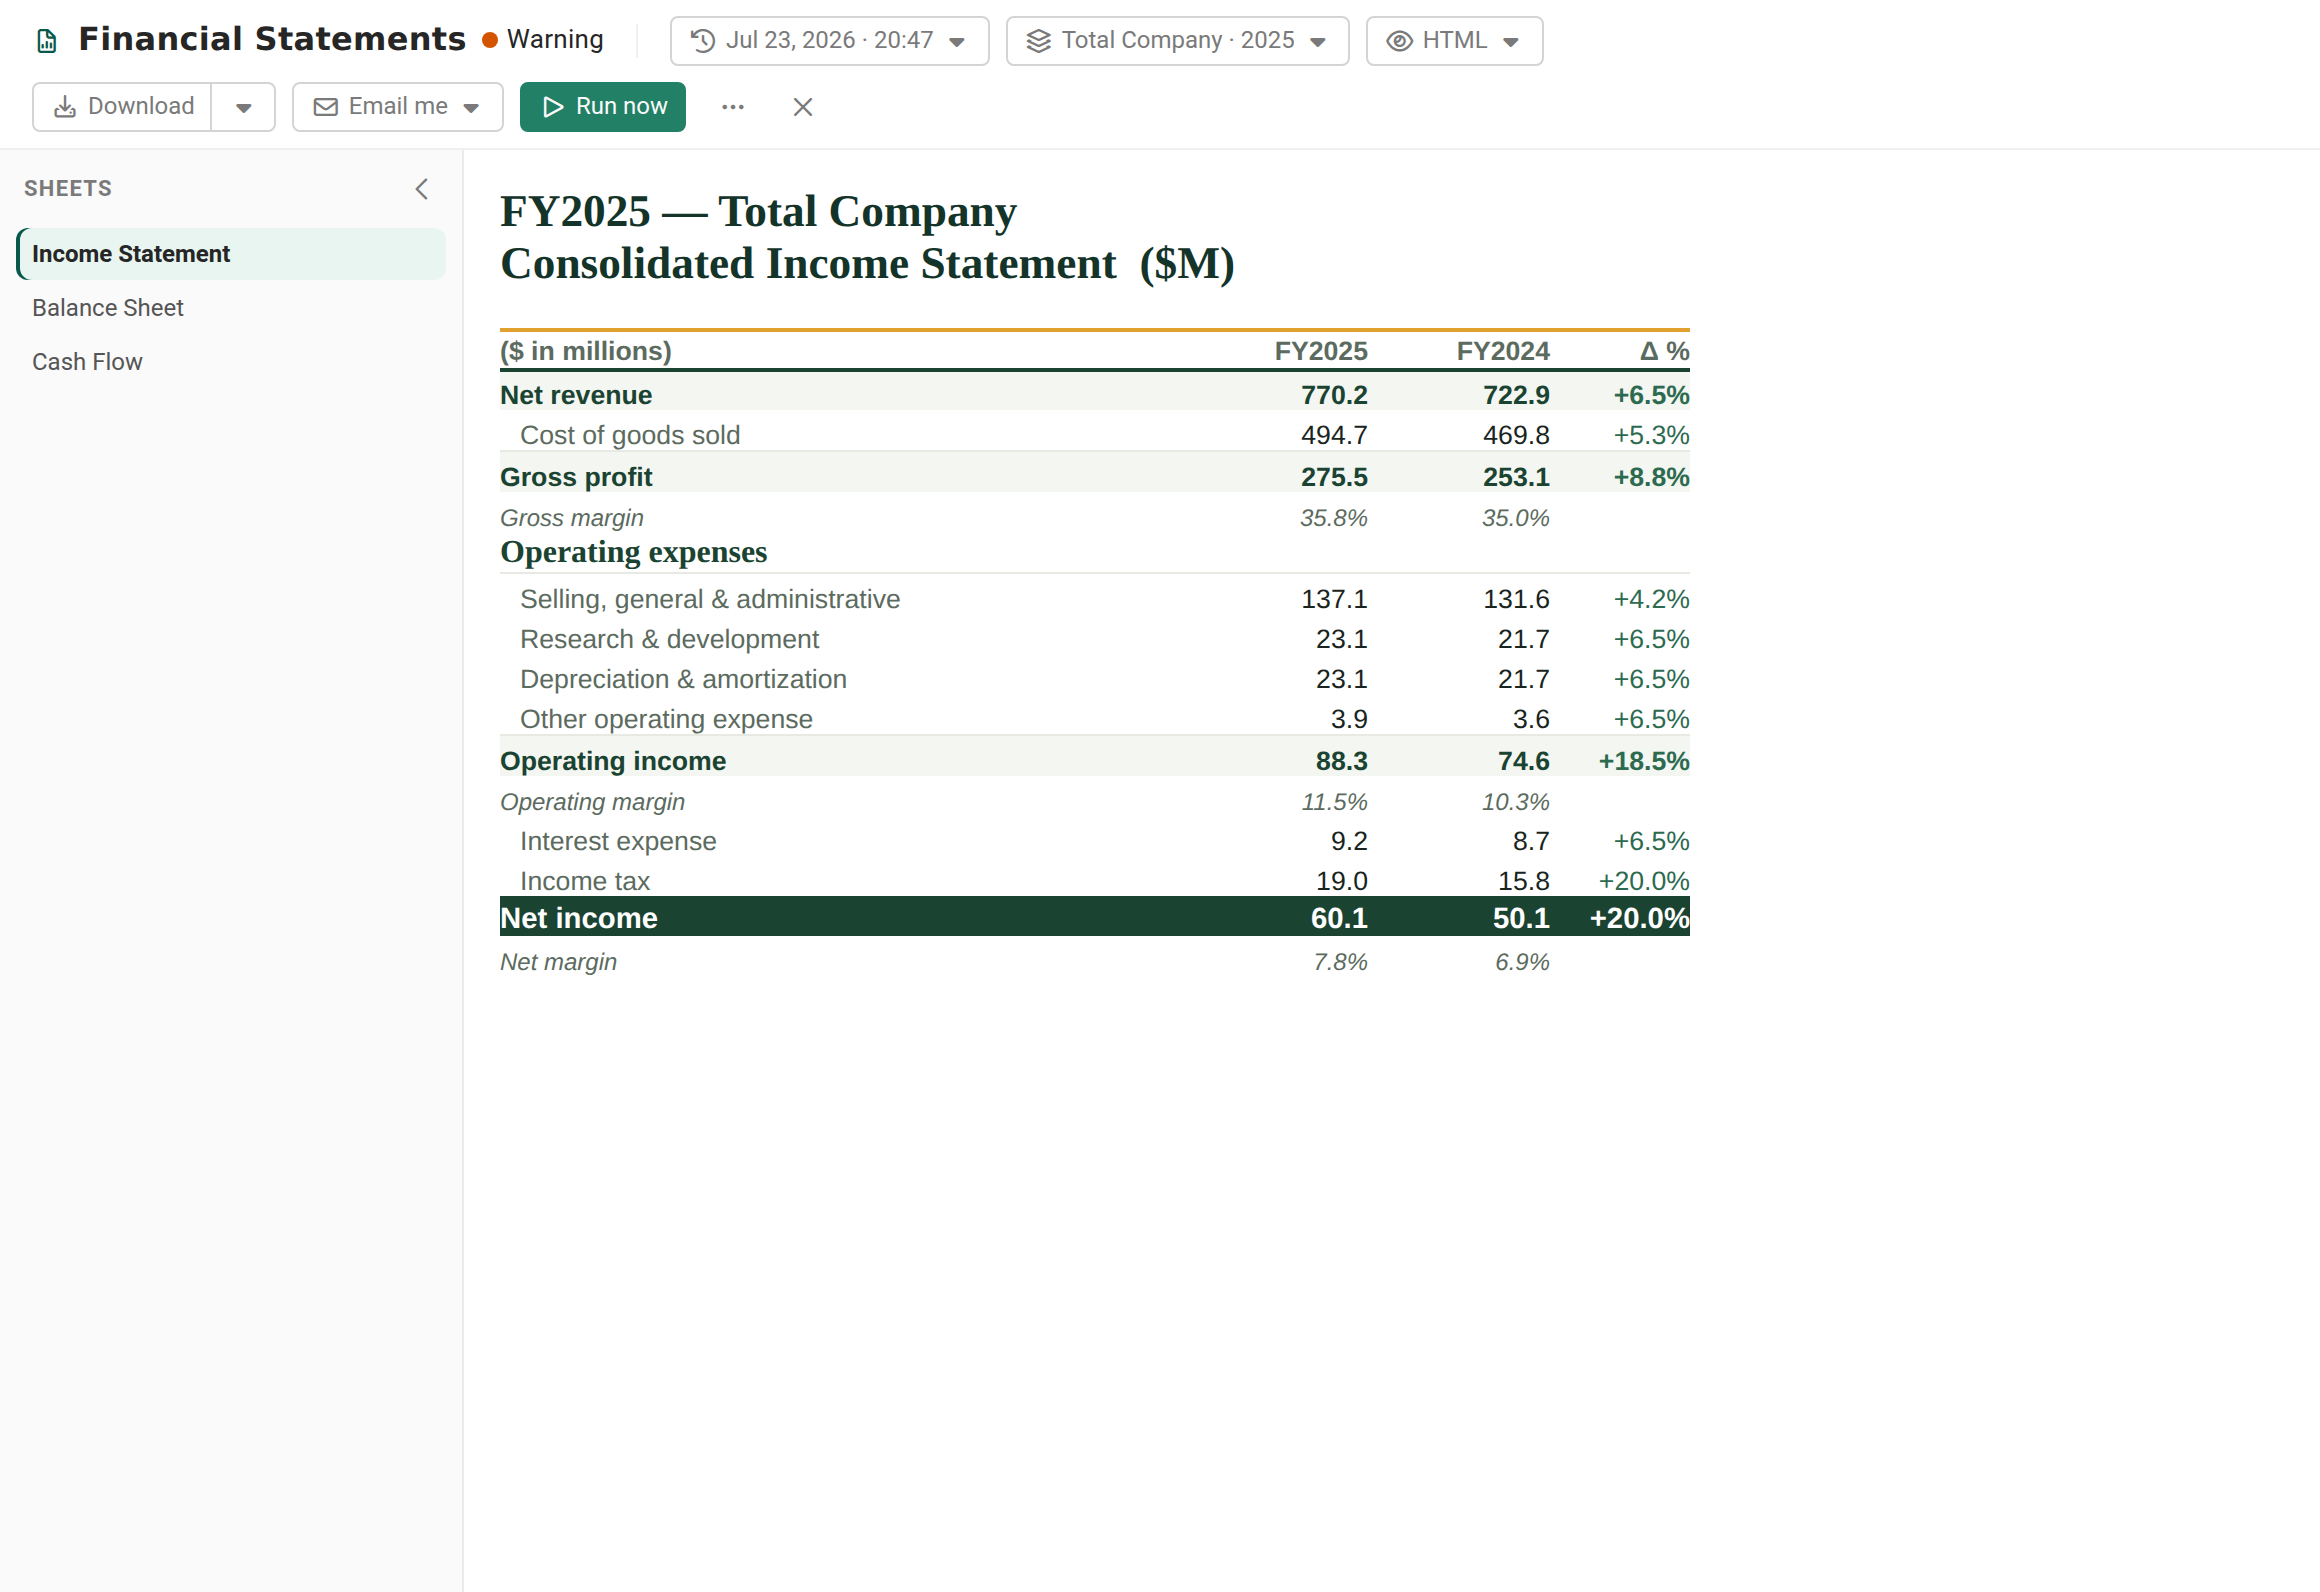
Start here if you are new. This is the most straightforward example of how a source file and a job fit together. Learn the shape here, then read the board decks.
A classic per-entity burst. Market comes from a subset in the planning model, Year from the Current
Year global parameter. Outputs Excel and PDF, with a cover page, page numbers, and a
table-of-contents title carrying the market name.
Read this one when the audience is finance and wants to see the bread-and-butter case.
Financial Statements - SharePoint#
The same statements, delivered four ways at once.
Identical content, four destinations: Email, SharePoint, OneDrive and Google Sheets. The interesting part is the paths, the SharePoint and OneDrive folders are built from parameter values:
…/Shared Documents/Timberline/{Market}/{Year}
So the output files itself by market and by year, and the folder tree is created as it goes. Nobody pre-creates folders.
Read this one when someone says "we need it in SharePoint too". (The targets are Reportworq-internal; demo from configuration unless the tenant is available.)
Timberline Sales Information#
Sales by product, channel, market and the product-by-channel cross-tab, monthly.
The deepest report and the AI showcase. Four parameters, Market produces one report each, while
Channel and Product each produce a page, so a single template yields a tab per channel and a tab
per product, with the tab names built from the values. Empty rows suppress themselves.
It carries an AI Context worksheet and a full AI profile, and its email body contains a generated commentary paragraph rather than a static message.
Read this one when the conversation turns to AI, or to "how deep can one report go".
Sales Rep Scorecard#
Team performance for a manager, plus a page per direct report.
Manager-and-their-team fan-out from one MDX pattern: Manager filters the employee dimension by role,
then Rep filters it by this manager's id. One PDF per manager, one page per rep inside it. The
roster is the model's roster, so it never goes stale.
The email opens with the manager's own attainment figure, then a generated paragraph naming the top and bottom three reps in a management-review voice.
Read this one when someone wants to see AI commentary that is actually about their numbers.
Commission Statements#
A statement per rep, delivered as one email per manager.
Bursting at scale. RepID produces one statement per rep and Period produces a page per period,
but nobody wants nine separate emails, so the job combines on a Territory cell value. Each
manager receives one message containing their whole team's statements.
The source workbook lives on the Network Folders provider, not in workspace storage, so this job needs the demo host's network root.
Read this one when the objection is "we would drown people in email".
How to run one#
- Open Workspace ▸ Timberline ▸ Financial Reports and select the job.
- Use Test / preview first, it shows you what the job will produce without delivering anything.
- To run for real, use Run from the job or from the Run Jobs screen. Choose Hold for delivery if you want the output produced but held for a human to release; otherwise it delivers immediately to the demo inbox.
- Watch it in Activity, then read the result in Report Viewer, or open the demo inbox and read the mail as the recipient did.
The exact screen names above follow the customer User Guide; this guide has not yet been re-checked click-by-click against the live demo build.
At a glance#
| Job | Fans out by | Outputs | Destinations | AI |
|---|---|---|---|---|
| Board Packet | Region (report each) | PowerPoint | profile | |
| Board Packet with Division Slides | Market (page each) | Excel, PDF, PowerPoint | profile | |
| Divisional Packet | Region (report) × Market (page, cascading) | Excel, PDF | , | |
| Financial Statements | Market (report each) | Excel, PDF | profile | |
| Financial Statements - SharePoint | Market (report each) | Excel, PDF | Email, SharePoint, OneDrive, Sheets | profile |
| Timberline Sales Information | Market (report) × Channel, Product (pages) | Excel, PDF | profile + insight | |
| Sales Rep Scorecard | Manager (report) × Rep (page, cascading) | profile + insight | ||
| Commission Statements | RepID (report) × Period (page) | Email, combined per manager | , |
Related#
- How parameters work · What bursting looks like
- Build a compelling email dashboard · Try out PowerPoint
Feedback on this page
Comments, questions, requests, or something missing or unclear? Email us - the page you are on is filled in for you.
Email feedback on this pageOr write to support@reportworq.com directly.