
Data models#
A data model is a reusable, governed layer between a source system and the people who build reports. It binds a datasource to one or more curated views, and those views are what report authors import when they build Excel Reports in the Excel add-in. A model lets you rename and reshape source columns into clean business fields once, so every report reads from a stable vocabulary that survives changes to the underlying source schema.
A model feeds two downstream workflows, not just reporting: Distribution Jobs (template-based output) and Contribution Campaigns (input forms). A contribution form binds to a model view the same way a report does, so curate a model as a shared vocabulary, not just a report source.
Before you begin#
- At least one datasource connection exists and tests successfully. See Connect a data source.
- You have permission to author data models in the workspace.
The model editor at a glance#
A model is edited in the workspace as one or more views. Creating a model is a two-step exercise: you create it against a datasource, then you edit it to curate fields, set filters and variables, and publish. The editor exposes a model-level Source tab and, per view, four sub-tabs.
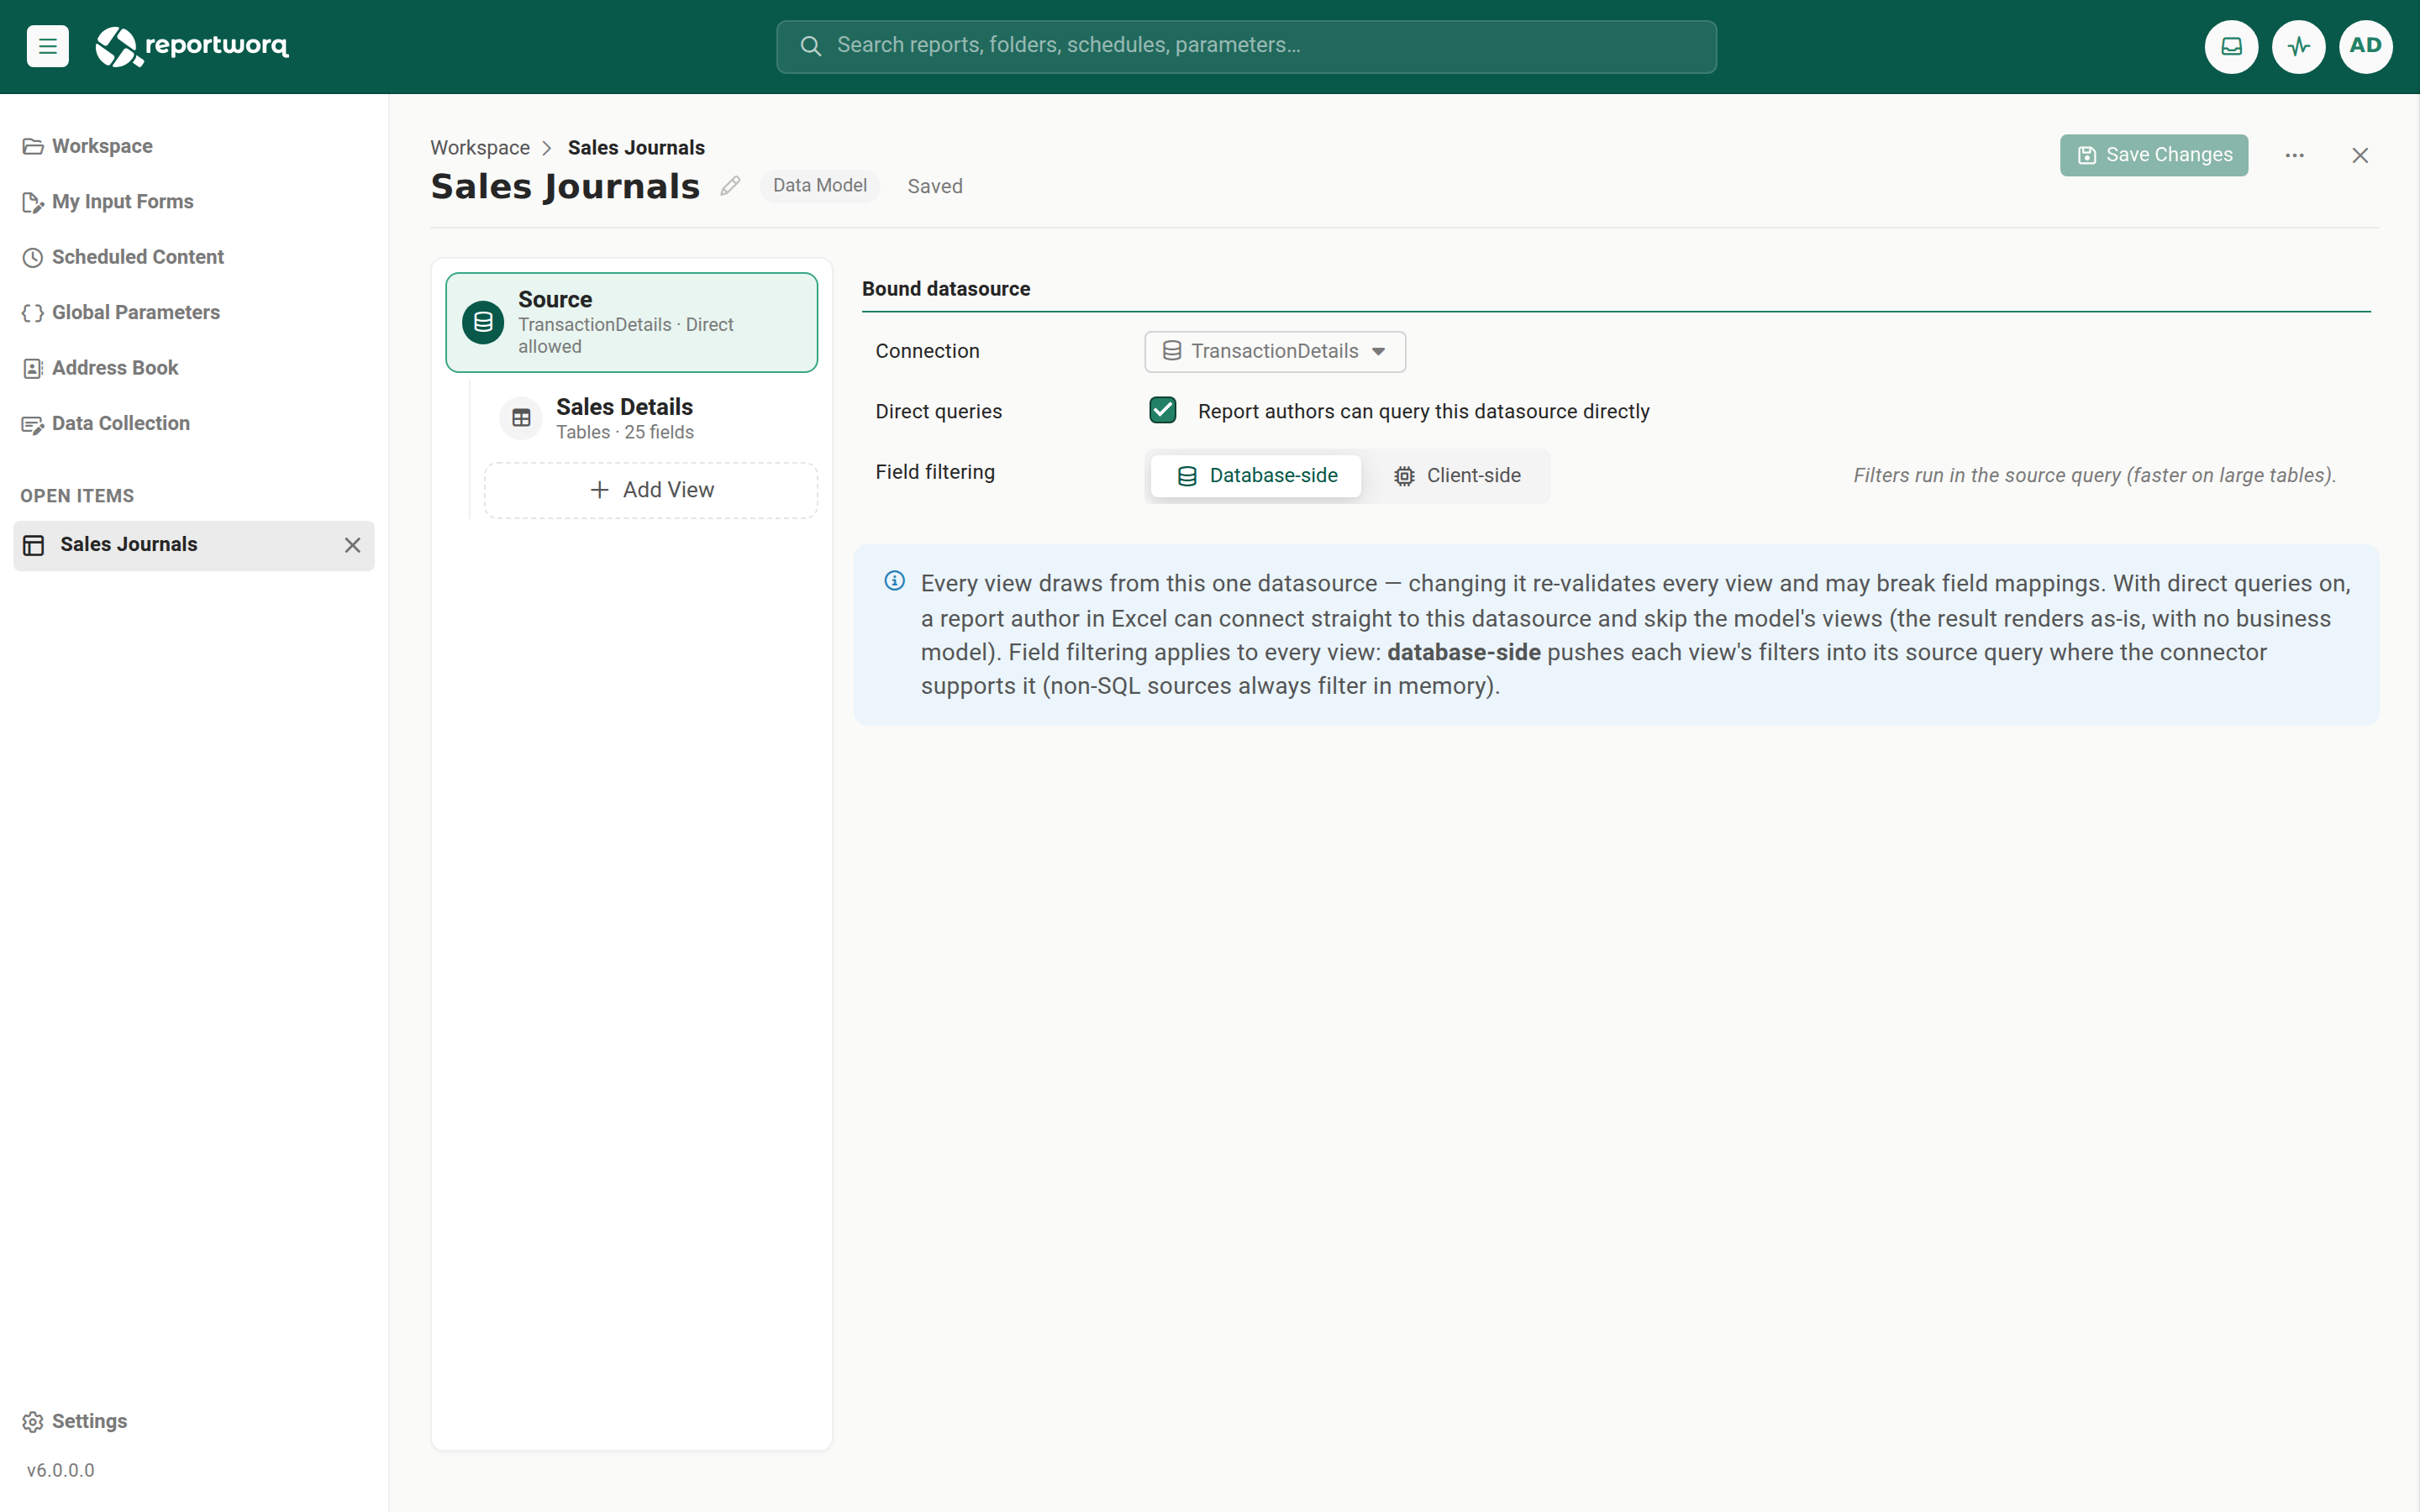
- Source tab (model level). Binds the model to a configured datasource and carries two important model-wide settings: the Direct queries toggle and the field filter mode. Both are covered below.
- Views. A view is the model's unit of output: one source query plus a curated set of fields. Add View creates another view, and a model can hold several. Each view is built through its sub-tabs:
- Connection defines the connector-specific source, for example a table for SQL or a cube data view for Planning Analytics. Use Browse datasource to explore tables and columns, then Import Fields (or Update Fields on a re-import) to generate the field list from the source.
- Fields is the curated reporting field list, auto-generated on import. Each field decouples its reporting-facing Id and Name from the source column it maps to (the Mapped Field), so renaming or re-mapping a source column does not break downstream reports. Fields can be hidden, reordered, renamed, re-typed, filtered, added, or deleted.
- Variables are model variables that parameterize the source query and flow downstream to reporting and bursting. A variable's default is what preview and reports resolve when nothing overrides it.
- Preview runs the view and shows the resolved rows after variables and field projection are applied.
Curate the fields#
The Fields tab is where a raw source becomes a governed model. Each field shows a green mapped chip or an amber unmapped chip, recomputed automatically as you edit.
- Unmapped fields are excluded until you remap them. A field that is unmapped, whether you added it without a mapping or it lost its mapping after a source change, is left out of the model, the preview, and every report until you point it back at a source column. Unmapped does not mean "author fills it in later", there is no calculated or literal field type; unmapped simply means excluded.
- Field names must be unique within a view. A duplicate display name is rejected and the edit reverts.
- The Fields list is not paged. Field order is set by dragging rows, and a drag cannot cross a page boundary, so every field is listed on one scrolling list however many there are. Other long lists in Reportworq page at 100 rows, this one deliberately does not.
- Hidden fields stay queryable. Hiding a field removes it from the report author's field list but keeps it usable as a filter reference, so you can filter on a key column without exposing it. Use Hide all or Show all to toggle visibility in bulk.
- Quote a text value only when it lands in a SQL string literal. A
{{variable}}is substituted into the source query as a raw text replace, with no automatic quoting. When a variable feeds a SQL query on a relational source (SQL Server, OLE DB, ODBC, SQLite, or a CData source), a text value that must become a SQL string literal has to carry its own quotes in the query, for example'{{state}}'resolving to'Maine'; numeric values are bare. This is a SQL-syntax requirement of the query, not a property of the variable's default. Sources whose query text is not SQL, such as Planning Analytics and the planning-tool APIs, do not need the quoting.
Choose where filters run (filter mode)#
The Source tab's filter mode decides where a model's field filters are evaluated.
- Database-side (pushdown) translates the filter into the source query, so the source engine returns only matching rows. Choose this for large sources and selective filters: it minimizes data transfer and leans on the source's indexes.
- Client-side (in-memory) retrieves the rows first and filters them inside Reportworq. Choose this when the result set is already small.
Important: pushdown is SQL-only. Non-SQL sources (Planning Analytics, the planning-tool APIs, and other non-relational connectors) always filter in memory regardless of this setting. So for a TM1 or Workday Adaptive model, filters are applied client-side whatever the mode says.
Direct queries: modeled view or direct query#
Direct queries is a Source-tab toggle, and it defaults off. Leaving it off keeps the model view-only: authors consume the curated, published views. Turning it on lets a report author query the datasource directly and bind to the query result's own columns, skipping the model's curated fields entirely.
When to use each:
- Use a published view for governed, reusable, change-resilient reporting. The field-mapping abstraction survives source schema changes, and the view is reusable across many reports and forms.
- Use a direct query for a one-off, well-understood, or exploratory pull, for example running a known SQL extract or inspecting a source before deciding whether to invest in a curated view. Direct-query results do not carry the field-mapping abstraction, so they do not survive source changes and are not centrally reusable.
Publish a view#
Each view carries a Draft or Published state, tracked per view, so one model can hold a mix of both.
- Build and preview the view in Draft while you are still shaping it. Draft views are hidden from report authors.
- Switch the view to Published when it is ready. Only published views appear in the Excel add-in's Connect picker for report authors to import.
When to use the two states together: publishing gates the picker, not existing bindings. A report already bound to a view keeps resolving even after you pull that view back to Draft, so you can safely revise a published view in Draft while the live reports keep running, then re-publish once the revision is validated.
Notes and limits#
- The Preview tab is a fixed, fresh 100-row run with no cache. Report display and formatting (grouping, aggregates, sort priority, format modes) are authored in the Excel add-in's list-report builder, not in the model editor.
- Re-importing an already-imported table creates an additional copy rather than updating the existing one. Edit the existing view in place instead. See the Connector catalog for the same trap with Pigment blocks.
- Opening a model in View mode redirects to Edit (for Authors) or Properties (for Users); a model has no separate read-only surface.
Going deeper. For the field labels and query types of a specific source, see Connect IBM Planning Analytics, Connect SQL, OLE DB, and ODBC, and the Connector catalog.
Feedback on this page
Comments, questions, requests, or something missing or unclear? Email us - the page you are on is filled in for you.
Email feedback on this pageOr write to support@reportworq.com directly.