
This article describes how to create reporting models for relational datasources. This includes SQL datasources as well as other datasources considered to be relational based on how Reportworq accesses the data. Model data is structured and presented in tabular form as relational data tables. Each of these tables is a reporting model.
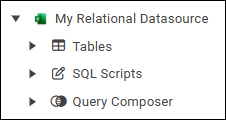
If your datasource's node in the model tree contains nodes named Tables, SQL Scripts, and Query Composer, as shown in the following figure, it is considered relational for the purposes of report modeling.
This article includes the following topics about the three ways to create reporting models (tables) for relational datasources:
- Importing Tables from the Datasource
- Creating Tables using the SQL Scripts Tool
- Creating Tables using the Query Composer
After you create reporting models, you must edit their properties.
Importing Tables from the Datasource#
You can bulk import multiple tables at the same time. After you import them, you must establish data connections to each table individually.
To import tables:
- In the model tree, expand the top-level node for the datasource.
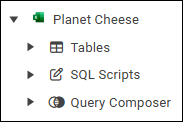
- Hover over Tables, and then select the add icon. The Bulk Import dialog appears.
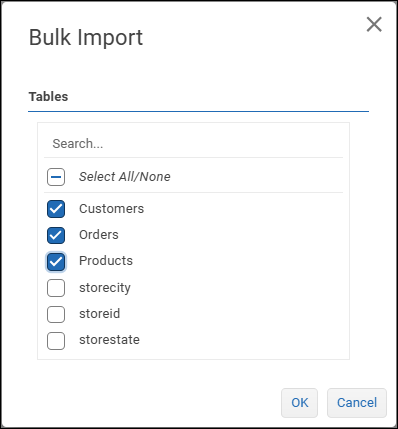
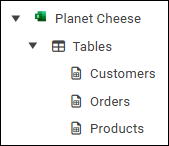
- Select the tables you want to import, and then select OK. Note: If you select a table that has already been imported, an additional copy is created. The selected tables appear in the tree.
To establish the data connection for a table:
- In the Model view, select Edit Data Connection.
 The Table selection list appears, with the current table pre-selected.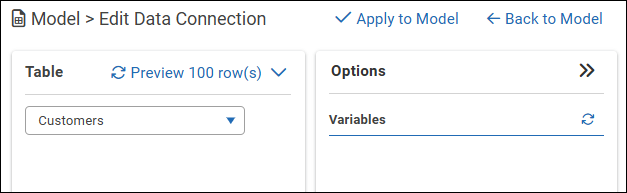
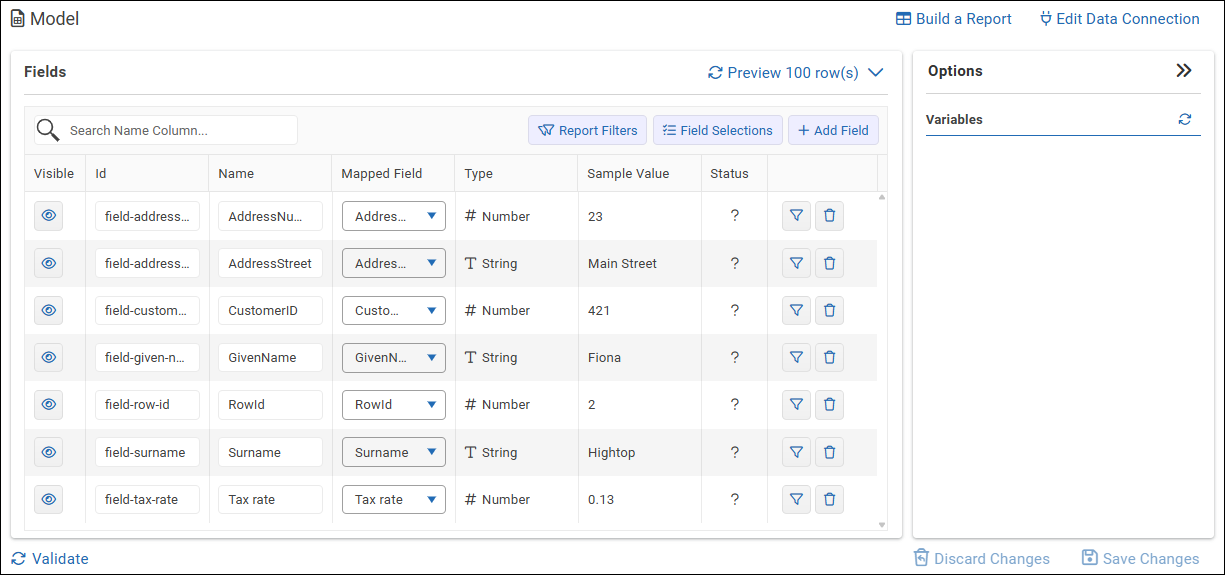
- Select Apply to Model. The Fields view displays data field properties. Each row represents a data field in the model.
- Select Save Changes.
- Repeat these steps for each table you imported.
Creating Tables using the SQL Scripts Tool#
The SQL Scripts tool enables you to create tables. SQL scripts can reference fields from any tables in the datasource.
To create an SQL Script:
- In the model tree, expand the top-level node for the datasource.
- Hover over SQL Scripts, and then select the add icon. The New SQL Script dialog appears.
- Specify a unique name for the script, and then select OK. The Model view appears.
- In the Model view, select Edit Data Connection. The SQL Script area displays the script box, which is initially blank.
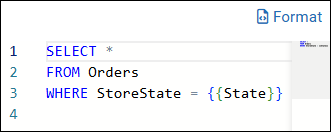
- In the script box, type the SQL script. The following is an example.
 Tips:
Tips:
- The SQL script can reference fields from any tables in the datasource.
- The SQL script can include Reportworq variables, which are declared by enclosing the variable name in double curly braces. For example, {{variable name}}.
- To optimize the readability of the script, select Format.
- If the script includes variables, select the Variables refresh icon
 and then provide values for the variables. The values you specify become defaults. Tip: If a variable value is text, enclose it in single quotes. For example, 'Maine'.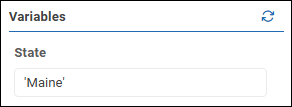
- To see the results of the script, select Preview 100 row(s). The script runs, and the results appear in the Preview area. Tip: The default number of rows displayed is 100 but you can change it. For more information, see Previewing Data.
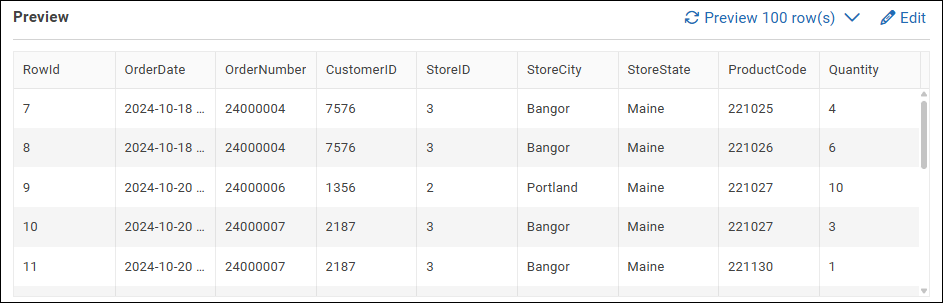 Tip: To return to the SQL Script view, select Edit at the top right of the Preview area.
 - When you are finished creating the script, select Apply to Model. The Fields view displays data field properties. Each row represents a data field in the model.
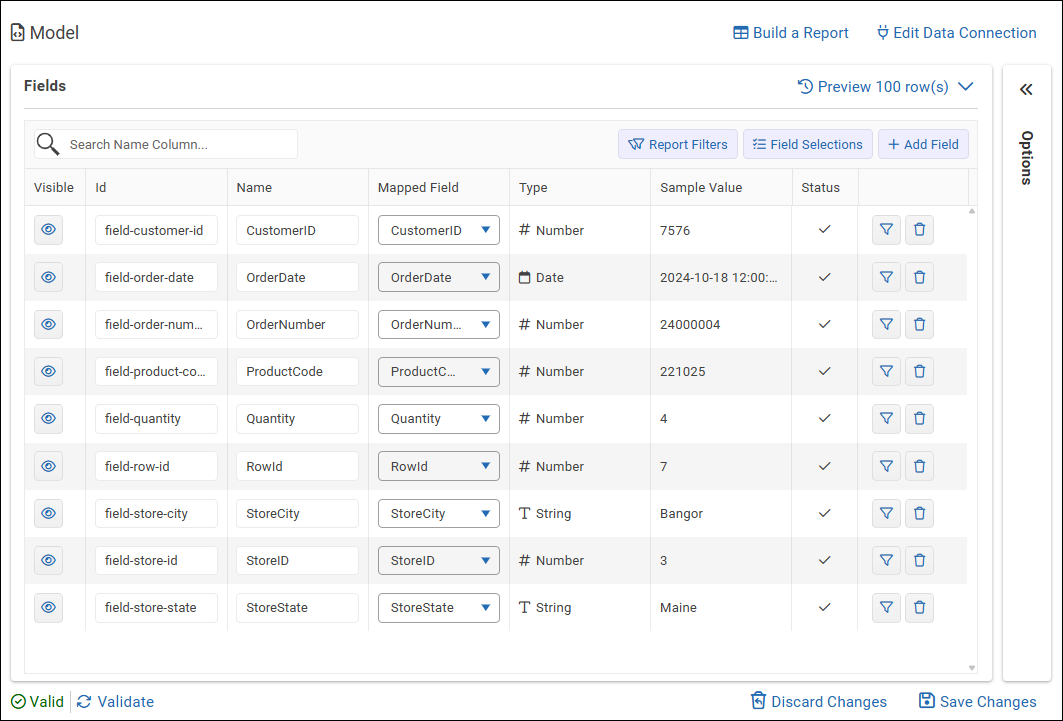
- Select Save Changes.
Creating Tables using Query Composer#
The Query Composer is a graphic modeling workspace that enables you to compose queries that create tables. Queries can reference fields from any tables in the datasource and can include table joins and filters.
The main steps are as follows:
- Create a new query.
- Add tables to the query, either directly from the datasource and/or via SQL scripts. Tip: SQL scripts can import fields from multiple tables and can include joins between tables.
- Configure the properties of tables and fields.
The following topics describe how to create a query, add tables, and configure properties:
- Creating Queries
- Adding Tables from the Datasource
- Adding Tables using SQL Scripts
- Configuring Table Properties
Creating Queries#
Each query produces one table.
To create a query:
- In the model tree, expand the top-level node of the datasource.
- Hover over Query Composer, and then select the add icon.
 The New Query Composition canvas appears.
 - Specify a unique name for the query, and then select OK. The Model view appears.
- In the Model view, select Edit Data Connection. The Query Composition canvas appears. This is where you add and configure tables that define the query.
Adding Tables from the Datasource#
To add a table from the datasource:
- Select Add Table. The Add Table dialog appears.
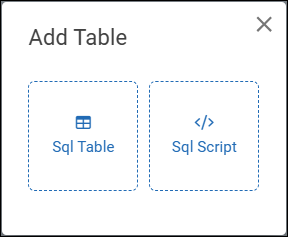
- Select the Sql Table button. The Edit Table dialog appears.
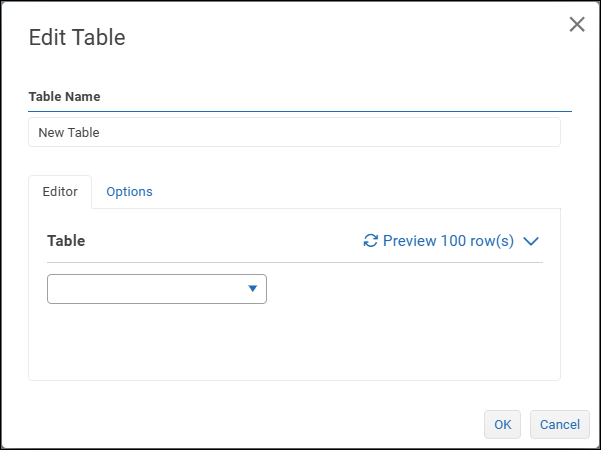
- Specify a unique Table Name.
- On the Editor tab, expand the Table list and select the table you want to add. Tip: To confirm that you selected the correct table, you can select Preview to view data. To return to the Edit Table dialog, select Edit.
- Select the Variables refresh icon , and then if any variables are listed, provide values for them.
- Select OK. The table appears on the query canvas. It includes a list of data fields. The first table added to the model is the root table. Tip: You can drag and resize tables.
Adding Tables using SQL Scripts#
To add a table by creating an SQL script:
- Select Add Table. The Add Table dialog appears.
- Select the Sql Script button. The Edit Table dialog appears.
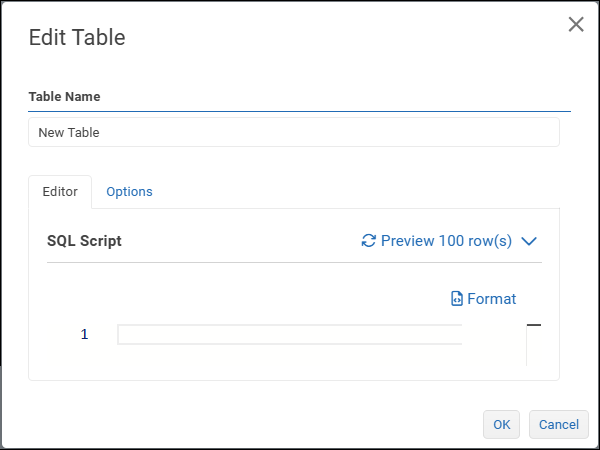 The SQL Script area displays the script box, which is initially blank.
 - On the Editor tab, in the script box, type the SQL script.
 Tips:
Tips:
- The SQL script can reference fields from any tables in the datasource.
- The SQL script can include Reportworq variables, which are declared by enclosing the variable name in double curly braces. For example, {{variable name}}.
- To preview the results of the query, select Preview. Then select Edit.
- To optimize the readability of the script at any time, select Format.
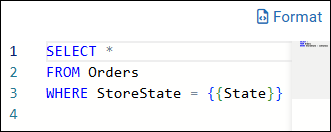
- Select the Variables refresh icon , and then if any variables are listed, provide values for them. Tip: If the variable value is text, enclose it in single quotes, for example, 'Maine'.
- Select OK. The table appears on the query canvas. It includes a list of data fields. The first table added to the model is the root table. Tip: You can drag and resize tables.
Configuring Table Properties#
You can select which fields to include, specify an alias (optional), define filters (optional), and configure table joins (optional).
To configure table properties:
- Configure table properties and variables:
- Select the table's title bar. Table properties appear in the right task pane.
- On the Properties tab, select the fields you want to include in the model. Tip: Icons beside each field name indicates its data type. For example, # indicates numeric data, and T indicates text data.
- If your query includes variables, select the Variables tab, select the Variables refresh icon and then provide values for the variables. Tip: If the variable value is text, enclose it in single quotes, for example, 'Maine'.
- Configure properties for each field:
- In the query diagram, select the field. Field properties appear in the right task pane.
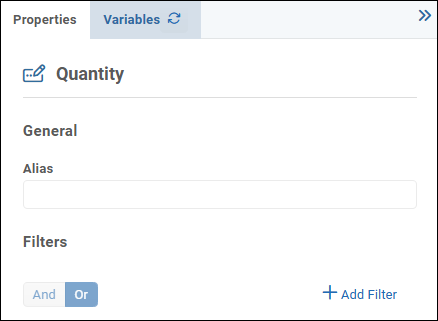
- On the Properties tab, specify an alternative name for the field in the Alias box if desired. This is the field name report authors see. Tip: When you provide an alias, the query diagram shows it in italic lettering.
- If you want to filter data for this field:
- Select Add Filter. A filter expression box appears.
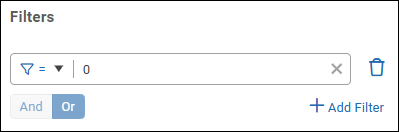
- Define the first filter expression by selecting a comparison operator and specifying a test value. In the following example, the filter requires the data value to be greater than or equal to 5.
 If the test value is text, enclose it in single quotes as shown below:
  The test value can be a variable. In the following example, the test value is a variable named myVar.
- Select Add Filter. A filter expression box appears.
- If additional filter expressions are required, select Add Filter and then select a logical operator:
- And -- Data must satisfy all filter expressions in the set.
- Or -- Data must satisfy one or more filter expressions in the set.
- Define additional filter expressions as required. Tip: Filters can also be applied at the report level, as part of editing the model. Only data that satisfies all filters is made available to report authors.
- When you are finished configuring all tables in the query, select Apply to Model. The Fields view appears. You can continue developing the model by doing one of the following:
- Select Edit Data Connection to return to the query diagram, where you can create more tables and/or join tables as required. Tip: Steps for joining tables appear later in this article.
- Edit data field properties. For more information, see Editing Models.
To create a join between two tables:
- On the query diagram, note that one side of each table has a triangle, and the other side may have a dot. When tables are joined, triangles denote Source tables and dots denote Target tables.
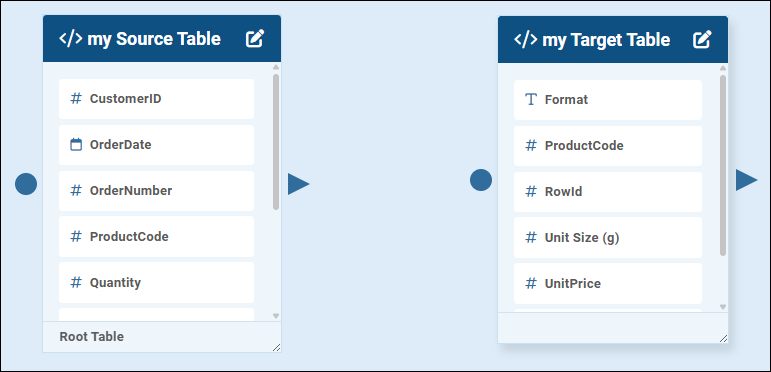
- Select the triangle of one table and drag to the dot of another, to initiate a join between them. An Inner Join icon appears between the tables.
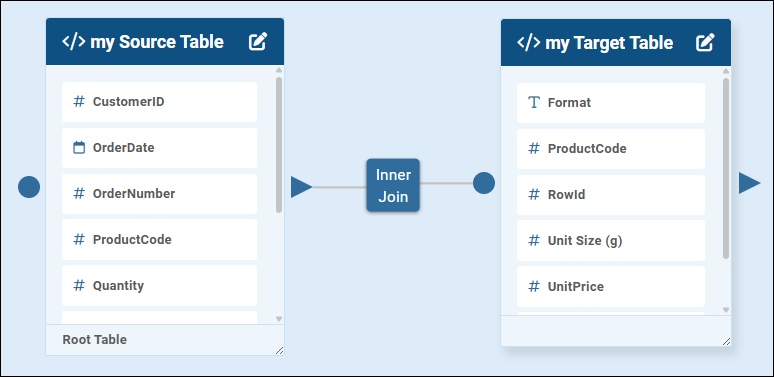
- Select the join icon. Table Join properties appear in the right task pane.
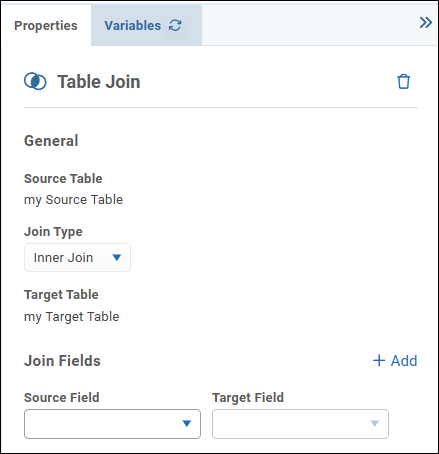
- Select the Join Type (Inner, Left, Right, Full, Cross, or Self).
- In the Source Field list and the Target Field list, select the key fields for the join. In the following example, each table has a key field named ProductCode.

- If additional joins between these two tables are required, select Add and then define them.
- Select Apply to Model. The Fields view appears. The join is saved.
Feedback on this page
Comments, questions, requests, or something missing or unclear? Email us - the page you are on is filled in for you.
Email feedback on this pageOr write to support@reportworq.com directly.