
Overview#
The Reportworq add-in for Microsoft Office enables Reportworq Administrators to create PowerPoint presentations that contain shapes linked to data from Distribution Jobs. Whenever the Job runs, Reportworq generates PowerPoint presentations that contain the latest data and distributes them to licensed end users who see only data that is relevant to them.
Accessing the Reportworq add-in
This article consists of two main sections -- one for Reportworq Administrators and one for Reportworq end users who receive generated presentations:
- For Administrators: Creating Linked PowerPoint Presentations -- Describes how to create a source presentation file, prepare a Reportworq Job that is linked to it, design the layout, and schedule distribution of generated presentations to users.
- For Users: Working with Linked PowerPoint Presentations -- Describes how to view and customize linked presentations. Depending on your permissions, you may also be able to refresh the presentation to show data from previous versions of the underlying Job output, or run the Job to retrieve the latest data.
Note for Administrators: SSL encryption is required to use the Reportworq add-in. For more information, see Configuration.
Creating Linked PowerPoint Presentations#
Each linked PowerPoint presentation is based on a Reportworq Job and a PowerPoint source presentation (.pptx file) that acts as a template. The Job and the source presentation are linked so that each time the Job runs, Reportworq retrieves the latest data from the Job's datasource(s) and generates PowerPoint presentations based on that data. The Job contains burst sets that assign contacts as recipients for each generated presentation. The recipients, who are licensed in Reportworq Authentication as PowerPoint End Users, receive presentations that contain only the data that is relevant to them.
This section describes how to create linked PowerPoint presentations. Procedures in this section must be performed by a Reportworq Administrator.
Before you begin, create a network folder to store source presentations and configure it to be a Report Provider. Note the folder location so you can add files to it later.
The main steps are as follows:
- Create a Source Presentation File
- Prepare a Reportworq Job for Linking
- Design the Source Presentation
- Test Output and Run the Job
Create a Source Presentation File#
Reportworq uses a PowerPoint (.pptx) file as a template to generate linked presentations for end users. This template is the source presentation.
Before you can design the layout for linked PowerPoint presentations, you must create a source presentation file and save it in the Report Provider folder you created. At this stage, the source presentation file can be blank or it can be a file saved from your corporate PowerPoint template. Note the filename so you can select it later.
Prepare a Reportworq Job for Linking#
Each linked PowerPoint presentation is associated with a Reportworq Distribution Job. Certain Job settings must be specially configured to make the Job suitable for generating linked PowerPoint presentations.
This section describes how to prepare a bursted Reportworq Job that generates and delivers linked PowerPoint presentations to licensed end users of the Reportworq PowerPoint add-in.
To prepare a Job for generating linked PowerPoint presentations:
- Create or open a Distribution Job in Reportworq.
- On the Reports tab, ensure that all required reports have been added and all report parameters are defined. Note: When you later create the source presentation, you will select data items based on charts, named ranges, text boxes, and cell ranges contained in the report(s). Ensure that the underlying Excel source report(s) have all the data objects you want to include in your generated PowerPoint presentations.
- On the Parameters tab, ensure that all parameters required for bursting have been added.
- On the Bursting tab:
- Create a burst set for each linked presentation to be generated.
- For each burst set, select a Contact, who is the person who will receive the linked presentation. Tip: If you want to send a given presentation to an additional recipient, you can create an additional burst set and select them as the Contact.
- On the Distribution tab, configure the following:
- File Name -- Specify a name for the generated PowerPoint presentation files. In addition to text, you can include variables, parameters, timestamps, etc. to customize the file name.
- File Format(s) -- Select PowerPoint.

- Destination(s) -- Select one or more distributors. In the example below, Email is selected.

- Format Options -- Select the pencil icon
 beside PowerPoint to open the Power Point Options pane.
 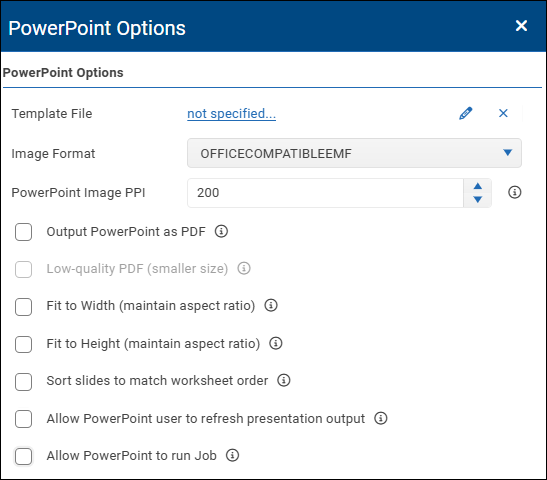 Configure the options as required:
- For Template File, select the pencil icon and then browse to select the PowerPoint source presentation (.pptx file) you want to link to the Job.
- Configure the appearance of graphic images that appear in generated PowerPoint presentations:
- Image Format -- Select the graphics file type.
- PowerPoint Image PPI -- Specify the resolution, in pixels per inch.
- Fit to Width and Fit to Height -- These options determine whether Reportworq resizes data-linked images to maintain their proportions:
- Fit to Width -- The width of the picture is maintained and the height adjusts as needed.
- Fit to Height -- The height of the picture is maintained and the width adjusts as needed.
- If both options are selected, Reportworq does not adjust image height or width. Images may appear to be stretched horizontally or vertically.
- If neither option is selected, settings for individual shapes in the source presentation determine whether Reportworq adjusts image height or width.
- All these settings are defaults that may be overridden by settings for individual shapes in the source presentation.
- If you want to allow recipients to refresh presentation data based on their choice of Job output versions, select Allow PowerPoint user to refresh presentation output. Whenever the Reportworq Job runs, it generates a new version of the output that includes the latest data from the original datasource(s). Recipients can select which version of the output data appears in their presentation. Notes:
- If the record of a Job is deleted from the Job History, that Job's data is no longer available for refreshing presentations.
- If you disable this option, recipients cannot refresh any presentations based on this Job, including presentations generated previously when this option was enabled.
- If you want to allow recipients to run the Reportworq Job on demand, select Allow PowerPoint user to run Job and Allow PowerPoint user to refresh presentation output. The recipient can run the Job to create a new version of the output that includes the latest data from the original datasource(s). They can refresh the presentation so it shows that version of the data. Notes:
- When a recipient runs a Job, Reportworq generates output for that recipient's presentation(s) only. The output is not available to other recipients and the Job does not appear in their Job History.
- If you disable this option, recipients cannot run this Job from any presentations, including ones generated previously when this option was enabled.
- For Template File, select the pencil icon
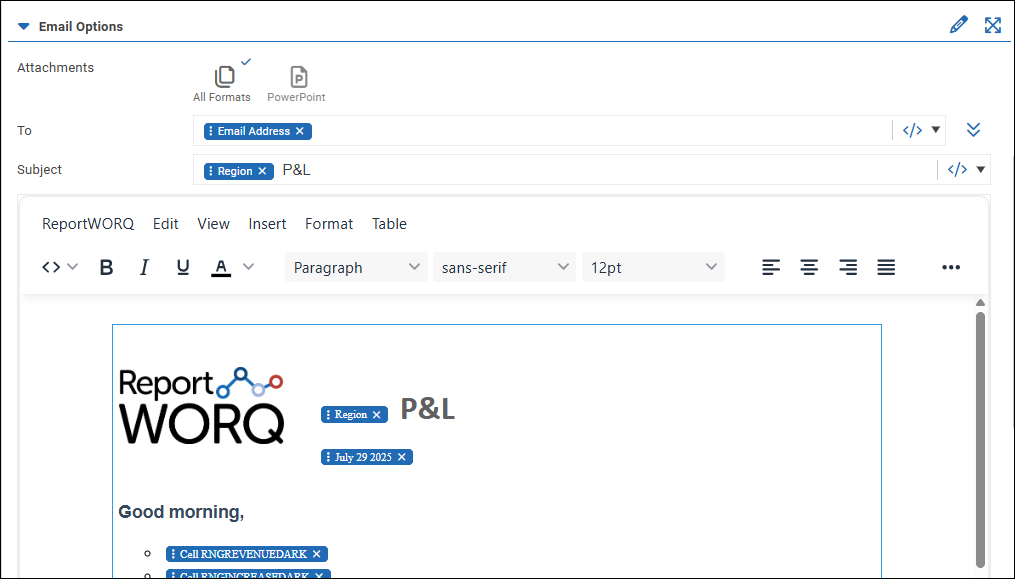
- For each destination (distributor) you selected, ensure that PowerPoint (or All Formats) is selected as Attachment options. The following figure shows part of the Email Options, area, with PowerPoint selected.
- Configure other destination options as required.
- Select Save Changes.
- On the Test tab, test the Job to ensure it generates output as desired.
Design the Source Presentation#
Reportworq uses a PowerPoint presentation (.pptx file) as a template for generating linked presentations for end users. This template is the source presentation.
As a Reportworq Administrator, you link the source presentation to the associated Reportworq Job and then import data-linked shapes. These shapes are based on charts, named ranges, text boxes, and cell ranges contained in the Excel report(s) upon which the Job is based. When the Job runs, data in the imported shapes is updated with fresh data from the datasource(s). PowerPoint presentations are generated and distributed to licensed PowerPoint End Users. The Job is bursted so each end user receives only slides and data that are relevant to them.
The following table list the types of data you can import and the shapes that can be imported in PowerPoint.
| Data you can import from the Excel report(s) | Imported shape options |
| Range of cells, via custom address or named range | Picture, data table |
| Picture | Picture |
| Chart | Picture |
| Text box | Linked text box or a portion of text in an inline text box. |
Tip: Understanding the charts, named ranges, text boxes, and other data objects in the underlying Excel report(s) helps when designing the source presentation. You can have the report(s) open in Excel while you import data-linked shapes to your source presentation in PowerPoint. If you add a new data object, such as a chart, to an Excel report and save it, select the Refresh Report List  icon in PowerPoint (see below) to update the Report Worksheet list and the Worksheet Object list. Be sure to close the Excel report(s) before you run the Job.
Opening and Linking the Source Presentation#
When you first open the source presentation in PowerPoint, you must link it to the associated Reportworq Job you prepared earlier.
To open and link the source presentation file:
- Open the source presentation file, which is in the Report Provider folder.
- Launch the Reportworq add-in:
- Select the Reportworq tab, and then select the Reportworq button.

- If the Reportworq Login dialog appears, select Login, provide your Reportworq Administrator User Name and Password, and select Login.
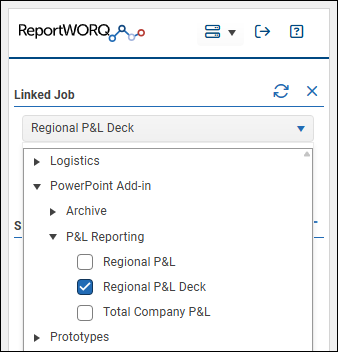
- From the Linked Job list, select the associated Job you want to link to the presentation. Tip: If the Job is not listed, confirm that you are in the same workspace. If you are not, select the
 icon and then select the correct workspace. If the icon is not present, you have access to only the current workspace.
Main View of the Add-in (for administrators)#
This section describes controls available from the main view of the Reportworq add-in. The following figure is an example of the main view. In this example, the current slide has several shapes.
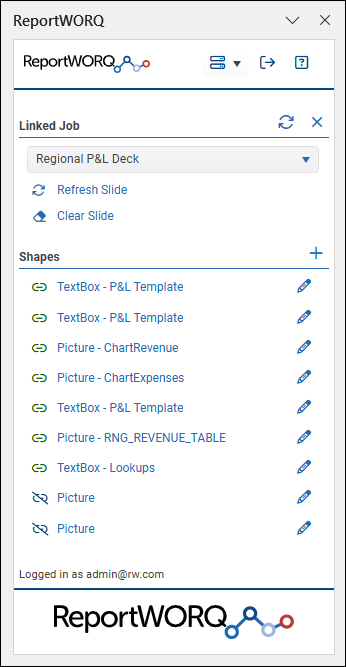
Controls at the top of the main view include the following:
- Select Workspace -- If the icon is present, you can switch to a different Reportworq workspace. Before you can link the source presentation to a Reportworq Job, you must be in the same workspace as the Job. If the icon is not present, you can access the current workspace only.
- Log Out
 -- Logs you out of Reportworq. You must be logged in to use the add-in.
 - Help
 -- Launches Reportworq User Documentation in a web browser.
Controls in the Linked Job area include the following:
- Refresh Job List -- Updates the list of Jobs to show all the Jobs in your current workspace.
- Disconnect -- Disconnects the associated Job from the source presentation.
- Job List -- Shows a list of Reportworq Jobs to which you can link the source presentation. Because the Job contains a reference to the source presentation, after you establish a link you should not select a different Job.
- Refresh Slide -- Refreshes all data-linked shapes on the current slide so they show data from the underlying Excel report(s). Refreshing a slide does not retrieve data from datasources.
- Clear Slide -- Removes data from all data-linked shapes on the current slide. This is useful to identify which shapes are data-linked. Tip: For testing purposes, it is good practice to clear each slide before saving the source presentation. If the Job runs but doesn't generate data for a shape, the generated presentations will show placeholders on that shape instead of data, which may alert you to the problem.
The Shapes area lists shapes on the current slide.
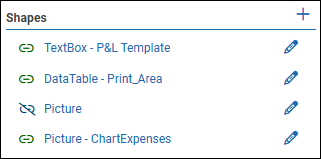
Each entry in the list indicates whether the shape is linked  or not linked
  , lists the shape type, and indicates the source. For example, for the last entry in the preceding figure, the shape is a linked shape , it is imported as a picture, and the source is a chart named ChartExpenses.
To import a new data-linked shape, select the  icon.
icon.
To edit a shape, select the shape on the slide, or select it from the list, or select pencil icon.
Importing Data-Linked Shapes#
You can use the Reportworq add-in to import a data object and specify how to display it as a shape.
To import a new data-linked shape:
- At the top of the Shapes area, select the icon. The Import Linked Shape settings appear.
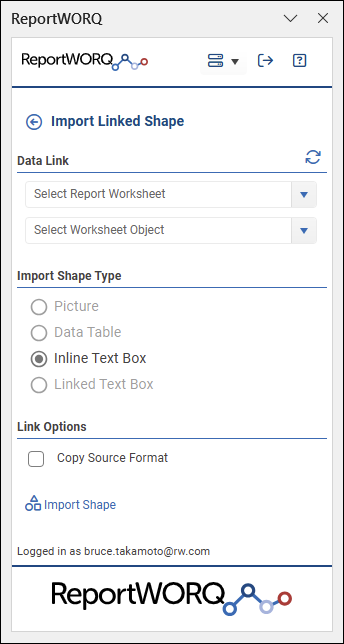
- In the Data Link area, use the dropdown lists to select the data item for the shape you want to add:
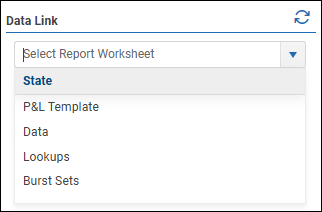
- From the Select Report Worksheet list, select the worksheet that contains the data object. The list shows names of the worksheets from the Excel report(s) underlying the Reportworq Job. If the Job has multiple reports, each report name is shown in blue text, with the report's worksheet names below it. In the example below, the Reportworq Job has one report named State, which contains four worksheets.
- If you are creating an Inline Text Box, proceed to Step 3.
- From the Select Worksheet Object list, select the shape to import. There are four types of data-linked shapes that may appear on the list:
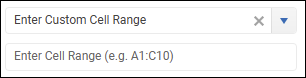
- Custom Cell Range -- Select Enter Custom Cell Range, and then specify the cell or range of cells to import from the selected Worksheet.
- Chart -- Select the chart you want to import.
- Named Range -- Select the Named Range that contains the data you want to import.
- TextBox -- Select the Text Box you want to import from the worksheet.
- Custom Cell Range -- Select Enter Custom Cell Range, and then specify the cell or range of cells to import from the selected Worksheet.
- In the Import Shape Type area, select one of the following to specify how the data is displayed:
- Picture -- Applicable to Custom Cell Ranges, Charts, and Named Ranges.
- Data Table -- Applicable to Custom Cell Ranges and Named Ranges.
- Inline Text Box -- Creates a linked text box that can contain text plus one or more variables pointing to cell addresses and/or named ranges on the worksheet.
- Linked Text Box -- Applicable to Text Boxes imported from the worksheet.
- If the Shape Type is a Data Table, Inline Text Box, or a Text Box and you want the text to appear as it does on the worksheet, select Copy Source Format. Source format affects text color and bolding only.
- Select Import Shape. The new shape appears on the slide. You can move, resize, and format it as required.
- If you created an Inline Text Box, edit and format the text as required.
 Specify what data to import by including one or more variables pointing to cell addresses and/or named ranges, enclosed in curly braces { }. The default text box shown above provides an example. When the Job runs, any variables in the text box are replaced with fresh data from the worksheet. Note: If you refresh or clear the slide, the contents of inline text boxes are unaffected.
Linking an Existing Shape to a Data Object#
You can link an existing shape to a data object in an underlying Excel report. When the Job runs, the data appears on the shape.
As an example, the following procedure describes how to link an existing shape to text box data from an Excel report.
To import text box data onto an existing shape:
- Select the existing unlinked shape, either on the slide or from the Shapes list. In the Reportworq add-in, the Edit Shape Link settings appear.
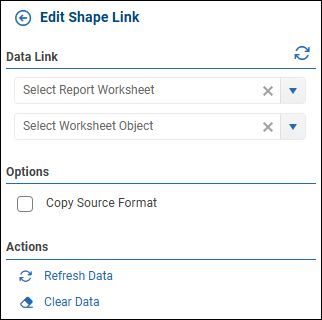
- In the Data Link area, from the Select Report Worksheet list, select the Excel worksheet that contains the text box.
- From the Select Worksheet Object list, select the text box from which you want to import data.
- If you want the imported data to retain the text color and bolding from the report, in the Options area, select Copy Source Format.
- In the Actions area, select Refresh Data. The selected shape is linked to the text box, and data from the text box appears on the shape.
Formatting and Editing Linked Shapes#
You can apply formatting to linked shapes as required. You can also move and copy/paste shapes within the presentation. After you paste a shape, you can edit the data link if required. If you paste a shape into a different presentation, the data link is broken and the shape appears as a picture.
When you select a shape, the Edit Shape Link view displays information and settings related to that shape, as described below.
Options area settings include:
- Fit to Height and Fit to Width -- These settings work together to optimize the appearance of data-linked images, including charts, pictures, and cell ranges that are imported as pictures. When the shape is refreshed,
- If Fit to Width is selected, the width is maintained and the height adjusts as needed to optimize the appearance of the picture. This is the default selection.
- If Fit to Height is selected, the height is maintained and the width adjusts as needed to optimize the appearance of the picture.
- If both options are selected, Reportworq does not adjust image height or width.
- If neither option is selected, settings on the Distribution tab of the Job Editor determine whether Reportworq adjusts image height or width.
- Copy Source Format -- If selected, the color and bolding of text on the selected shape appears as it appears in the underlying report. Otherwise, the formatting is controlled by PowerPoint settings. This option affects text color and bolding only.
Actions area settings include:
- Refresh Data -- Replaces data on the selected shape with data from the underlying Excel report. Refreshing a shape does not retrieve data from datasources.
- Clear Data -- Replaces data on the selected shape with placeholders. This is useful to identify which shapes are data-linked.
- Reset Shape -- The shape reverts to its original height and width.
Controls in the Linked Job area include the following:
- Refresh Job List -- Updates the list of Jobs to show all the Jobs in your current workspace.
- Disconnect -- Disconnects the associated Job from the source presentation.
- Job List -- Shows a list of Reportworq Jobs to which you can link the source presentation. Because the Job contains a reference to the source presentation, after you establish a link you should not select a different Job.
- Refresh Slide -- Refreshes all data-linked shapes on the current slide so they show data from the underlying Excel report(s). Refreshing a slide does not retrieve data from datasources.
- Clear Slide -- Removes data from all data-linked shapes on the current slide. This is useful to identify which shapes are data-linked.
Test Output and Run the Job#
After you prepare the source presentation, test the generated output.
When you are satisfied, you can run the Job manually or schedule the Job to run at designated times.
To test a generated presentation:
- Open the Job in Reportworq.
- On the Test tab, generate a preview and run one of the burst instances.
- When the generated files appear, open the presentation (.pptx file) in PowerPoint.
- From PowerPoint, launch the Reportworq add-in and log in.
- Inspect the presentation slides to ensure that they appear as you expect.
Troubleshooting Tip: In addition to the presentation (.pptx file), the Job also generates a PowerPoint Datasource.xlsx file, which is used to import the objects into the presentation file. If you find trouble with data, formatting, etc., verify that the objects appear correctly in the PowerPoint Datasource.xlsx file.
Working with Linked PowerPoint Presentations#
The Reportworq add-in for PowerPoint enables you to access special features when working with PowerPoint presentations that are linked to Reportworq Distribution Jobs. You can view additional information about the file and, depending on permissions, you can refresh the presentation or run the underlying Reportworq Job to retrieve the latest data.
Information in this section is for licensed end users of the Reportworq add-in for PowerPoint.
Before you can use the add-in for the first time, you must install it. Each time you want to use the add-in, you must launch it in PowerPoint. For more information, see Add-in Setup.
Internet access is required while installing or using the Reportworq add-in. You must be logged in to Reportworq while you use the add-in.
To access the Reportworq add-in:
- Open the PowerPoint presentation (.pptx file). Note: If you opened the presentation directly from an email application, you may be prompted to Enable Editing. This is required to use the add-in. Alternatively, you can download the presentation attached to the email and then open it from File Explorer.

- Launch the add-in by selecting the Reportworq tab, and then select the Reportworq Open button.
 The Reportworq task pane appears.
Using the Reportworq Add-in#
The following figures show the main view of the add-in. The figure on the left shows the view if you have permissions to refresh data and run the Reportworq Job. The figure on the right shows the view if you do not.
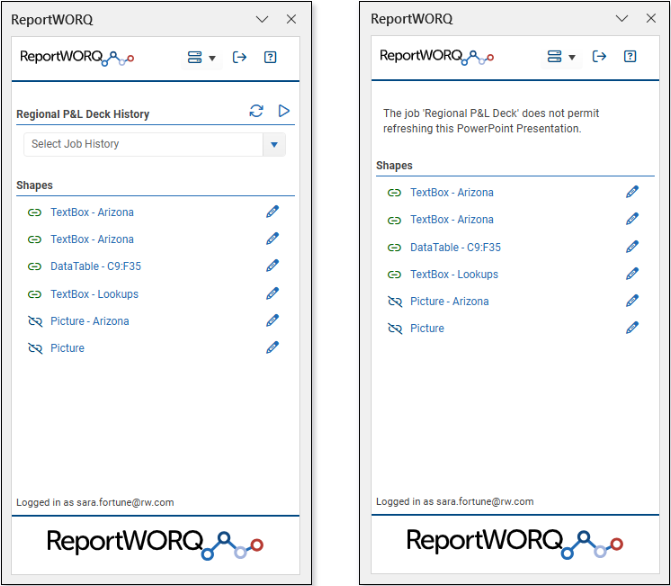
Controls at the top of the main view include the following:
- Select Workspace -- If the icon is present, you can switch to a different Reportworq workspace. If the icon is not present, you can access the current workspace only.
- Log Out -- Logs you out of Reportworq. You must be logged in to use the add-in.
- Help -- Launches Reportworq User Documentation in a web browser.
Running the Job and Refreshing the Presentation#
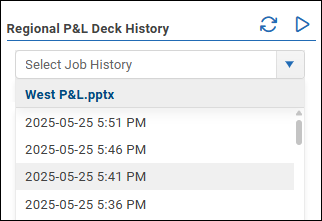
Data in the presentation is linked to output from a Reportworq Job, which is based on one or more Excel reports. Whenever the Job runs, it retrieves fresh data from the underlying datasources(s). The History list includes timestamps representing all available versions of Job output. It enables you to select a different version of Job output to display in the presentation.
The heading above the History list includes the name of the Job. In the figure below, the Job is named Regional P&L Deck. If the History list is not present, refreshing the presentation is not permitted.
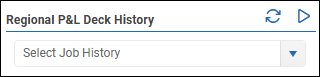
To run the Reportworq Job:
- Select the Run Job icon.
 Note: If the icon is not present, running the Job is not permitted. A confirmation dialog appears.
- Select OK to confirm. Tip: To view the fresh data, you must select the latest Job output and refresh the presentation.
To view a different version of Job output data:
- Select the Refresh History icon to refresh the History list.
- Select a version of Job output from the History list, and then select Refresh Presentation. Data-linked shapes on all slides are updated.
The following controls appear below the History list:
- Refresh Slide -- Refreshes all data-linked shapes on the current slide so they show data from the underlying Excel report(s). Refreshing a slide loads data from a Job's history, not from the underlying datasource in real time. To view the most current data, run the Job to produce a new history record.
- Refresh Presentation -- Refreshes data-linked shapes on all slides so they show data from the version of Job output that is selected in the History list. Refreshing the presentation does not retrieve data from datasources.
- Download <*presentation name*>.pptx -- Saves a copy of the presentation as it was when generated by Reportworq, based on the version of output that is selected in the History list. The file is saved in the Downloads folder on your computer. Any changes you made to the presentation are not included.
Viewing Information About Data-Linked Shapes#
The Shapes area lists shapes on the current slide.
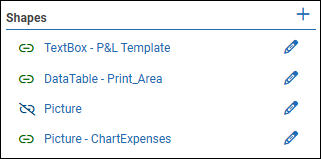
Each entry in the list indicates whether the shape is linked or not linked , lists the shape type, and indicates the source. For example, for the last entry in the preceding figure, the shape is a linked shape , it is imported as a picture, and the source is a chart named ChartExpenses.
To view information about a shape:
- Select the shape, or select the pencil icon. The Data Link area shows information about the shape.
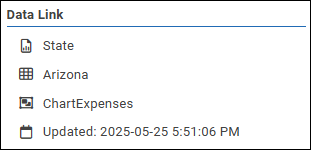 In the example above, the name of the underlying Excel report is State, the worksheet name is Arizona, and the data object name for the shape is ChartExpenses. A timestamp from when the data was last updated is also shown.
To return to the main view, select the back icon. 
Formatting Linked Shapes#
You can apply formatting to linked shapes as required. You can also move and copy/paste shapes within the presentation. If you paste a shape into a different presentation, the data link is broken and the shape appears as a picture that cannot be refreshed.
When you select a shape, the Edit Shape Link view appears, and includes settings related to that shape as described below.
Options area settings for a shape may include:
- Fit to Height and Fit to Width -- These settings work together to optimize the appearance of data-linked images, including charts, pictures, and cell ranges that are imported as pictures. When the shape is refreshed,
- if Fit to Width is selected, the width is maintained and the height adjusts as needed to optimize the appearance of the picture.
- if Fit to Height is selected, the height is maintained and the width adjusts as needed to optimize the appearance of the picture.
- if both options are selected, Reportworq does not adjust image height or width.
- If neither option is selected, settings in the underlying report determine whether Reportworq adjusts image height or width.
- Copy Source Format -- If selected, the color and bolding of text on the selected shape appears as it appears in the underlying report. Otherwise, the formatting is controlled by PowerPoint settings. This option affects text color and bolding only.
Actions area settings for a shape may include:
- Refresh Data -- Replaces data on the selected shape so it displays data from the version of Job output that is selected in the History list. Refreshing data does not retrieve new data from datasources.
- Reset Shape -- The shape reverts to its original height and width.
Feedback on this page
Comments, questions, requests, or something missing or unclear? Email us - the page you are on is filled in for you.
Email feedback on this pageOr write to support@reportworq.com directly.