
Reporting models are representations of data components derived from supported datasources such as financial planning systems or other supported databases. The models present the data components as data tables. Each data table is a reporting model.
The modeling interface enables you to create and edit reporting models, including editing data connections, selecting data fields, filtering data, and editing data field properties.
Report authors later create reports based on data connections to the reporting models, using the Reportworq add-in for Excel. An Excel .xlsx file containing one or more reports is called a source report, and can be used as a template for generating output for report Distribution Jobs or input forms for Contribution Campaigns.
The report modeling process consists of two main steps -- creating models and editing models:
- Creating models -- The following articles describe how to create models, which varies based on the datasource type:
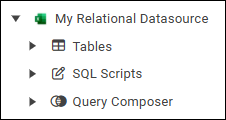
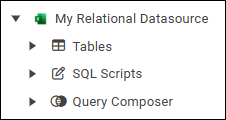
- Creating Models for Relational Datasources -- Applies to most datasources. If your datasource's node in the model tree contains nodes named Tables, SQL Scripts, and Query Composer, as shown in the following figure, it is considered relational for the purposes of report modeling.
- Creating Models for Pigment Datasources
- Creating Models for Relational Datasources -- Applies to most datasources. If your datasource's node in the model tree contains nodes named Tables, SQL Scripts, and Query Composer, as shown in the following figure, it is considered relational for the purposes of report modeling.
- Editing models -- The Editing Models article describes how to use the report modeling interface to edit models and how to build a temporary report.
To access the report modeling interface:
- On the main Reportworq sidebar, select the Reporting Models icon.
 A hierarchical list of reporting models appears. This is called the model tree.
The Model Tree#
The hierarchy of the model tree is as follows:
- Top-level nodes -- correspond to Reportworq datasources available in the current Reportworq workspace.
- Second-level nodes -- represent the types of models available for the datasource. Some model types are imported directly from the datasource. Others can be created using tools available via the second-level nodes. For example:
- The reporting model for a relational datasource includes nodes for importing Tables directly, writing SQL Scripts, and constructing queries using the Query Composer.
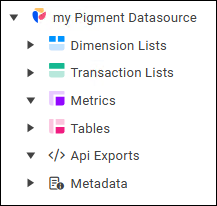
- The reporting model for a Pigment datasource includes nodes for Dimension Lists, Transaction Lists, Metrics, Tables, Api Exports, and Metadata.
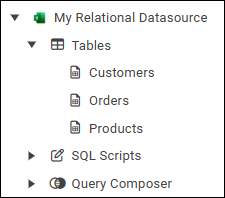
- Third-level nodes -- represent models that have been imported or created. The following example shows models named Customers, Orders, and Products.
- The reporting model for a relational datasource includes nodes for importing Tables directly, writing SQL Scripts, and constructing queries using the Query Composer.
The following example shows an expanded node for a relational datasource.
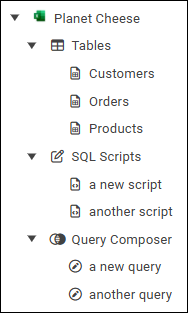
In this example, the Tables node lists all data tables that users have imported from the datasource. Nodes for the SQL Scripts tool and the Query Composer tool list all scripts and queries created by users.
The tables, scripts, and queries are all reporting models. Initially, these nodes are empty because no data components have been imported or created. The specific types of nodes shown vary by datasource type.
As you hover over each node, action icons appear beside the node name:
- For the second-level nodes, the action icons are add
 and refresh
  :
: 
- Add -- Launches the Bulk Import tool or prompts you to provide a name for a new model.
- Refresh -- Refreshes the list of models within the node.
- For the third-level nodes, the action icons are Open
 and the ellipsis
  :
: 
- Open -- Launches the model editing interface.
- Ellipsis -- Opens the options menu for the model:
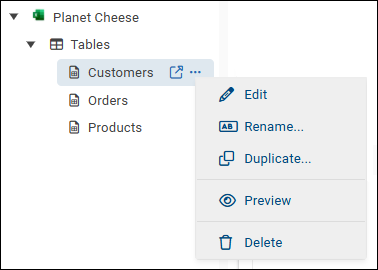
- Edit -- Launches the model editing interface.
- Rename -- Enables you to change the name of the model. Be sure to specify a name that will be meaningful to report authors.
- Duplicate -- Creates a copy of the model, with a name you specify. Any edits that were made to the model are applied to the duplicate model.
- Preview -- Opens a preview of the model in the modeling editing interface.
- Delete -- Enables you to delete the model. When asked to confirm the deletion, select OK.
Tip: You can also access this menu by right-clicking the model name.
Feedback on this page
Comments, questions, requests, or something missing or unclear? Email us - the page you are on is filled in for you.
Email feedback on this pageOr write to support@reportworq.com directly.