
Lab 3: Find your way around Reportworq#
What you are doing. Learning the screen. You have a running, licensed Reportworq carrying the Timberline Harvest Co. demo content, and you are about to spend six labs building things in it. This lab walks the three regions of the application, the left rail, the top bar and the workspace itself, and names every control you are going to be told to click.
What this shows you. That the Reportworq shell is smaller than it looks. There are only three regions, each one answers a different question, and once you can place a control in the right region you can find it without being told where it is.
How long. About 20 minutes, all of it clicking around. Nothing in this lab changes anything.
What you need. The instance from Lab 2: running, licensed, signed in as admin@rw.com, with the Examples and Timberline folders in the workspace.
Before you start#
The Timberline and Examples folders you can see are already fully built out. Every report, campaign and schedule this course produces is sitting in there, finished.
That is deliberate, and it is worth being clear about what the rest of this course does with them. The Timberline Demo System guide gives you the overview: what the company is, what is in the store, what each report does. This course does the opposite: from Lab 4 onward you build those same reports yourself, step by step, one at a time. The finished versions stay where they are, as the answer key. When your Financial Statements job does not look like Timberline's, you can open Timberline's and see what you missed.
So this lab is the one that pays for the rest. Everything after it is "go to this screen and set that control," and it will only read that way if the screen is already familiar.
Nothing here modifies the store. Click freely.
Part A: The left rail#
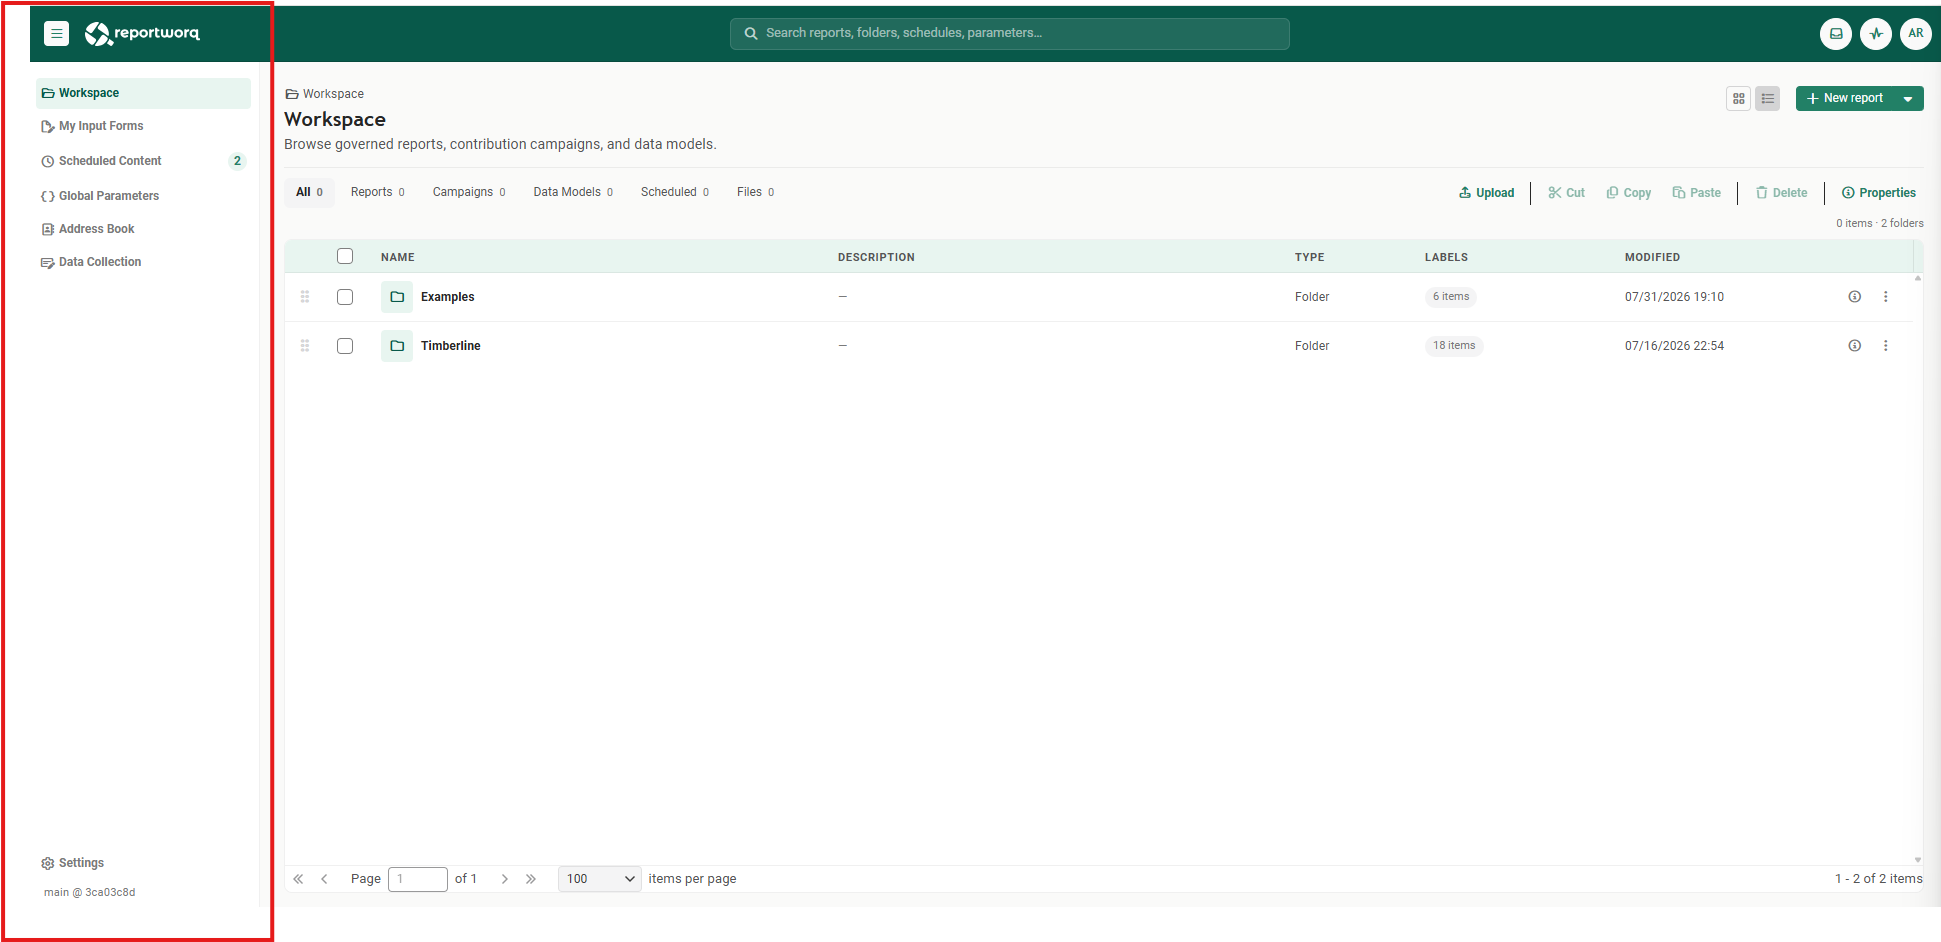
The left rail answers "which part of the product am I in?" It is the same on every screen.
1. Collapse it#
At the very top of the rail, beside the Reportworq logo, is a button that collapses the rail to an icon strip. Select it.
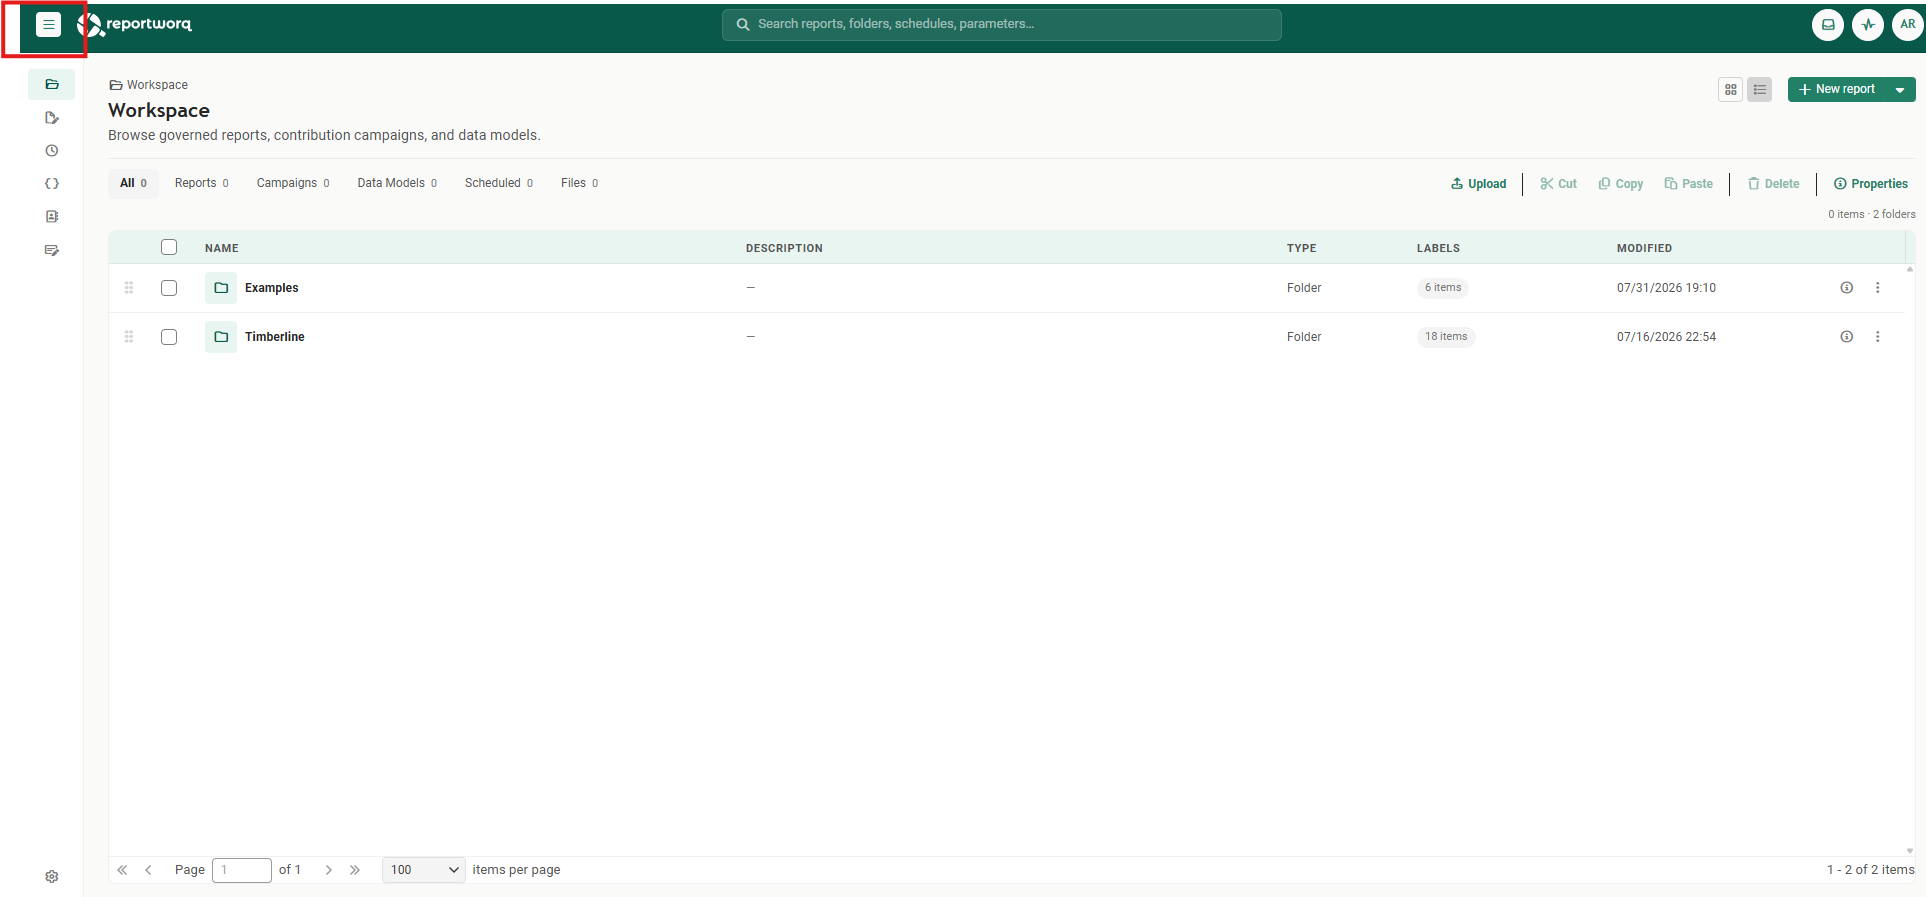
The rail keeps its icons, so you can still navigate, and the content pane gets the width back. It is a toggle, so select it again to bring the labels back. On a job editor with a wide parameter grid this is the difference between scrolling sideways and not, so it is worth remembering it is there.
Expand it again before you carry on, so the labels match the rest of this lab.
2. Walk the six entries#
Select each of these in turn.
Workspace is where you are now, and where you will spend most of this course: the folders, reports, campaigns and data models you build and run.
The word does double duty, so it is worth separating the two meanings now. The rail entry is a screen, the browser you are looking at. A workspace is also the content space that screen is showing you: one folder tree, the items in it, and the security that governs them. A Reportworq server can host more than one, and an account can belong to several.
What a workspace is for. It is an isolation boundary, not a filing system. Two workspaces cannot see each other's content at all, which makes them the right tool when a server has to hold genuinely separate content spaces: one per company, per department, or per tenant. It is the wrong tool for merely tidying up, because folders already do that, and folder-level security is enough to keep one team out of another team's reports inside a single workspace.
Most instances need exactly one, including the one you are building. One workspace is simpler to run than several, so add a second only when something really must be walled off.
When you do split, some things follow the workspace and some do not:
| Set once for the whole server | Belongs to the workspace |
|---|---|
| Accounts, groups and entitlements | Folders, reports and campaigns |
| The authentication provider | Schedules |
| Data sources, report providers, distributors and shared credentials, each declaring which workspaces may use it | Address book contacts and global parameters |
So a person does not get a second identity per workspace, and an administrator does not reconfigure a distributor per workspace. The reporting content itself, though, belongs to the workspace it was built in.
My Input Forms is the contributor's inbox. If a contribution campaign is running and a form has been assigned to you to fill in or approve, it appears here with a count beside the rail entry telling you how many are waiting on you.
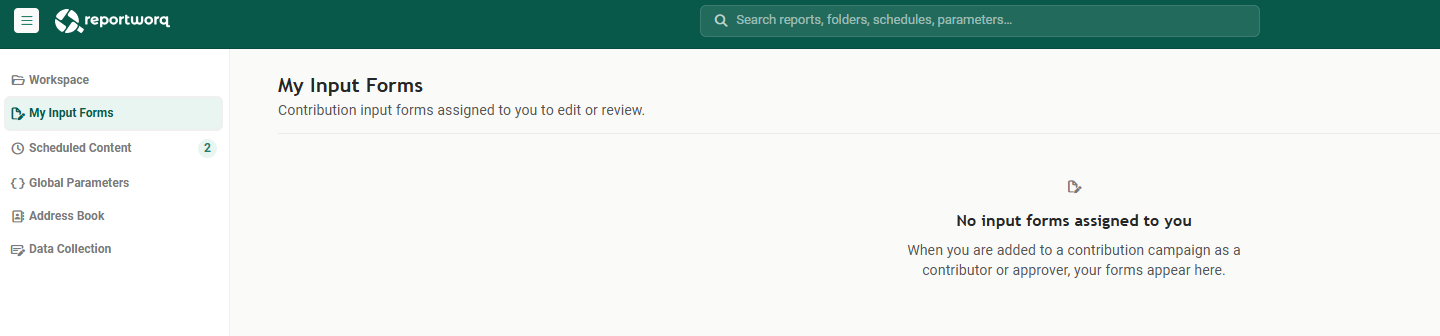
Yours is empty, because no campaign has assigned you anything yet. The Timberline store does carry a running campaign, Segment & Channel Budget Input, but its forms are assigned to Timberline's contributors, not to the demo administrator.
Scheduled Content is every schedule in the environment on one screen, rather than buried in the report that owns it.
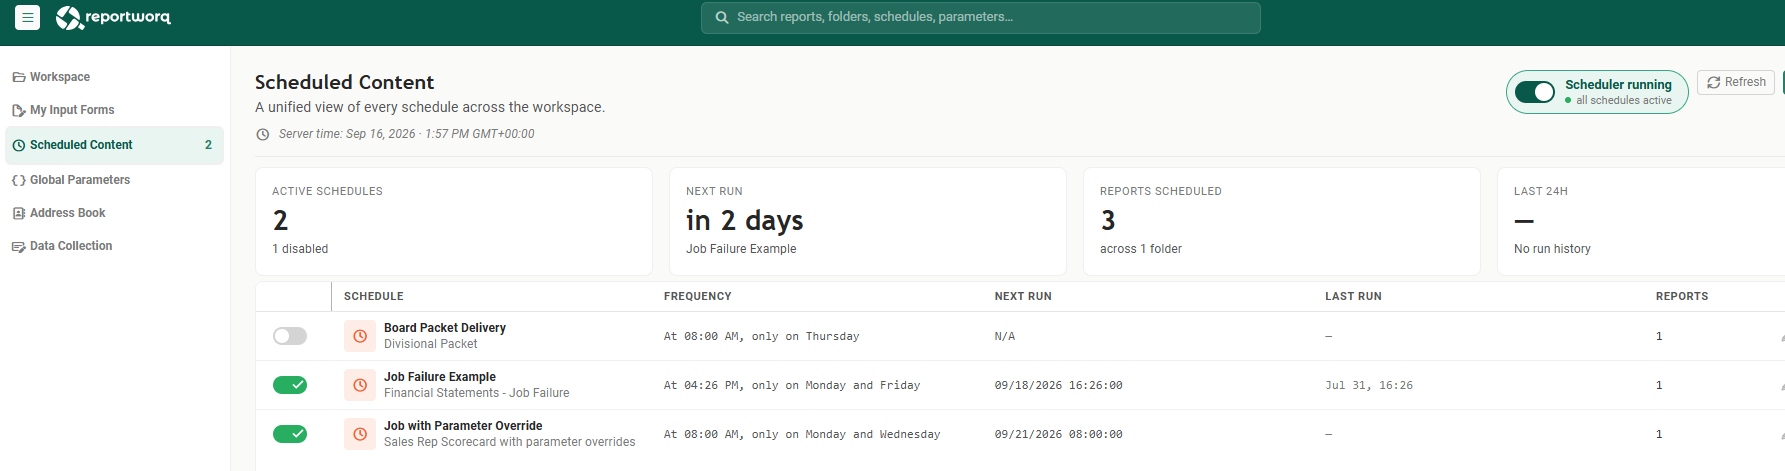
Read the numbers carefully, because they do not all count the same thing. The badge on the rail entry, and the Active Schedules card, count schedules that are switched on. The demo has three schedules but one of them is toggled off, which is why both read 2 with "1 disabled" underneath. Reports Scheduled counts the reports those schedules drive, which is a third number again.
The Scheduler running toggle at the top right is the master switch for the whole instance. Turn it off and every schedule stops, whatever its own toggle says. Lab 11 uses this screen properly.
Global Parameters are parameter values defined once and reused across jobs.
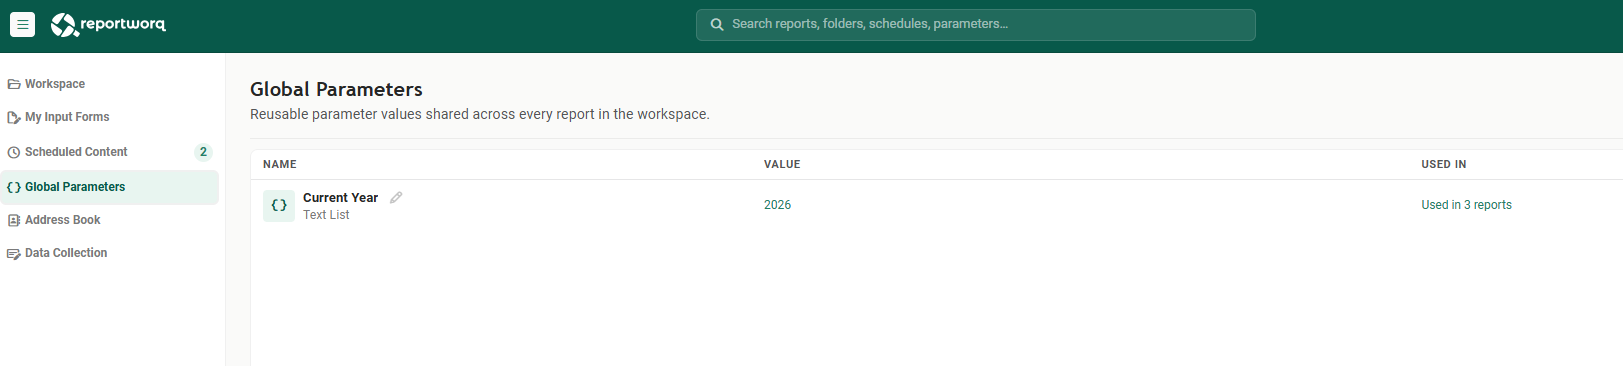
Timberline has one, Current Year, set to 2026. The column that makes this screen worth knowing about is Used in. It tells you, before you change anything, exactly which reports the change will land on. Editing Current Year here rolls the year forward in all three reports at once, and nobody has to remember which three.
Address Book holds the people you distribute to, and what you know about each of them.
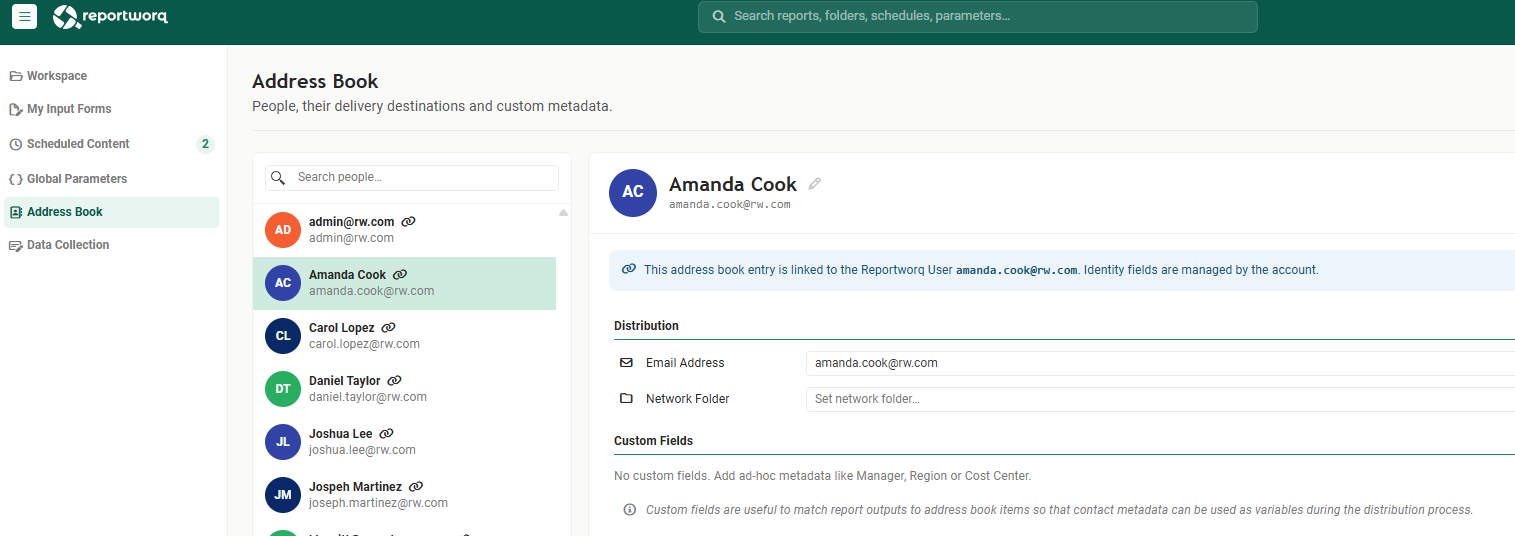
Each entry carries Distribution destinations (an email address, a network folder, and more rows as you enable more distributors) plus Custom Fields, which are the interesting part. A custom field such as Manager, Region or Cost Center can be matched against a report's output, so that bursting knows which person gets which slice, and the field's value can be used as a variable in the message itself. Labs 8 and 9 use this.
Note the banner on Amanda's entry: an address book entry can be linked to a Reportworq user account, in which case the identity fields come from the account and are not editable here.
Data Collection is the writeback queue: workbooks on their way back into your source systems, outside the input-forms path.
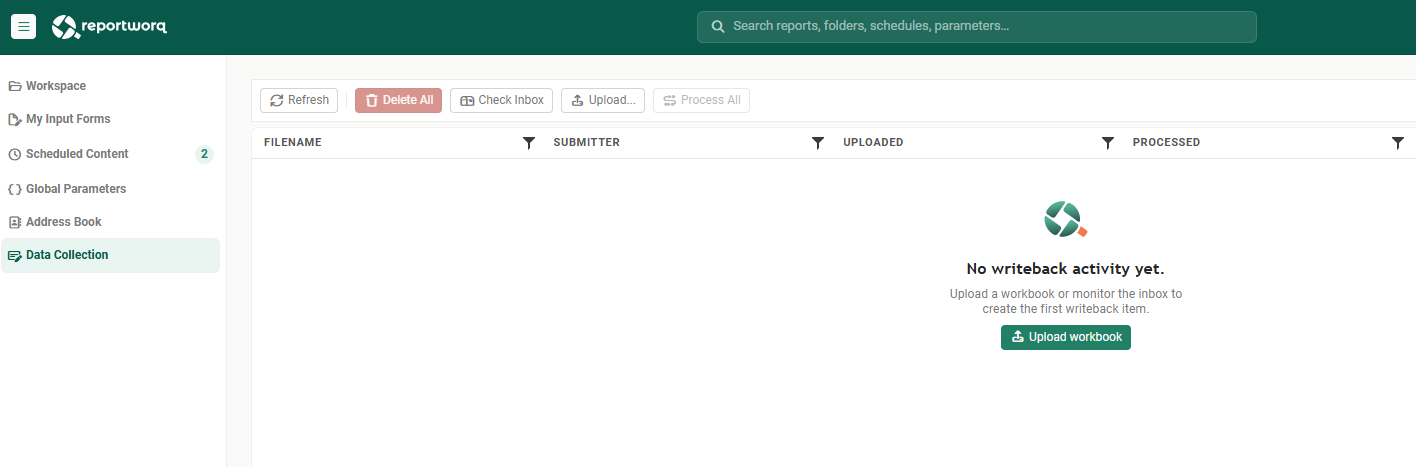
My Input Forms and Data Collection are both Contribution features, and both can be absent rather than empty. Data Collection is hidden unless the instance's license carries the Contribution entitlement, and My Input Forms is hidden unless your own account is a contribution participant. They are the two rail entries this course does not build on, because Labs 4 to 11 are all Distribution, so if you cannot see them, nothing in this course is affected.
3. Settings, and the line underneath it#
Settings sits at the bottom of the rail, apart from the other six, because it is not a place you work. It is where the instance is configured and audited.
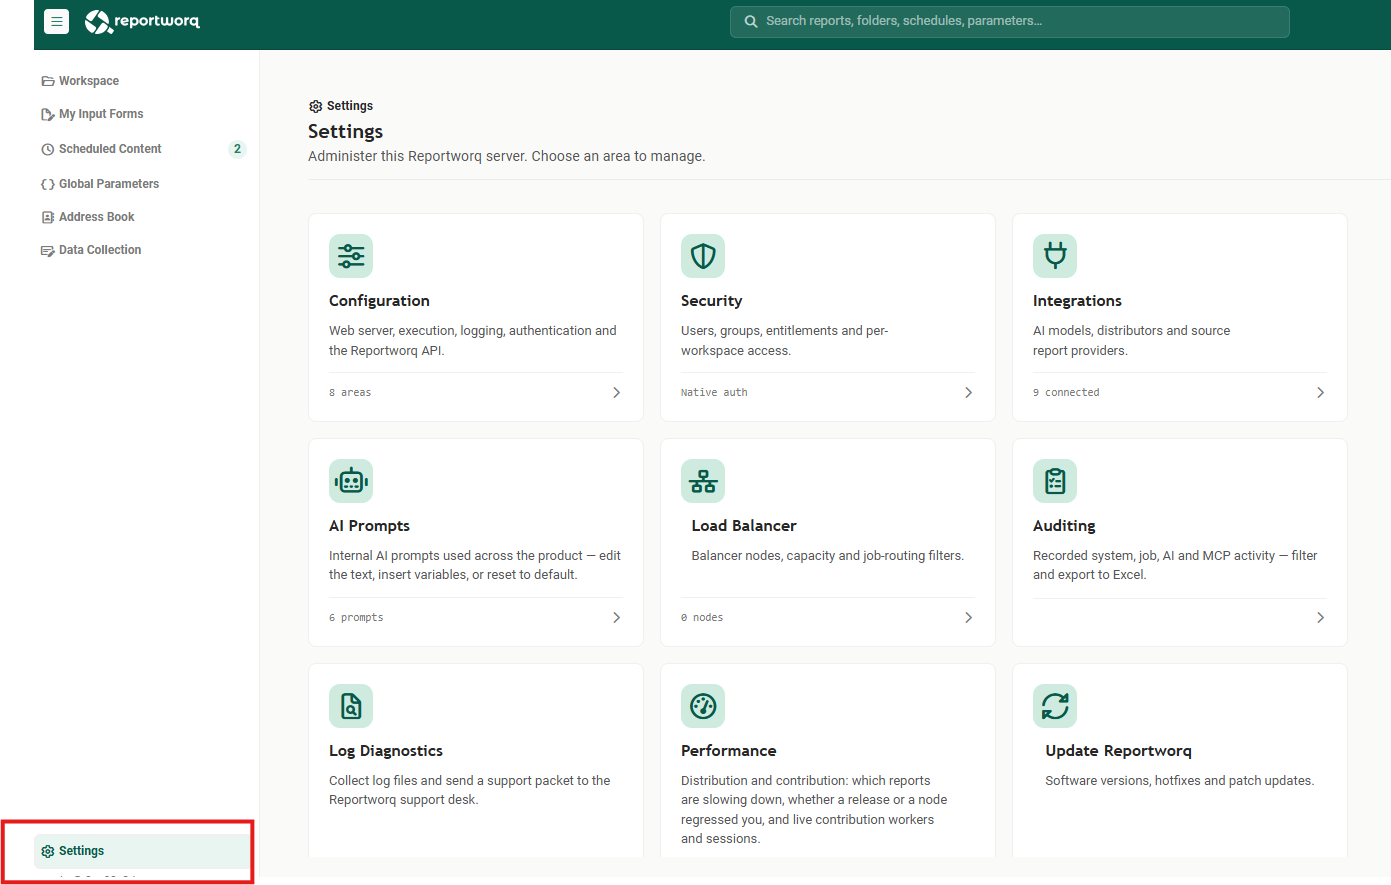
Nine cards, and you have already used one: Configuration is where Lab 2 applied the license. The rest are worth recognizing even though a later lab covers them properly:
| Card | What lives there |
|---|---|
| Configuration | Web server, execution, logging, authentication, the API |
| Security | Users, groups, entitlements, per-workspace access |
| Integrations | AI models, distributors, and source report providers |
| AI Prompts | The product's own AI prompt text, editable |
| Load Balancer | Extra execution nodes and how jobs route to them |
| Auditing | Recorded system, job, AI and MCP activity, filterable and exportable |
| Log Diagnostics | Collect logs into a support packet |
| Performance | Which reports are slowing down, and whether a release regressed you |
| Update Reportworq | Versions, hotfixes and patches |
Directly below Settings is the build this instance is running. On a normal install that is a version number, and it is the first thing support will ask you for.
Part B: The top bar#
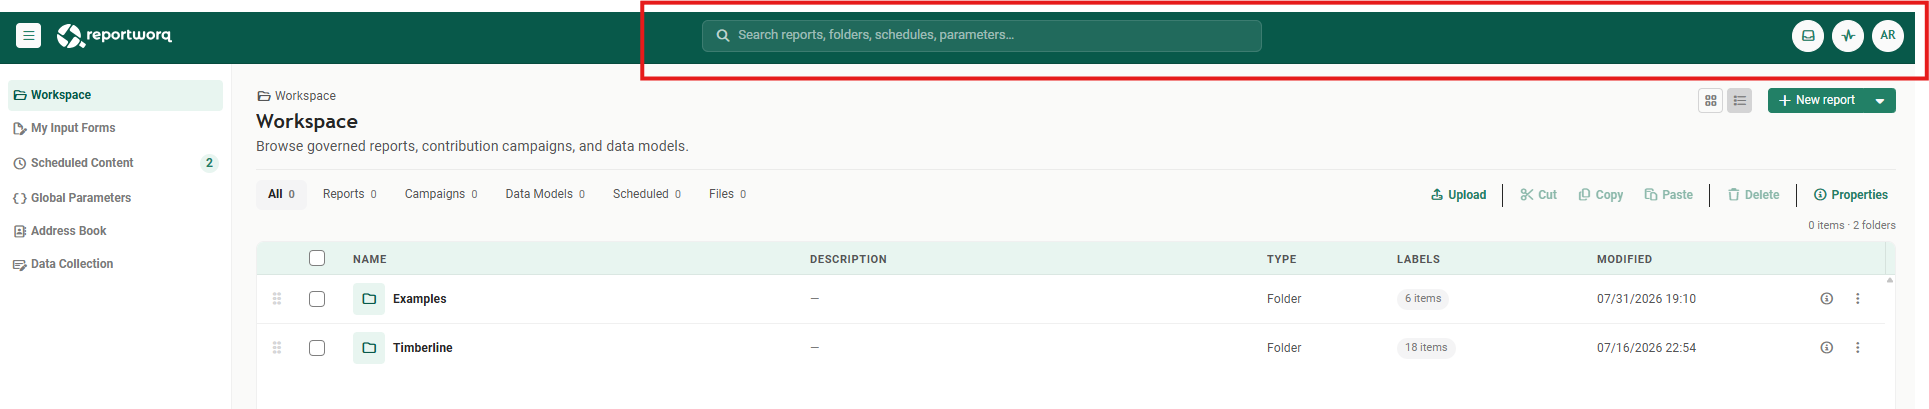
The top bar answers "what is happening, and who am I?" Like the rail, it is on every screen.
4. Search#
The box in the middle searches the whole environment (reports, folders, schedules and parameters), not just the folder you are looking at. In a workspace with real depth it is the fastest way to reach something whose folder you have forgotten.
5. The three buttons, right to left#
The envelope opens the Email Inbox.
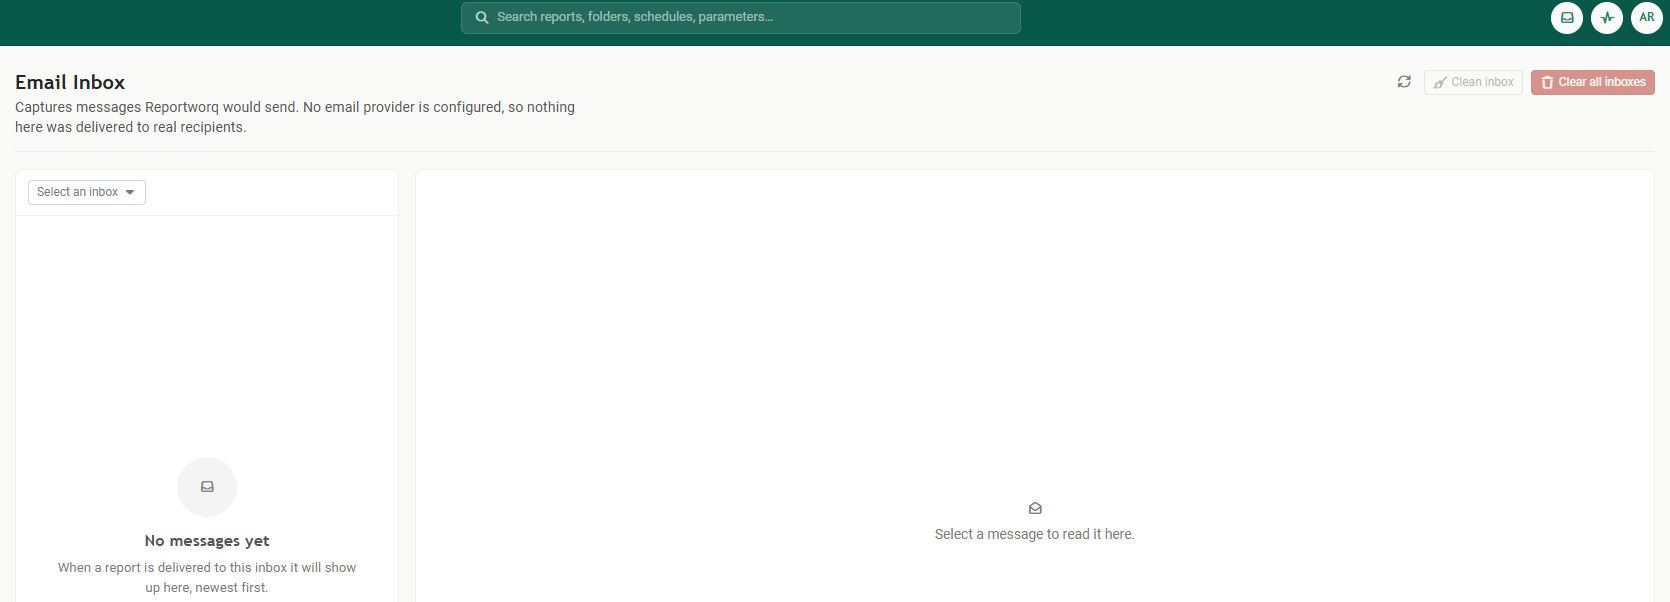
This is the single most useful screen in the product while you are learning it. Reportworq captures the messages it would send, so you can build a distribution job, run it, and read exactly what came out (subject, body, attachments, recipients) without configuring an email server and without mailing anyone. Read the subtitle: with no email provider configured, nothing here reached a real inbox.
Labs 7 to 10 all end here. When a burst is supposed to produce one email per division, this is where you prove it produced one email per division.
The pulse icon opens Activity: running jobs, held deliveries, and the run history.

On a fresh instance there is nothing to see. Once anything has run, the same screen carries the history, with filters.
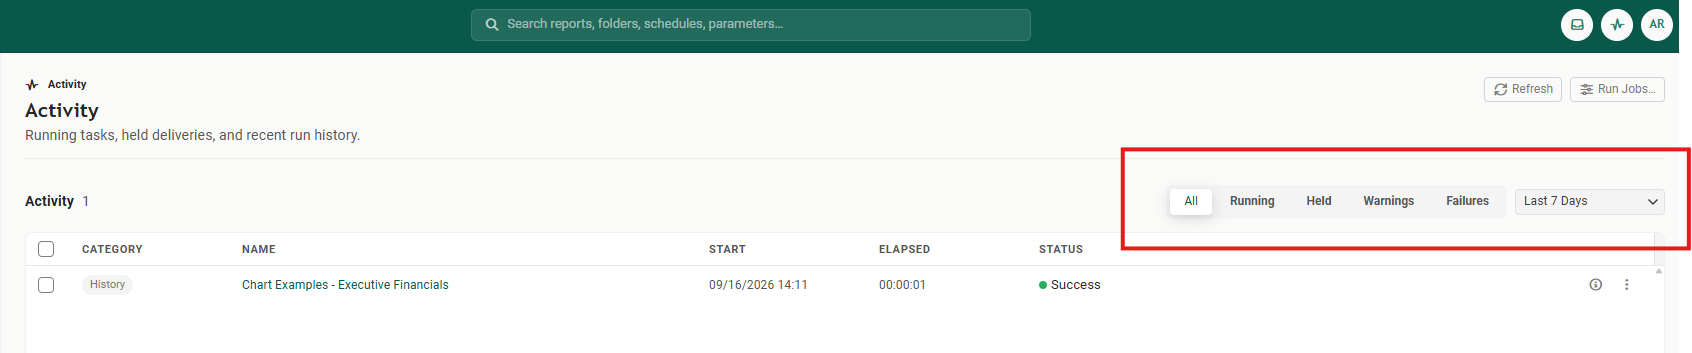
The filters outlined above, All / Running / Held / Warnings / Failures and a date range, are how you find one bad run among hundreds. Run Jobs… at the top right kicks a job off from here, without going back to the workspace to find it. Lab 11 lives on this screen.
The circle with your initials is the account menu.
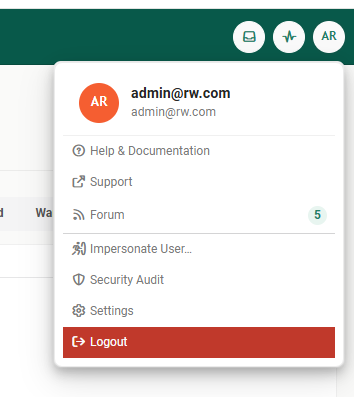
It confirms who you are signed in as, which matters more than it sounds, because of the entry three rows down. It carries the customer links (Help & Documentation, Support, Forum), a second route to Settings, and Logout.
This is also where you would find your workspaces. If your account can reach more than one, this menu grows a Switch Workspace group listing every workspace you can enter, each with a house icon, and the one you are already in picked out in orange and not selectable, so you can see at a glance where you are. That group is the only way to change workspace; there is no switcher anywhere else in the shell.
Your menu does not have it, and that is correct rather than broken. The group is hidden unless the account can reach more than one workspace, and this instance has exactly one. You are signed in as a System Administrator, who is granted every workspace automatically, so it would appear the moment a second one existed.
This is what the same menu looks like on an instance that does have several, so you recognize it when you meet one:
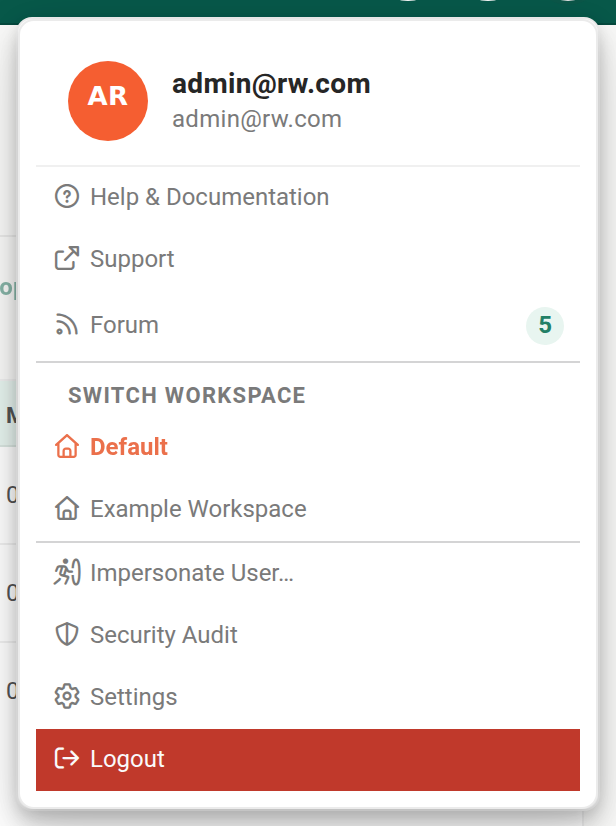
Switching is not a filter, it is a reload. Selecting another workspace raises a Switch Workspace prompt that names the workspace you are heading to and warns that any unsaved changes will be discarded. Select OK and Reportworq reloads the whole application against that workspace. Everything you had open goes with it, which is worth remembering once you meet Open Items at the end of this lab. Save before you switch.
Two entries are administrative. Impersonate User… lets an administrator see the application as another account sees it, which is the only honest way to check that a reader really can reach a report and cannot reach the rest. Security Audit reports who can do what. When you are impersonating, the shell tells you so; sign the impersonation off when you are done.
Part C: The workspace itself#
The workspace answers "what is in here, and what can I do to it?" It has three bands.
6. Top right: how it looks, and what you can add#
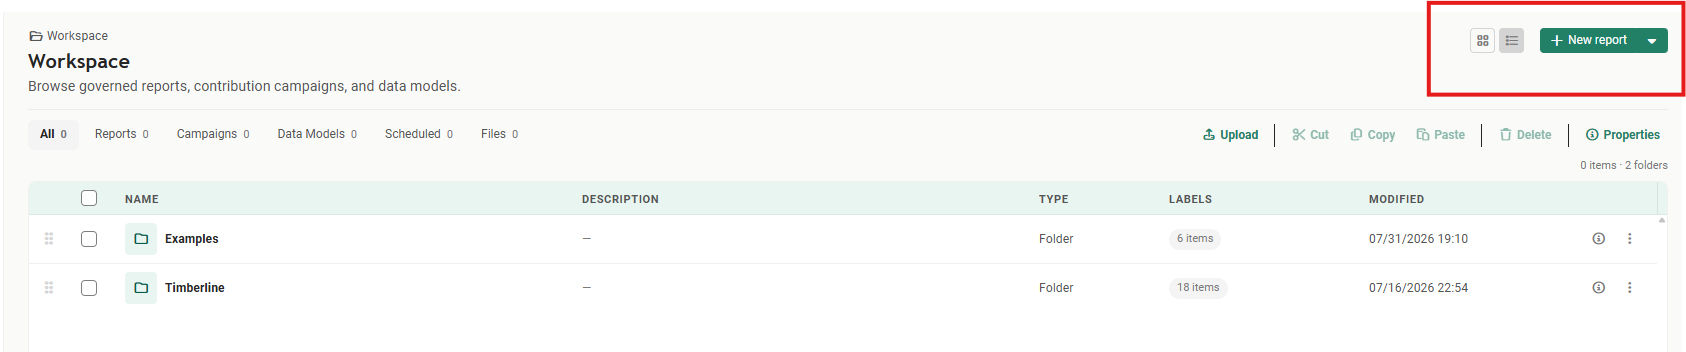
The two small icons switch how the folder is laid out, and their names are worth getting straight now, because the icons argue with them. The one that looks like a grid is Card layout; the one that looks like a list is Grid layout. Hover them and the tooltips say so. This lab and all the ones after it use Grid layout, the table.
The green split-button creates things: selecting the body creates a new report, and selecting the arrow opens the rest.
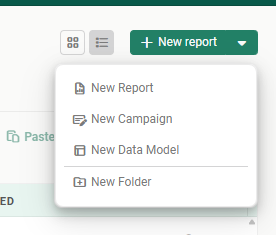
Four item types, and they are the product's whole vocabulary: a Report is a job, a Campaign collects data back from people, a Data Model is a reusable query, and a Folder organizes them. All four appear for any account that is allowed to change content; a reader-only account gets no create button at all.
Switch to Card layout and the folders become cards:
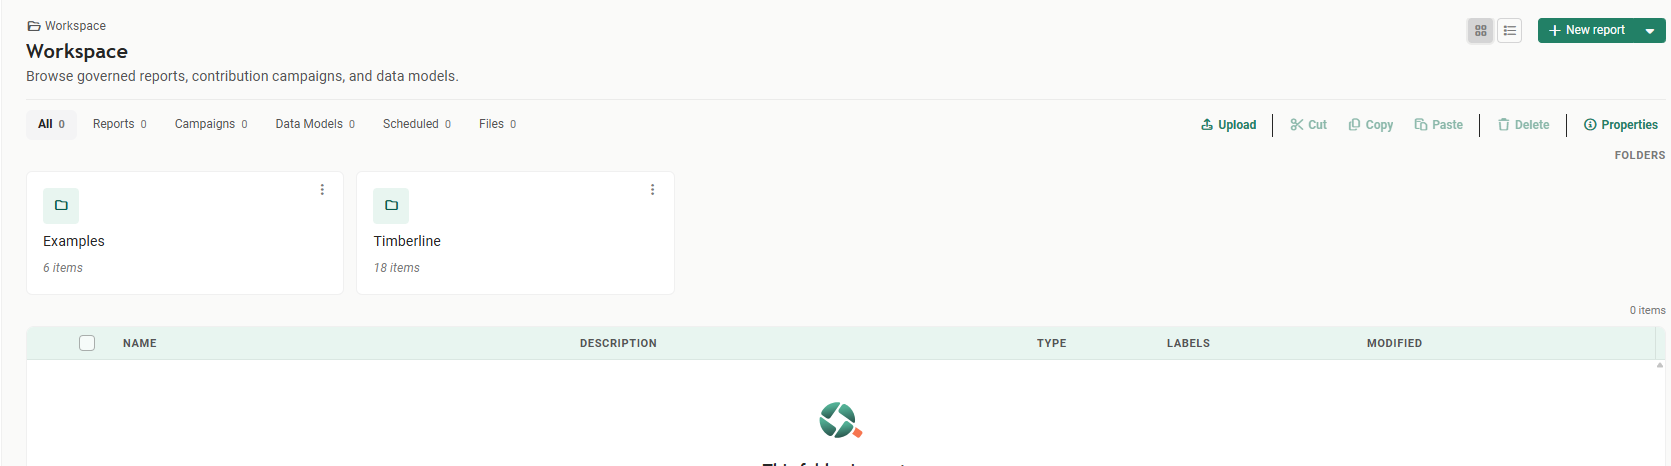
Card layout lifts the folders out into cards at the top and leaves everything else in the table below, so it reads well in a folder that is mostly subfolders and poorly in one that is mostly reports. Switch back to Grid layout for the rest of this course, which is what the later labs' screenshots use.
7. The middle band: filter on the left, act on the right#
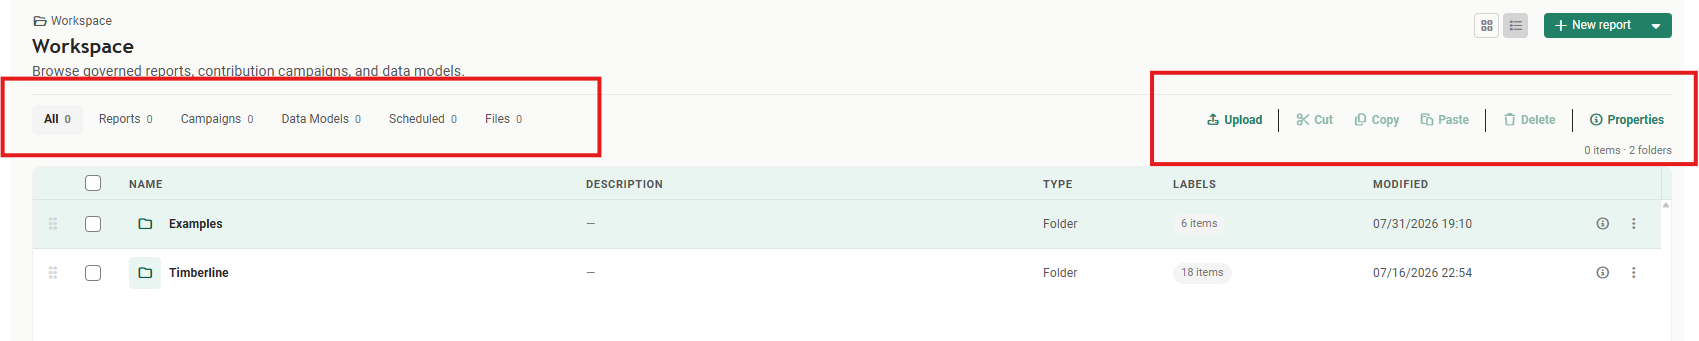
On the left, filter chips with counts: All, Reports, Campaigns, Data Models, Scheduled, Files. In a folder holding a dozen mixed items, Scheduled answering "what in here runs on its own?" is the one you will reach for most.
On the right, the tools: Upload puts source files, the .xlsx and .pptx a report is built from, into the workspace. Cut / Copy / Paste / Delete act on whatever you have ticked. Properties opens the panel for the current folder, which is mostly about who has access to it.
8. The middle: the items themselves#
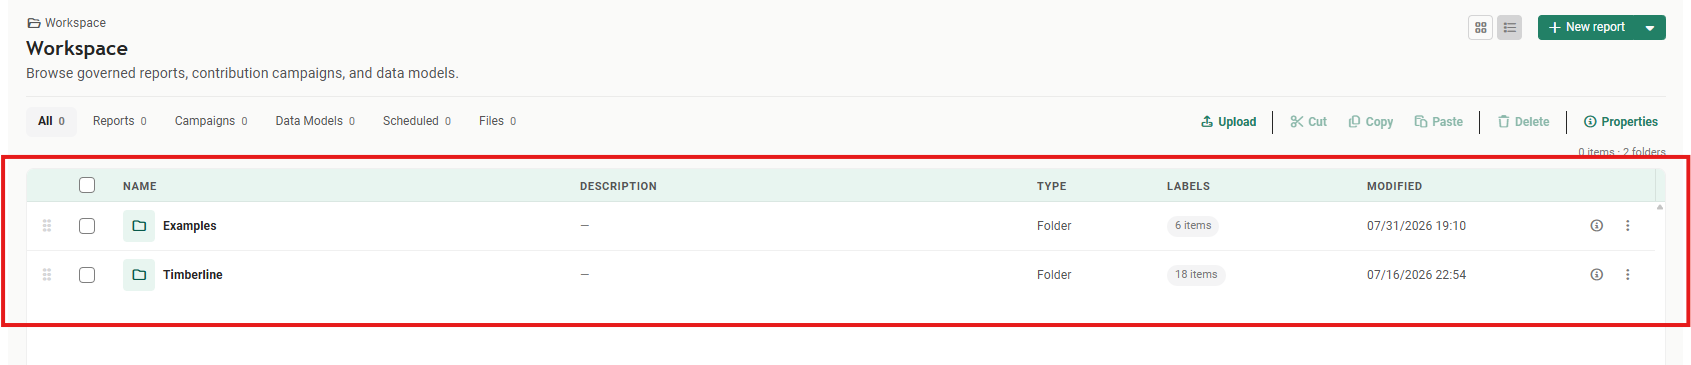
Name, Description, Type (folder, report, campaign, data model), Labels, and Modified. The Labels column earns its place: it is where an item tells you it is scheduled, or which provider a data model reads from, without you having to open it.
At the end of each row are two controls. The ⓘ opens the item's properties: description, security, and how long its run history is kept. The ⋮ opens everything else.
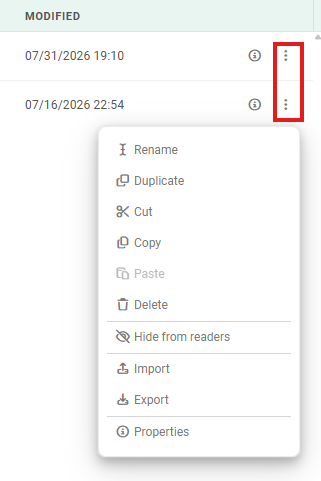
Most of it is what you would expect. Two are not. Hide from readers keeps an item in place and working, and still visible to authors and administrators with a Hidden badge on it, but removes it from the workspace entirely for reader-only accounts. You will see it used in a moment. Export writes an item out so it can be moved between Reportworq instances, which is how a report you build in a test environment reaches production; Import brings one in.
This menu is shorter or longer depending on what you opened it on. The screenshot above is a folder's, so it carries Paste and Import, which only folders can do. A campaign's menu adds Archive Campaign Data and Send to Support. Do not be surprised when the menu on a report has fewer entries than this one.
9. Drill in, and watch the screen change#
Open Timberline, then Financial Reports.
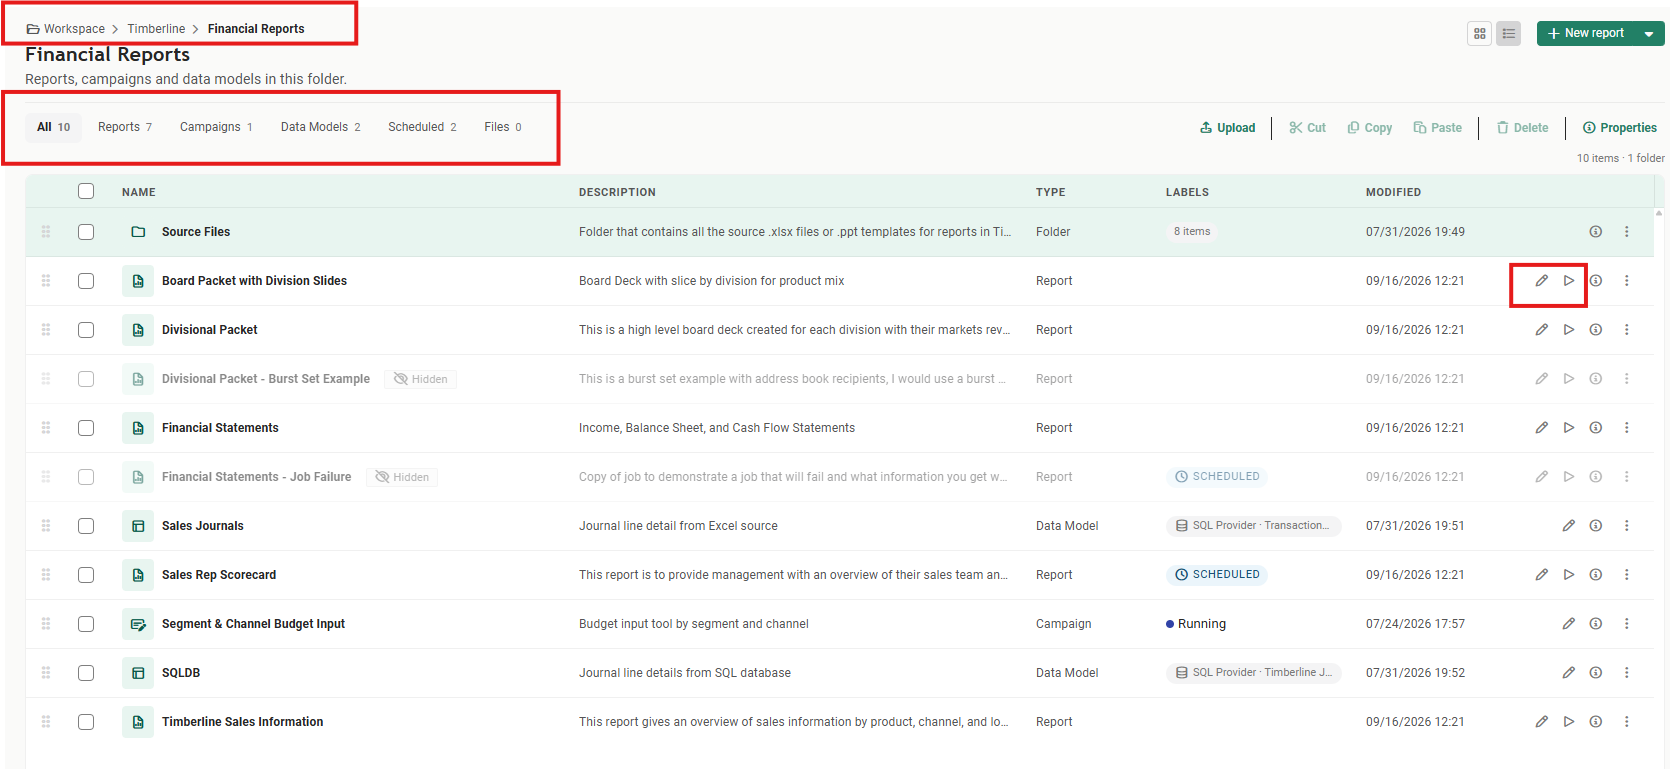
Four things changed, and all four are the screen telling you where you are:
- The breadcrumb now reads Workspace ▸ Timberline ▸ Financial Reports. Each segment is a link, so it is your way back up.
- The filter chips carry real counts: 10 items, 7 reports, 1 campaign, 2 data models, 2 scheduled. That is the shape of the folder at a glance.
- Two new icons appear on each row: a pencil to edit the job and a play to run it. They were absent on folders because there is nothing to edit or run.
- Two rows are grayed out and carry a Hidden chip: Divisional Packet - Burst Set Example, and Financial Statements - Job Failure. That is Hide from readers in use. They still exist and still run; readers just do not see them.
This folder is the course, and it is worth knowing now which item belongs to which lab:
| Item | Lab |
|---|---|
| Financial Statements | Lab 4, then a worksheet per year in Lab 5 |
| Board Packet with Division Slides | Lab 7, then its email body again in Lab 9 |
| Divisional Packet | Lab 8 |
| Timberline Sales Information | Lab 10 |
| Sales Rep Scorecard | Not built by this course, here as a further example |
| Segment & Channel Budget Input | Not built by this course; it is the contribution campaign |
Lab 6 is about parameters rather than a new job: your first burst sets, and one used only in the email. Lab 11 puts what you have built on a schedule rather than adding another job. Source Files holds the workbooks and templates they are all built from, and About this lab describes each remaining lab in full.
10. Open Items#
Select the pencil on Board Packet with Division Slides.
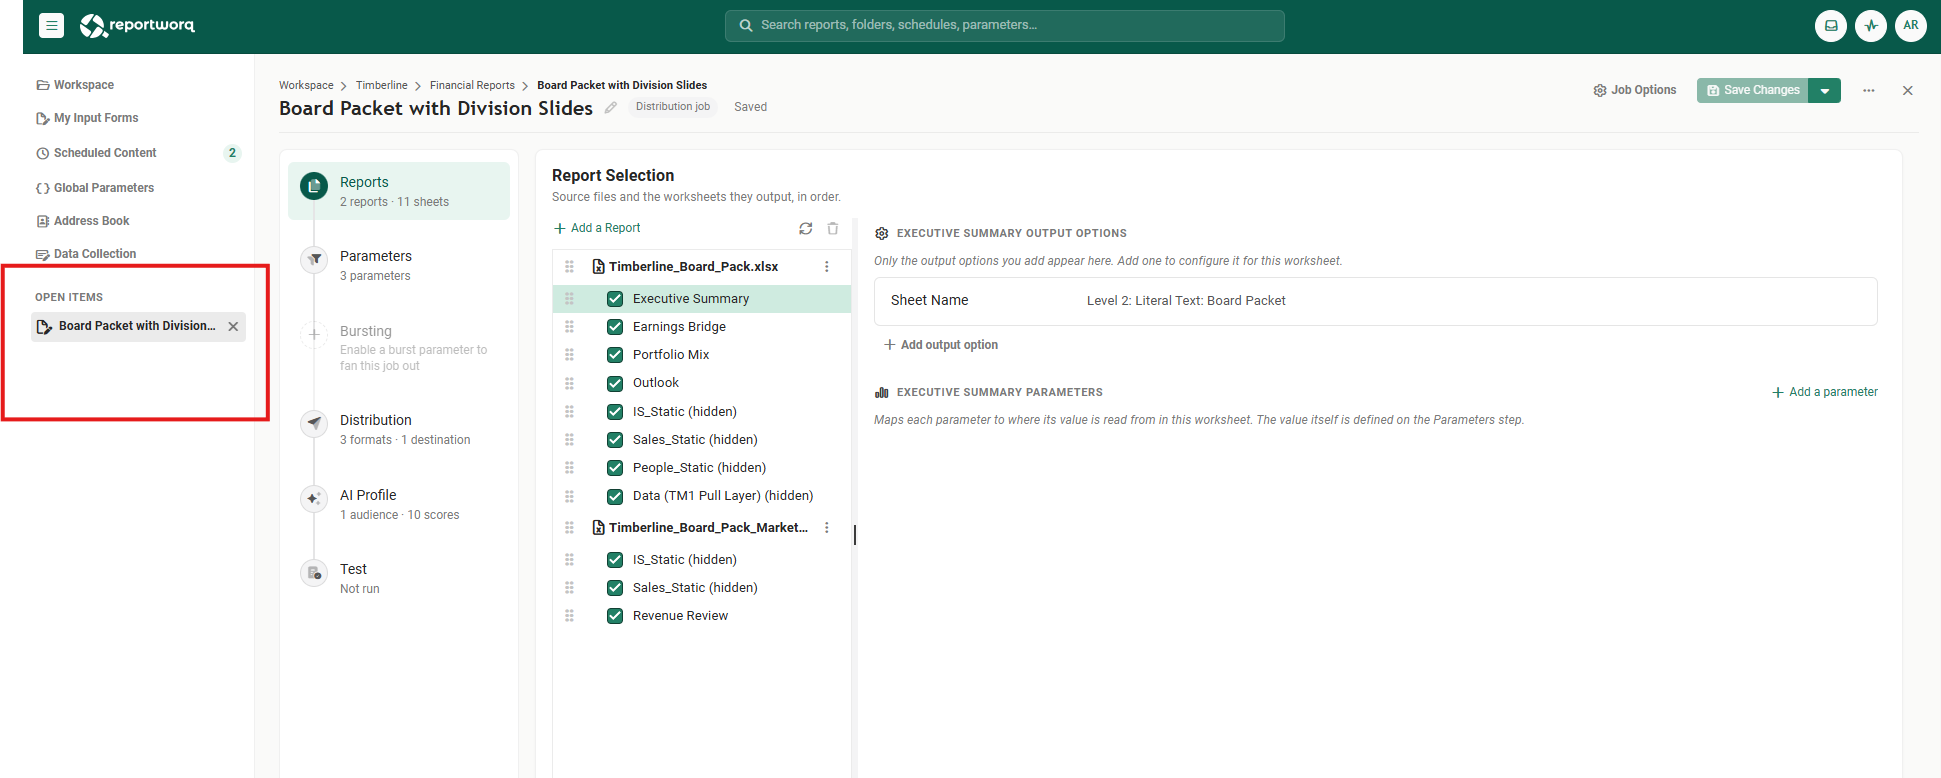
A new Open Items section has appeared in the left rail, holding the job you just opened. Everything you open is listed there, so moving between two reports is one click and does not cost you your place in either.
While you are here, note the editor's own left column, Reports, Parameters, Bursting, Distribution, AI Profile, Test, with a summary under each. That is the spine of every job in Reportworq, and Labs 4 to 10 walk down it one step at a time.
Now go back up. Select Financial Reports in the breadcrumb.

Select the pencil on Divisional Packet, and look at the rail again.
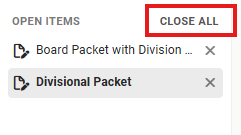
Both jobs are open, and a Close All button has appeared beside the heading, which only shows up once there is more than one thing to close.
Why it works this way#
The three regions are three different questions, and the product is consistent about which answers which:
- The rail is "where am I?" It changes the screen. It never acts on anything.
- The top bar is "what is going on?" Search, output, run history, identity: all of it about the instance as a whole, none of it about the item in front of you.
- The content pane is "what is in here?" Everything that acts on an item is in it: the toolbar, the row icons, the overflow menu.
That is why Settings is at the bottom of the rail rather than in the top bar, and why Activity is in the top bar rather than the rail. Once you have the split, a control you have not met yet is usually findable by asking which of the three questions it answers.
The Open Items host follows from the same idea. Editing a job is not navigation, so opening a second job does not replace the first; the rail grows a list instead. That is worth knowing from Lab 4 on, where you will want the finished Timberline job and your own version open side by side.
Try this#
Four, and each one proves something a later lab depends on.
- Prove the search reaches inside folders. Collapse back to the workspace root, type
Scorecardinto the search box, and watch it find Sales Rep Scorecard two folders down without you browsing to it. - Find out what Current Year is used by. Go to Global Parameters and select Used in 3 reports beside
Current Year. Those are the three reports a single edit would change. Do not change it. - Find where workspaces live. Go to Settings ▸ Security and select the Workspaces tab. You will see a single row, with the number of groups and accounts assigned to it. That one row is the whole content space you have been browsing. Do not add another; just note where the screen is.
- Look at a report's properties without opening it. Back in Financial Reports, select the ⓘ at the end of the Financial Statements row. The panel tells you where it sits, who can reach it, and how long its run history is kept, all without loading the editor.
Notes and limits#
- The rail is shorter for some people. It shows what your entitlements and access allow. A reader-only account gets a read-only workspace with no authoring toolbars, no Activity and no Settings; a contribution-only account gets little more than My Input Forms. If a colleague says a rail entry is missing, this is usually why, and Impersonate User… is how you confirm it.
- A single-workspace instance shows no workspace switcher, by design rather than omission. Workspaces are created, renamed, deleted and granted in Settings ▸ Security on the Workspaces tab, and all of that is Administrator-only: membership is the only access level, and there is no per-workspace administrator role.
- My Input Forms and Data Collection are hidden, not empty, when they do not apply. My Input Forms goes when your account is not a contribution participant. Data Collection goes when the license does not carry the Contribution entitlement, and it is an on-premises feature besides, so it is absent on a hosted instance regardless of license. A rail with four entries instead of six is usually one of these answers, not a fault.
- The Email Inbox captures rather than sends, and only while no email provider is configured. Once a real provider is set up, messages go to real people. Do not treat it as a permanent safety net. Check which of the two you are on before you run a job with a live address book attached.
- The build line under Settings is not always a version number. On a lab or pre-release build it shows the branch and commit it was built from instead. On the install you support, it will be a version.
- Nothing in this lab wrote to the store, so there is nothing to undo. From Lab 4 on, that stops being true.
Going deeper. For the workspace, items and properties in full, see the User Guide. For what each Settings card covers, see the Administrator Guide. For creating workspaces, granting access and the rules on what is shared between them, see Workspaces. For the finished reports in the folder you just opened, see the Timberline report catalog.
Next#
Lab 4: Your first report. You know the screen. Now you build the first job on it: the Financial Statements pack, with one workbook, one parameter, and one output per market.
Feedback on this page
Comments, questions, requests, or something missing or unclear? Email us - the page you are on is filled in for you.
Email feedback on this pageOr write to support@reportworq.com directly.