What you are doing. Building your first report. Finance wants the Financial Statements (income statement, balance sheet and cash flow) sent to every market as its own pack, in Excel and PDF, by email, with the market's name on the file, the subject line and the message. You are going to build that from the workbook Timberline already uses.
What this shows you. The shape every Reportworq report shares: a source file, the parameters that change it, and the distribution that sends it. Everything in the later labs is a variation on the steps you walk here, so this lab takes each one slowly and says what the controls you skip are for.
How long. About 45 minutes.
What you need. The instance from Lab 3: running, licensed, signed in as admin@rw.com, with the Timberline demo content in the workspace. Excel, or anything else that opens an .xlsx, to look at the source workbook.
The finished version of this report already exists: Timberline ▸ Financial Reports ▸ Financial Statements. Leave it alone. You are going to build your own copy beside it, in a folder of your own, from your own copy of the source files, so nothing you do in this course can break the answer key. When your version does not behave the way you expect, open Timberline's and compare.
This lab writes to the store. It creates a folder, copies files into it and saves a report. None of it touches the Timberline folder.
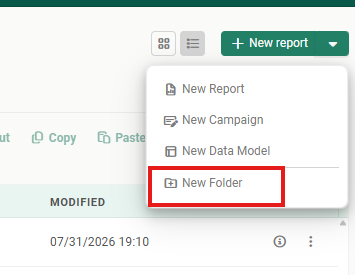
At the workspace root, select the arrow on the right-hand side of the New report button, then New Folder.
The New report split button with its menu open, listing New Report, New Campaign, New Data Model and, below a separator, New Folder, which is outlined in redTap or click the image to view it full screen
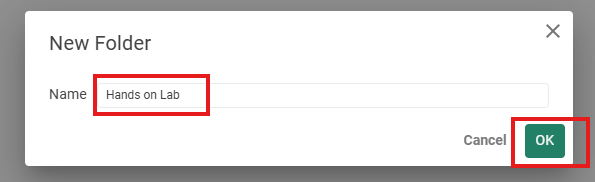
Name it Hands on Lab and select OK.
The New Folder dialog with Hands on Lab typed into the Name box and the OK button outlined in redTap or click the image to view it full screen
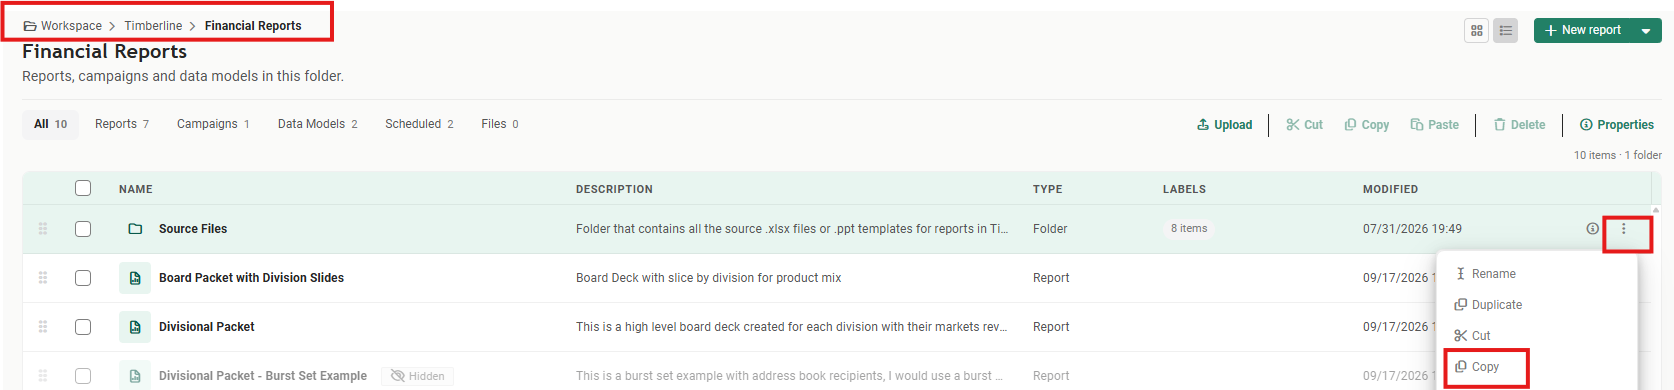
Open Timberline, then Financial Reports. At the end of the Source Files row, select the ⋮ menu, then Copy.
The Financial Reports folder with its breadcrumb Workspace, Timberline, Financial Reports outlined in red, and the overflow menu open on the Source Files row showing Rename, Duplicate, Cut and Copy, with Copy outlinedTap or click the image to view it full screen
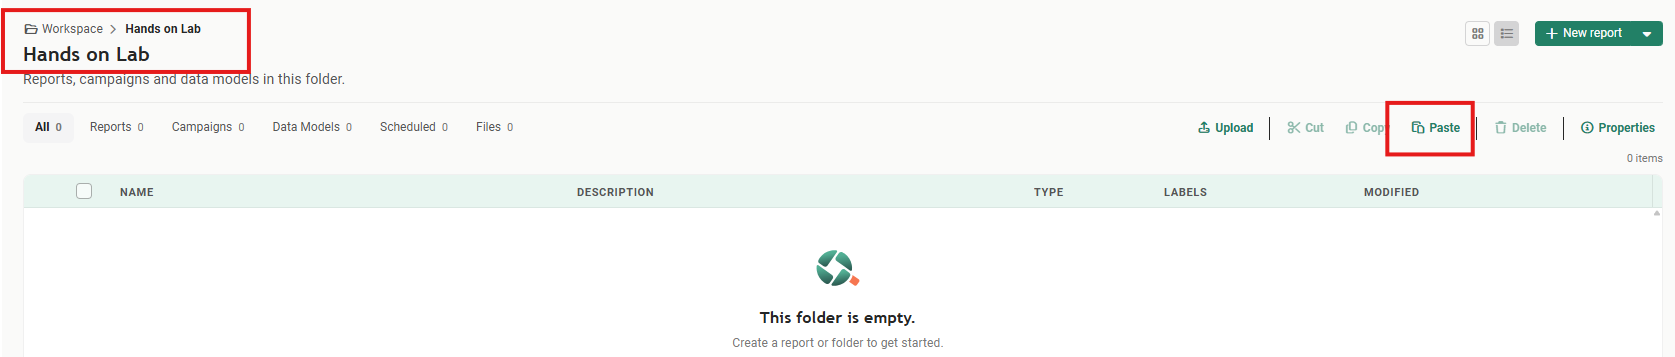
Use the breadcrumb to go back to Workspace, open Hands on Lab, and select Paste in the toolbar.
The empty Hands on Lab folder, with the breadcrumb Workspace, Hands on Lab outlined in red and the Paste button outlined in the toolbarTap or click the image to view it full screen
The folder and all eight files in it are copied in.
The Hands on Lab folder now holding one row, the Source Files folder, labeled 8 itemsTap or click the image to view it full screen
These copies are the source reports for this lab and the ones after it. Because they are copies, you are free to change them.
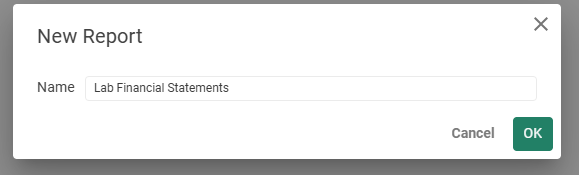
Still in Hands on Lab, select New report, name it Lab Financial Statements and select OK.
The New Report dialog with Lab Financial Statements in the Name boxTap or click the image to view it full screen
The report appears as a row. Select the pencil icon at the end of it to open the report editor.
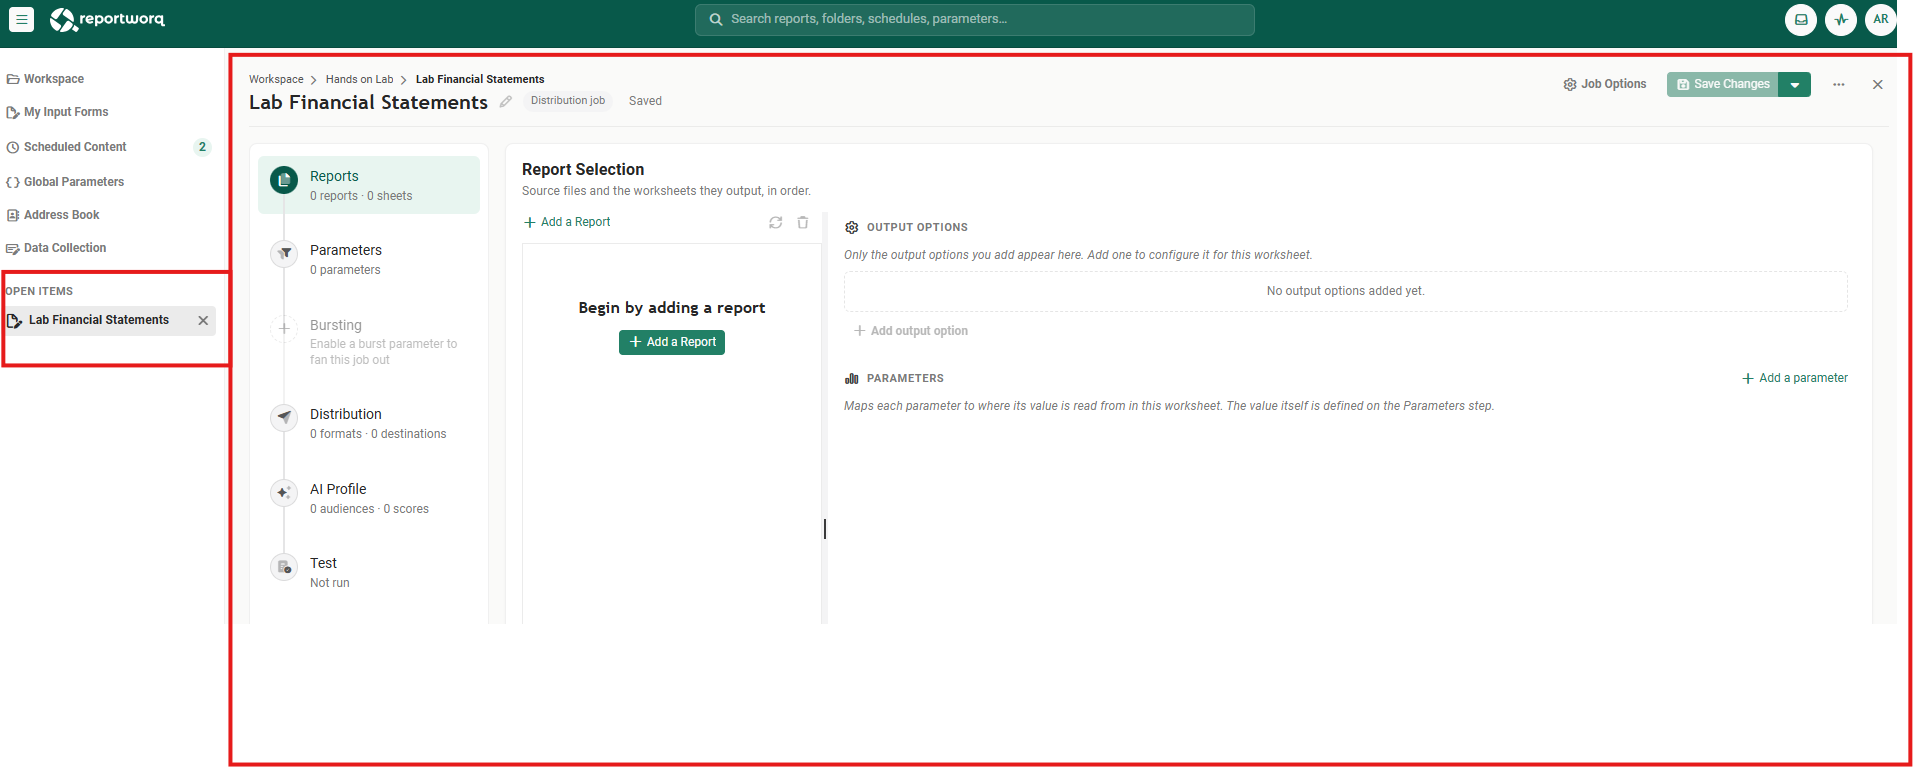
The Hands on Lab folder with two rows, Source Files and the new Lab Financial Statements report, and the pencil icon on the report row outlined in redTap or click the image to view it full screenThe report editor for Lab Financial Statements, open in the content pane with its six steps down the left (Reports, Parameters, Bursting, Distribution, AI Profile and Test) and the Report Selection panel reading Begin by adding a report, while the rail's Open Items list now carries Lab Financial Statements, outlined in redTap or click the image to view it full screen
Notice two things. The report now sits under Open Items in the rail, as Lab 3 described. And the editor is a set of steps down the left: Reports, Parameters, Bursting, Distribution, AI Profile and Test. This lab walks them in that order. Bursting is grayed out, and stays that way until you enable a parameter for burst sets, which this lab does not do.
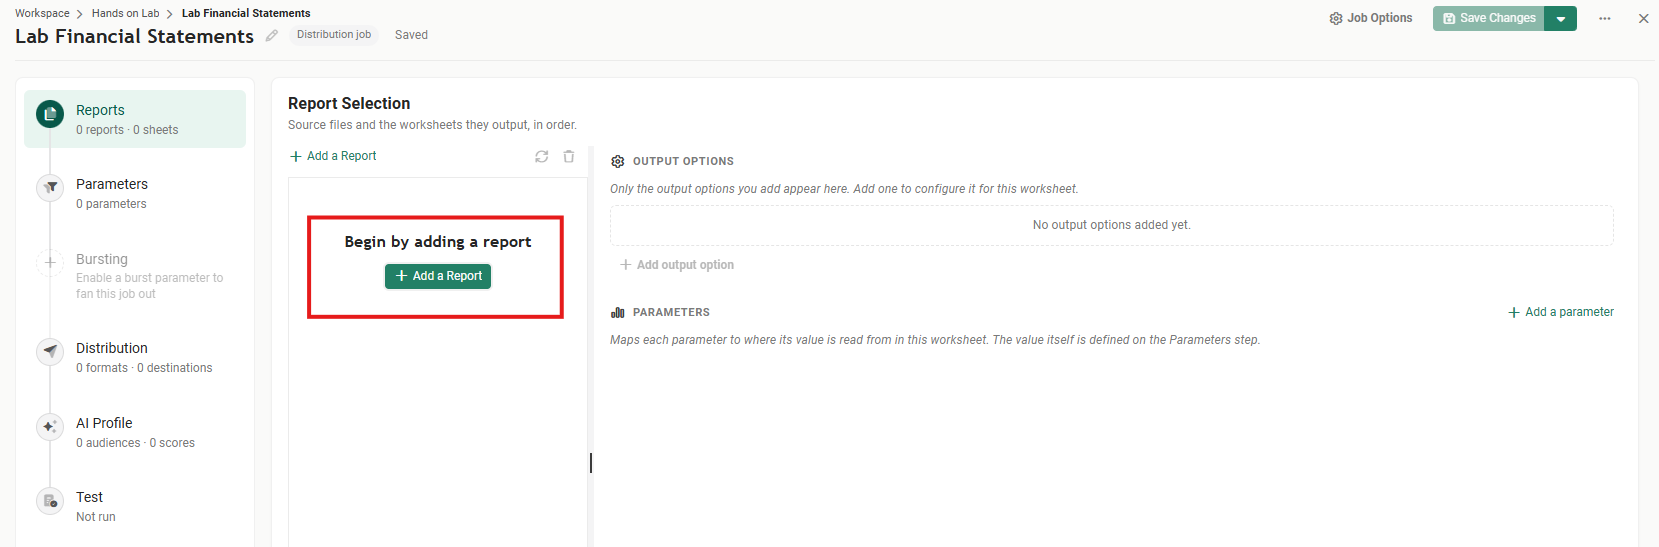
The Reports step is where you tell Reportworq which files the report is built from. Select Add a Report.
The Reports step with its empty Report Selection panel and the Begin by adding a report message and Add a Report button outlined in redTap or click the image to view it full screen
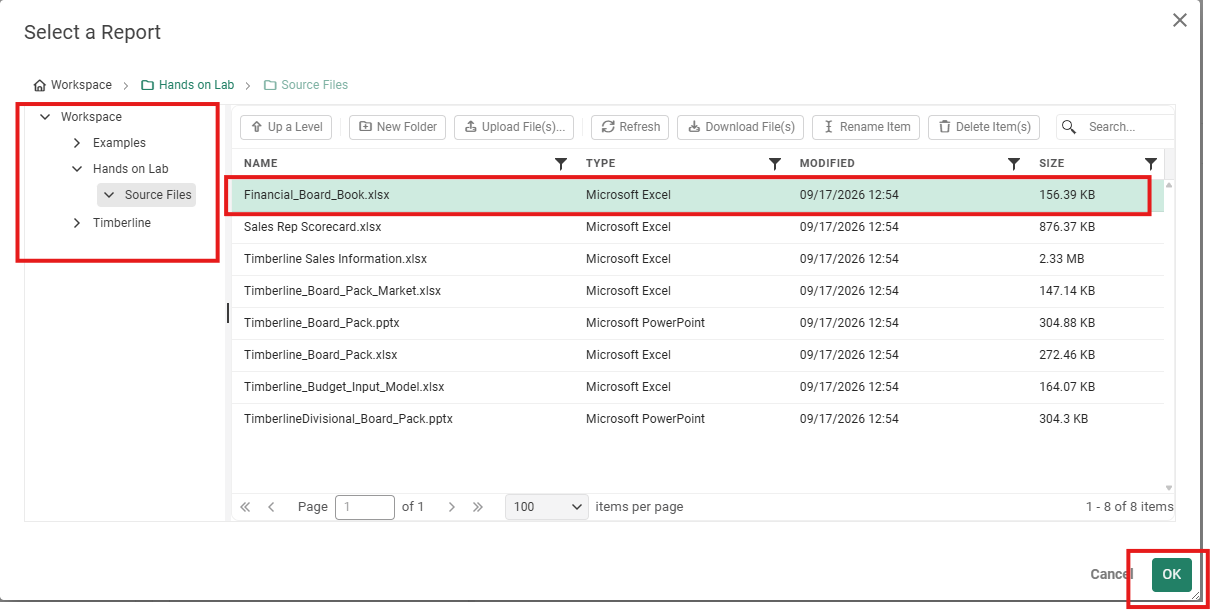
The picker opens on the workspace's own files. Expand Hands on Lab ▸ Source Files, select Financial_Board_Book.xlsx, and select OK.
The Select a Report dialog with the Workspace tree on the left expanded to Hands on Lab, Source Files and outlined in red, the eight source files listed on the right with Financial_Board_Book.xlsx highlighted and outlined, and the OK button outlinedTap or click the image to view it full screen
The picker only offers files a report can use, which is why the list here is Excel workbooks and PowerPoint files and nothing else:
Source type
Extensions
How the report uses it
Excel
.xlsx, .xlsm, .xlsb, .xls
The worksheets are the report. Parameters are written into them and they calculate.
PDF
.pdf
Inserted whole into the PDF output, in the position you give it among the worksheets.
Word
.docx, .doc
Converted to PDF, then inserted whole into the PDF output.
PowerPoint
.pptx, .ppt
Converted to PDF, then inserted whole into the PDF output.
The last three matter only when PDF is one of the report's output formats, not only when it is the only one, and they are ignored for every other format. They go in whole: there is no way to take a single page out of one. A PowerPoint file added here is also not how you make PowerPoint output; Lab 7 does that with a template chosen on the Distribution step. CSV and text files cannot be added as sources.
A report can take several source files, from one location or several. The workspace's own files, which this course uses, are always there; an administrator can also connect network shares, SharePoint, OneDrive, Box, Google Drive and Planning Analytics application folders as places to pick from.
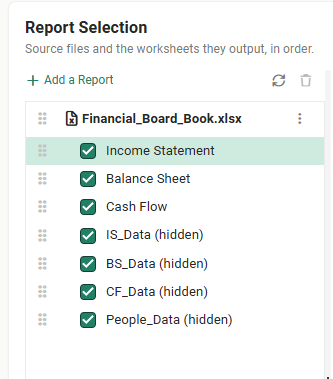
Back in the editor, the Report Selection panel now lists the workbook and every worksheet in it, including the hidden ones, which say (hidden).
The Report Selection panel with Financial_Board_Book.xlsx and its seven worksheets ticked: Income Statement, Balance Sheet, Cash Flow, and IS_Data, BS_Data, CF_Data and People_Data, each marked hiddenTap or click the image to view it full screen
Before you set any parameter, understand how the workbook works, because every parameter decision follows from it. At the end of the Financial_Board_Book.xlsx row, select the ⋮ menu, then Download. (Open does the same thing for a workspace file: it only opens the file in place when the file lives on a network path.) Open what you downloaded.
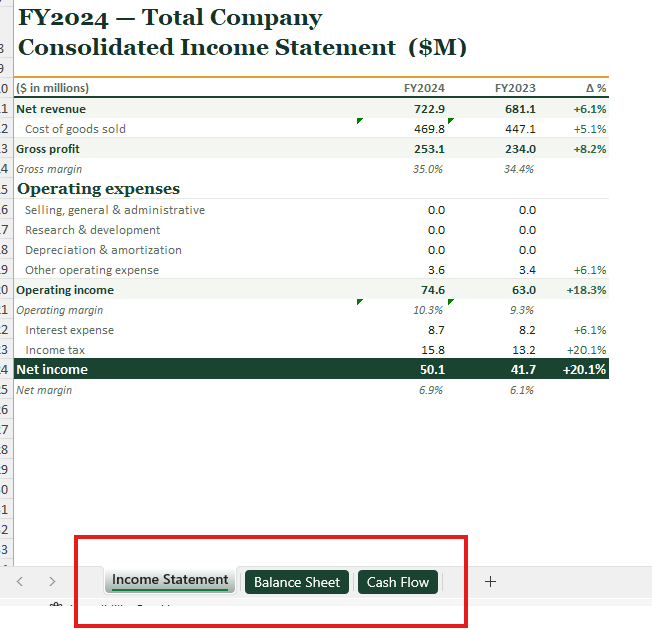
You will see three tabs: Income Statement, Balance Sheet and Cash Flow.
The downloaded workbook open in Excel on the FY2024 Total Company Consolidated Income Statement, with the three visible tabs Income Statement, Balance Sheet and Cash Flow outlined in red along the bottomTap or click the image to view it full screen
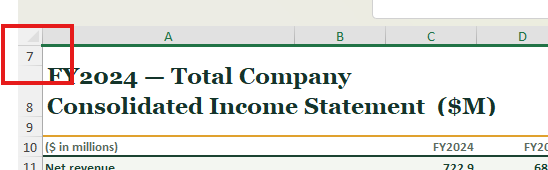
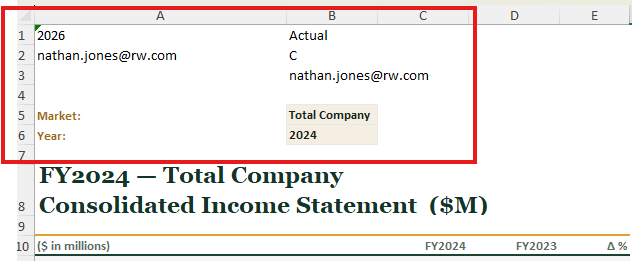
The four hidden tabs hold the data the statements read from. The statements themselves are driven by a handful of control cells in hidden rows at the top of each tab. On each of the three tabs, unhide rows 1 to 6.
The top of the Income Statement in Excel with the row headers starting at 7, the hidden rows above it, and the corner of the row header outlined in redTap or click the image to view it full screenRows 1 to 6 of the Income Statement unhidden and outlined in red: 2026 and Actual in row 1, email addresses in rows 2 and 3, and the labels Market and Year in A5 and A6 against the shaded input cells B5, Total Company, and B6, 2024Tap or click the image to view it full screen
The two shaded cells are the ones that matter. B5 is a named range called Market and B6 is a named range called Year. Change either and the whole Income Statement recalculates for that market and that year. The rows above them are worked out from those two: row 1 decides whether the year is Actual or Forecast, and rows 2 to 4 look up the people responsible for the market you chose.
Now look at the same rows on Balance Sheet and Cash Flow. Their control cells are not typed in; they point back at Market and Year on the Income Statement. That one fact decides how you set this report up:
You only need to tell Reportworq about the Income Statement. Write a market into its Market cell and the other two tabs follow it, through the workbook's own formulas.
That stops being true the moment a tab has to repeat on its own. If you wanted a separate Balance Sheet for each of several years, you would map bothMarket and Year onto the Balance Sheet's own control cells. Reportworq writes a different value into each copy, and a copy cannot take its values from the Income Statement, so every parameter that tab depends on has to be mapped on the tab itself.
Why named ranges, and not cell addresses. A named range stays attached to its cell when someone inserts a row above it. A parameter pointed at B6 would quietly start writing into the wrong cell after that edit; a parameter pointed at Year keeps working. Naming your control cells is the single best habit to bring to a workbook you want Reportworq to drive.
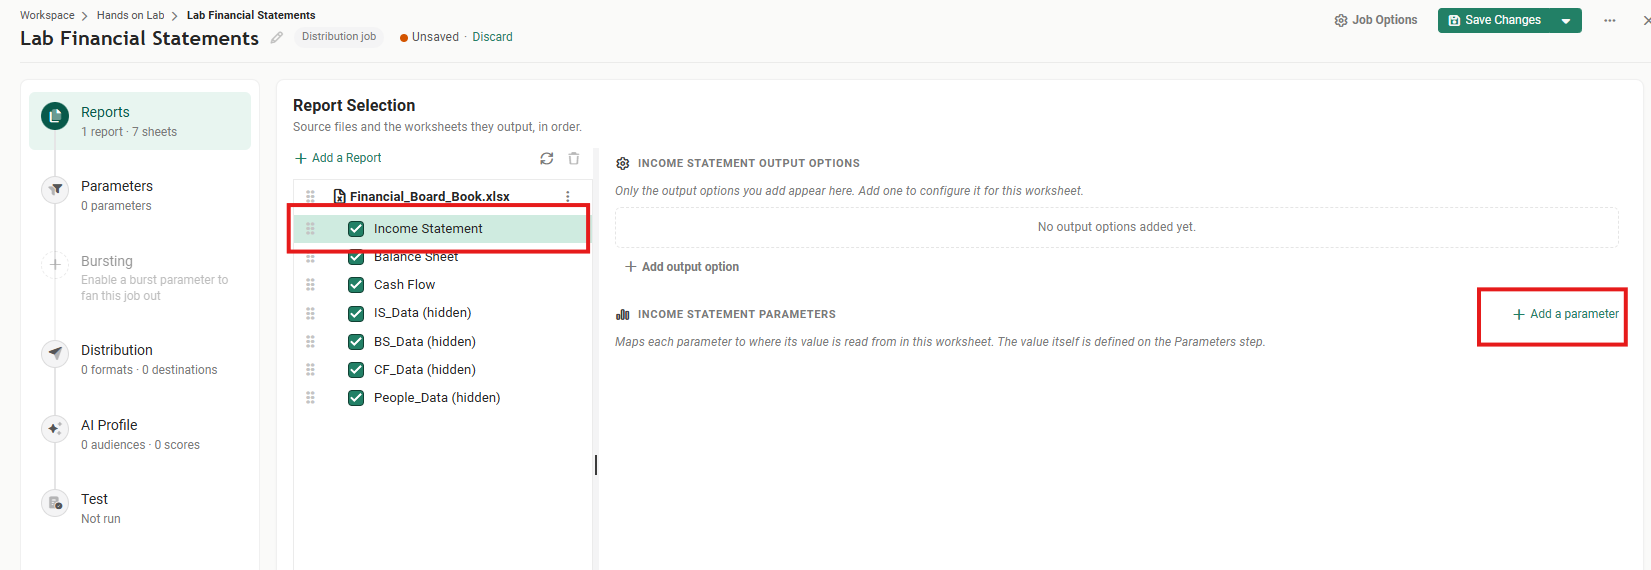
Back in the editor, still on Reports, select Income Statement in the Report Selection panel. The right-hand side now reads Income Statement Output Options and Income Statement Parameters.
The Reports step with Income Statement selected and outlined in the Report Selection panel, and the Add a parameter link outlined at the right of the Income Statement Parameters sectionTap or click the image to view it full screen
Check which worksheet is highlighted before you add a parameter. A parameter mapped here is written into this worksheet and nowhere else. Mapping Market onto the wrong tab is the most common reason a first report produces the same numbers for every market.
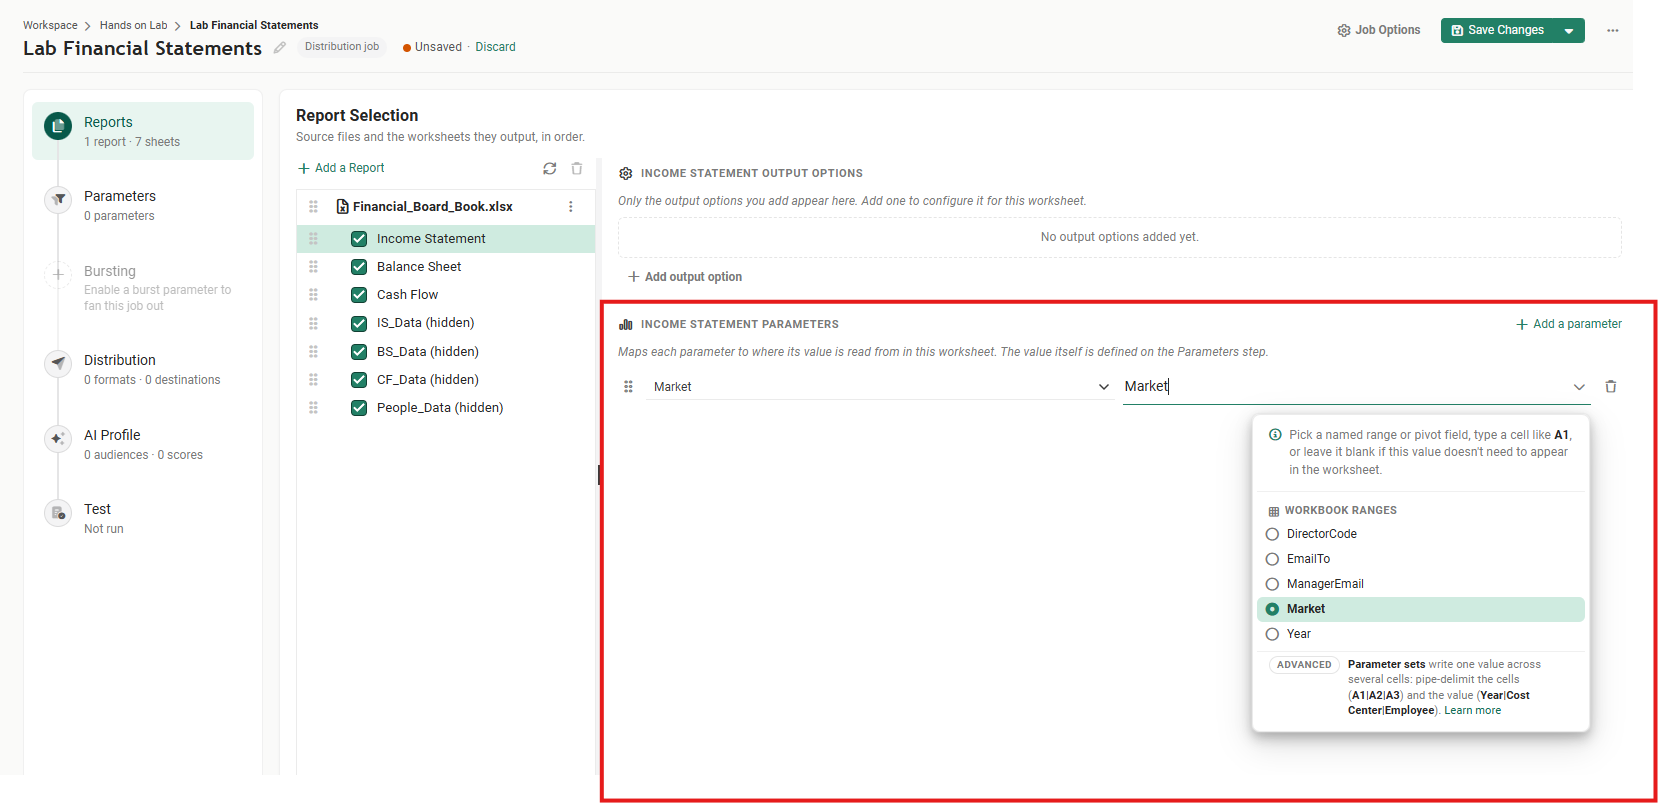
Select Add a parameter. A row appears with two boxes:
The parameter's name, on the left. Type Market.
Where in this worksheet the value goes, on the right: a named range, a cell such as A1, or a pivot field. Start typing Market and pick it from the list.
The Income Statement Parameters section outlined in red, with a row reading Market on the left and Market being typed on the right, and the location picker open below it listing the workbook ranges DirectorCode, EmailTo, ManagerEmail, Market and Year with Market selectedTap or click the image to view it full screen
The picker lists the workbook's named ranges. Those scoped to this one sheet would be listed first, under Sheet ranges; this workbook's names belong to the whole workbook, so they are under Workbook ranges.
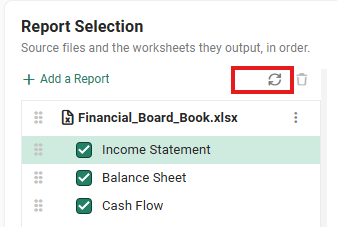
If the named range you want is not in the list, refresh. Reportworq reads the workbook's structure when you add it and remembers it. If you then add a named range or a tab in Excel and save the file back, the editor still shows what it read the first time. Select the refresh icon, Reload Reports, at the top of the Report Selection panel and it reads every source file again. Forgetting this is the classic first-week mistake.
The top of the Report Selection panel with the Reload Reports refresh icon outlined in red beside the Add a Report linkTap or click the image to view it full screen
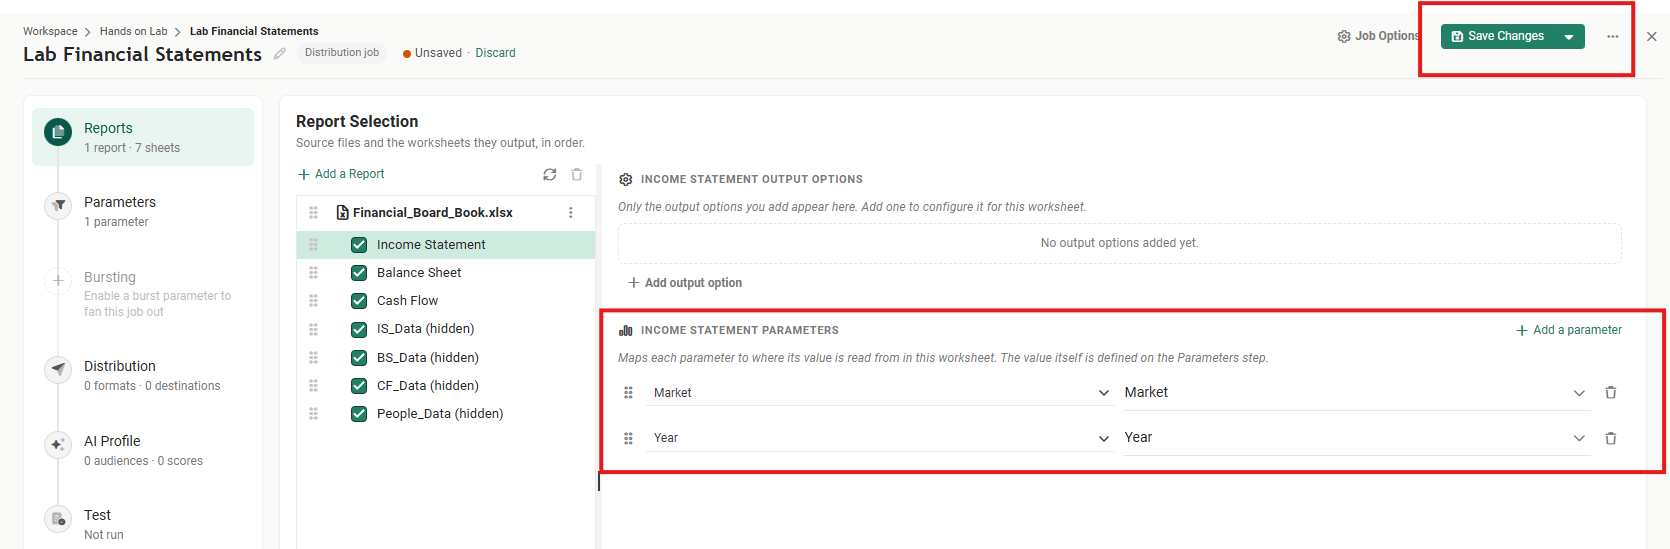
Select Add a parameter again, name it Year, and pick the Year named range. Then select Save Changes at the top right.
The Income Statement Parameters section outlined in red with two rows, Market mapped to Market and Year mapped to Year, and the Save Changes button outlined at the top rightTap or click the image to view it full screen
You have said where each value goes. You have not yet said what the values are. That is the Parameters step, in a moment.
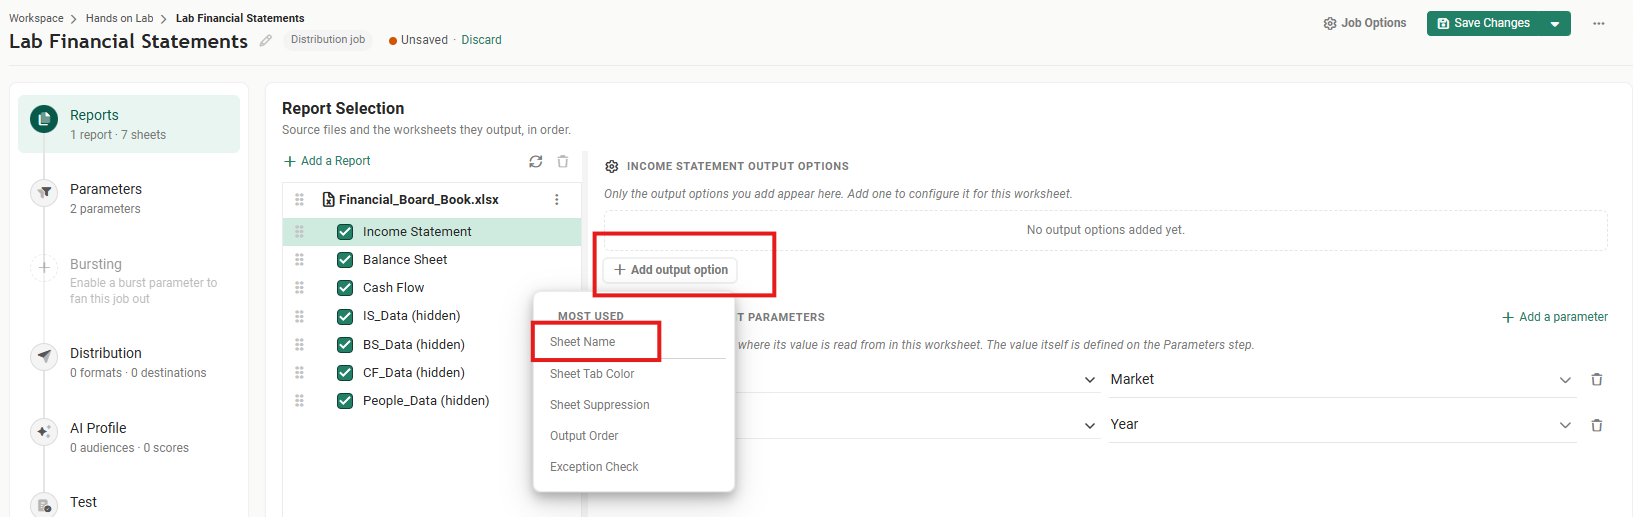
Still on the Income Statement, under Income Statement Output Options, select Add output option, then Sheet Name.
The Add output option button outlined in red, with its menu open under the heading Most used, listing Sheet Name (outlined), Sheet Tab Color, Sheet Suppression, Output Order and Exception CheckTap or click the image to view it full screen
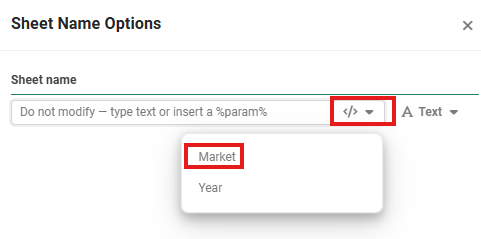
A panel opens on the right. It starts in Text mode, where you type the name and can mix in parameter values. (Switching it to Cell takes the name from a cell or named range in the workbook instead.) The panel shows only the sheet name because you have not chosen PDF yet; once PDF is an output format, it also offers two PDF bookmark levels, which Lab 5 uses. Select the </> button beside the box and choose Market, which inserts %param:Market%, or type that yourself.
The Sheet Name Options panel with an empty Sheet name box reading Do not modify, type text or insert a %param%, the insert button outlined in red and its menu open offering Market (outlined) and YearTap or click the image to view it full screen
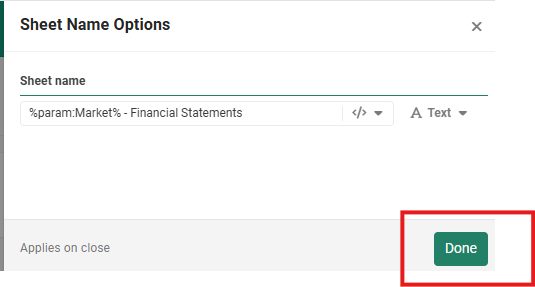
After it, type - Financial Statements, so the box reads %param:Market% - Financial Statements, and select Done.
The Sheet Name Options panel with the Sheet name box reading %param:Market% - Financial Statements and the Done button outlined at the bottom, next to the note Applies on closeTap or click the image to view it full screen
In the Canada pack, the first tab is now called Canada - Financial Statements rather than Income Statement. Select Save Changes again.
Excel allows at most 31 characters in a sheet name, and Reportworq honors that limit by cutting anything longer. It does so without a warning, at the 31st character. Canada - Financial Statements is 29 characters and fits. Total Company - Financial Statements is 36, so the Total Company pack's tab comes out as Total Company - Financial State, and the same happens to eight other markets, United Kingdom and Southeast Asia among them. You will see it in the Test step. When you build a sheet name from a parameter, count the longest value the parameter can take, not the one in front of you.
Strictly, this report does not need it: each market gets its own file, so there is only ever one Income Statement in a file. It is here for practice, because the day a parameter makes a sheet repeat inside one file, a sheet name is not optional, and it has to include the value that changes from copy to copy. Without that, every copy has the same name, and Reportworq falls back to numbering them, which nobody can read. You will see that in Lab 5.
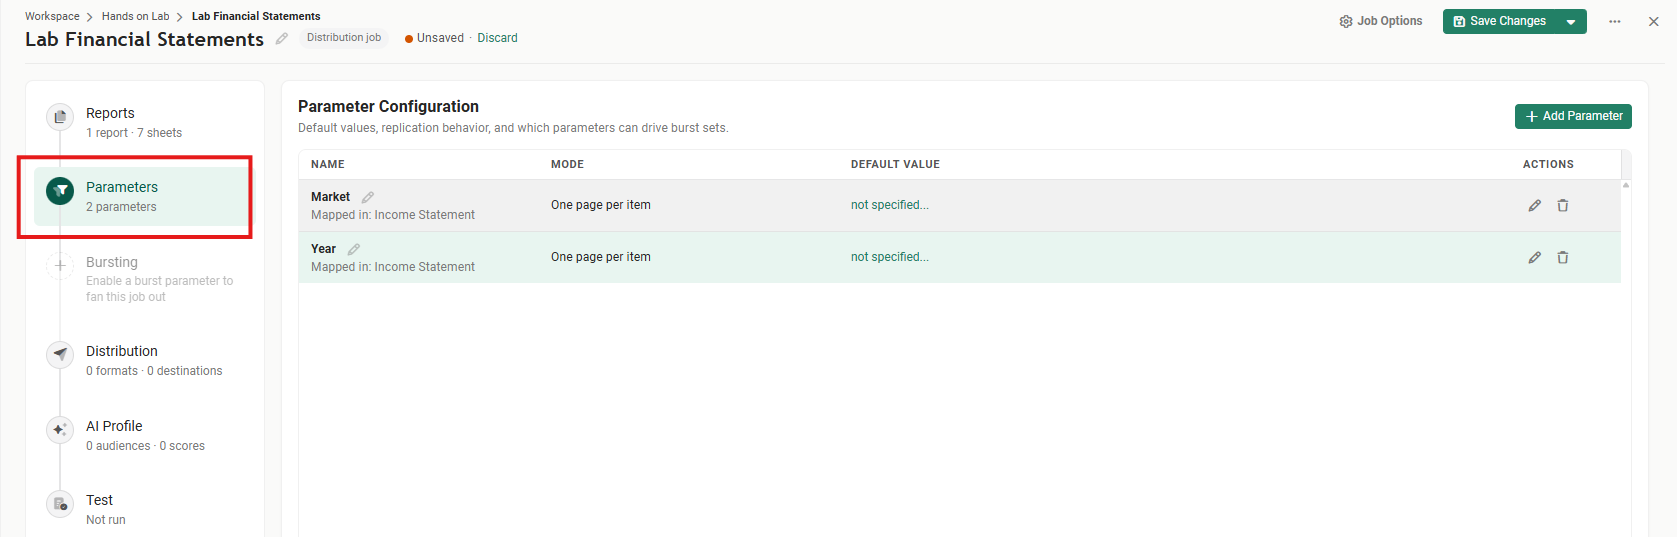
The Parameters step outlined in red in the step list, and the Parameter Configuration table listing Market and Year, each Mapped in: Income Statement, each One page per item, and each with a default value of not specifiedTap or click the image to view it full screen
Both parameters are here, each saying where it is mapped. Both are set to One page per item, which is what a parameter created from a worksheet starts as. (One created here with Add Parameter starts as No replication instead.) This screen is where you give each parameter its values and decide what having several values does.
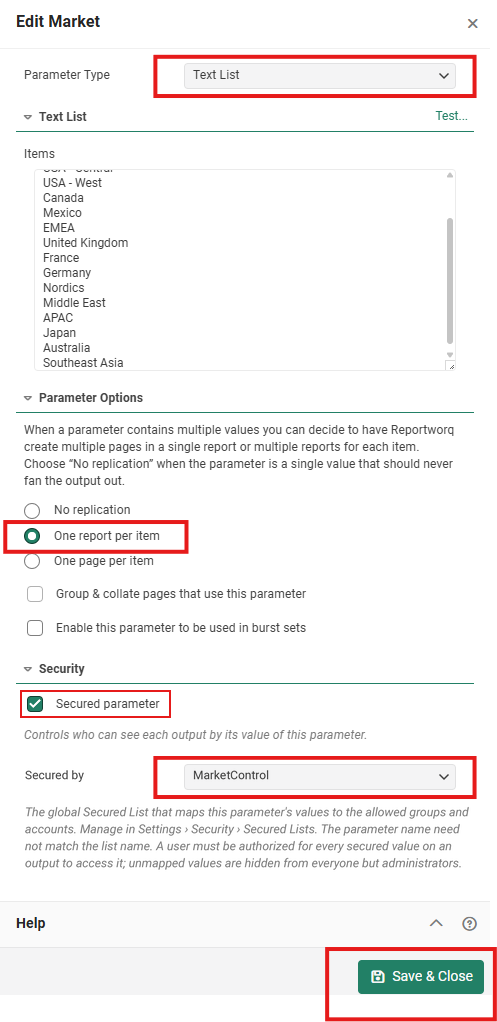
Market. Select the pencil on the Market row, or its not specified… link. In the panel that opens:
Set Parameter Type to Text List.
Paste these into Items, one per line:
Total Company
North America
USA - East
USA - Central
USA - West
Canada
Mexico
EMEA
United Kingdom
France
Germany
Nordics
Middle East
APAC
Japan
Australia
Southeast Asia
Under Parameter Options, select One report per item.
The Security section below stops being grayed out. Tick Secured parameter, and in Secured by choose MarketControl.
Select Save & Close.
The Edit Market panel with Parameter Type set to Text List and outlined in red, the Items list running from USA - Central down to Southeast Asia, One report per item selected and outlined under Parameter Options, Secured parameter ticked and Secured by set to MarketControl in the Security section, both outlined, and the Save & Close button outlinedTap or click the image to view it full screen
You have told Reportworq: here are the markets, and I want one separate report for each. Seventeen values, seventeen packs.
Securing the parameter ties each pack to the people allowed to see that market: MarketControl is a secured list, already in the Timberline store, that maps each market to the groups entitled to it. Only a One report per item parameter can be secured, because only then does each output belong to exactly one value. A later lab covers what securing does for the people who read the output; for now it is enough that the pack for Canada is marked as Canada's.
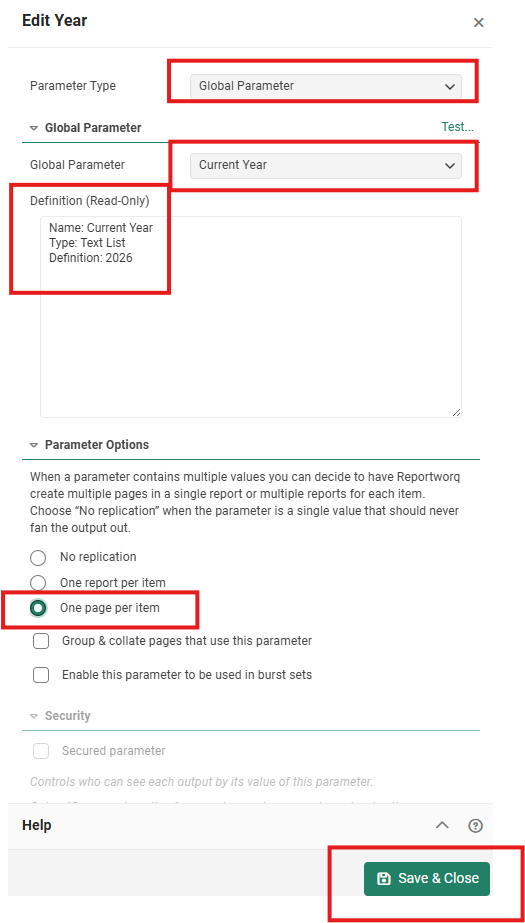
Year. Select the pencil on the Year row. This time:
Set Parameter Type to Global Parameter.
In Global Parameter, choose Current Year. The read-only Definition box shows what is behind it: a text list holding 2026.
Leave One page per item selected.
Select Save & Close.
The Edit Year panel with Parameter Type set to Global Parameter, Current Year chosen, the read-only Definition box reading Name: Current Year, Type: Text List, Definition: 2026, all outlined in red, One page per item selected and outlined, and the Save & Close button outlinedTap or click the image to view it full screen
This is the Current Year you met on the Global Parameters screen in Lab 3. Using it, rather than typing 2026, means that when the year rolls over, one edit on that screen moves this report along with the others that use it.
With a single value, One page per item produces one page, so for now it behaves exactly like No replication. It is set this way deliberately: in Lab 5 you give Year more than one value and watch the statements repeat.
Select Save Changes.
The options you left alone. Each is worth knowing before you need it:
No replication is for a parameter that holds a single value and must never multiply the output: a year that only feeds the calculation, say. It asks what to do if the value turns out not to be single: Fail the job (a single value is required), or Use the first value, and omit the pages if there are none. Choose fail when a wrong or missing value would produce a misleading report; choose use the first value when a best effort is acceptable.
Group & collate pages that use this parameter is available only for One page per item. When a parameter repeats several worksheets, Reportworq normally keeps the copies of each worksheet together: every Income Statement, then every Balance Sheet. Turn this on and the pages are arranged by value instead: all the worksheets for the first value in their normal order, then all the worksheets for the next value, and so on. Only the worksheets that use the parameter are rearranged.
Enable this parameter to be used in burst sets is how you take finer control of how parameters combine, for example when one parameter needs its own custom list for each value of another. Ticking it on any parameter switches on the Bursting step. Lab 6 covers it.
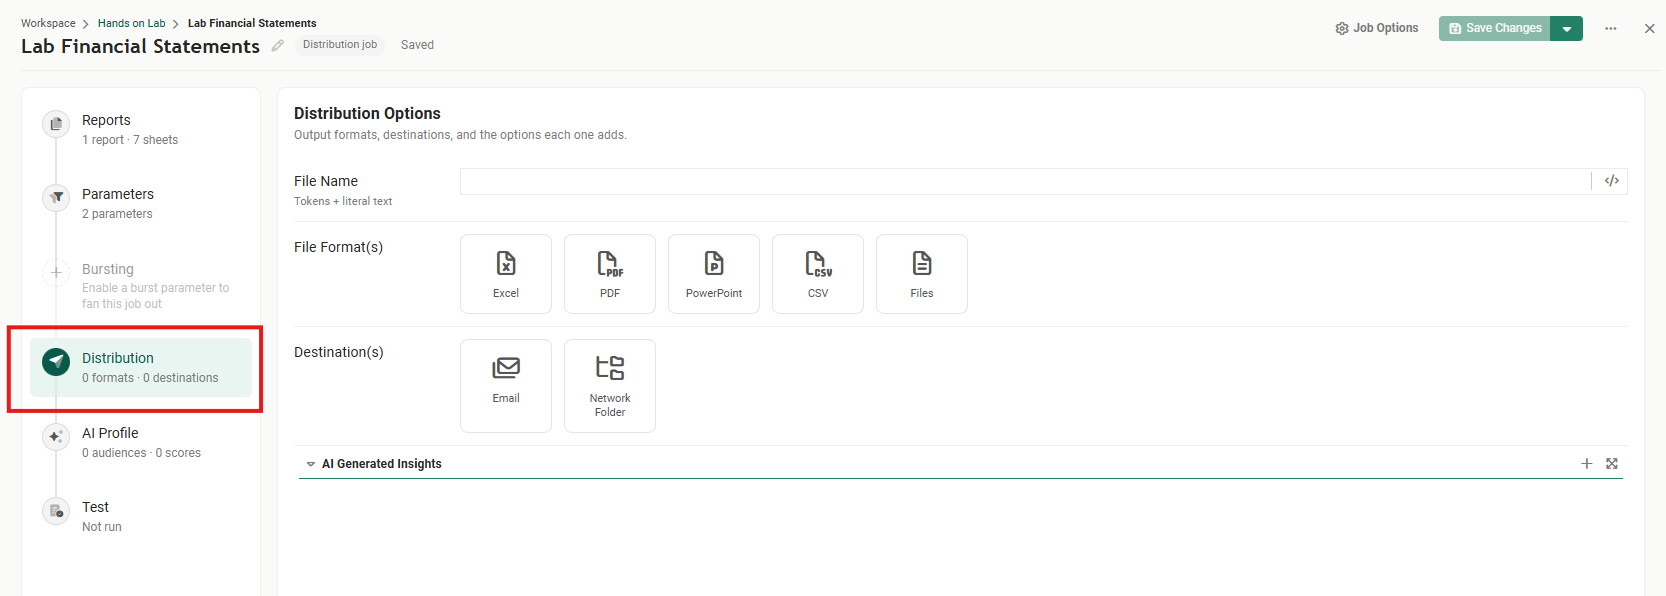
The Distribution step outlined in red in the step list, and the Distribution Options panel with an empty File Name box, File Format(s) tiles for Excel, PDF, PowerPoint, CSV and Files, Destination(s) tiles for Email and Network Folder, and a collapsed AI Generated Insights sectionTap or click the image to view it full screen
This step decides three things: what each output file is called, which formats are produced, and where they go. The Destination(s) you see depend on the distributors your administrator has set up; the Timberline instance has Email and Network Folder.
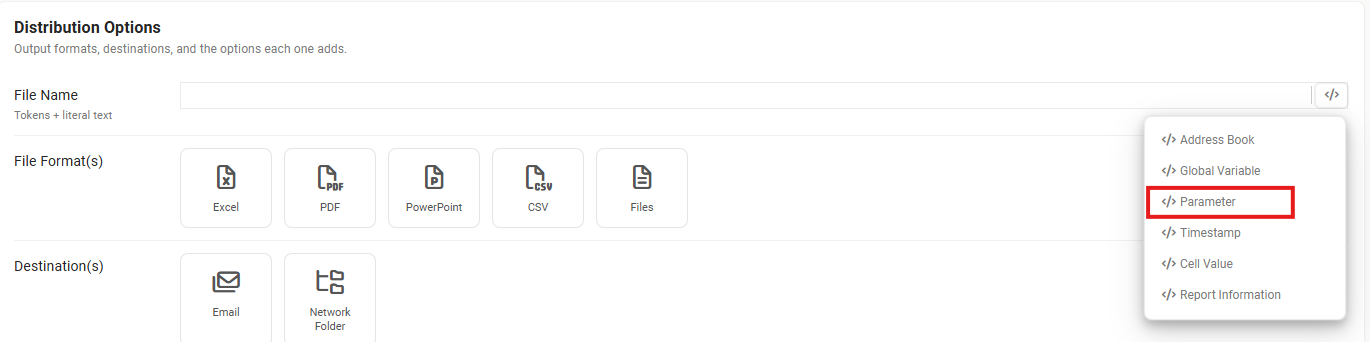
The file name. Each of the seventeen packs needs a different name, so the name is built from the parameter values. Select the </> button (Insert Variable) at the end of the File Name box, then Parameter.
The File Name box with its Insert Variable menu open, listing Address Book, Global Variable, Parameter (outlined in red), Timestamp, Cell Value and Report InformationTap or click the image to view it full screen
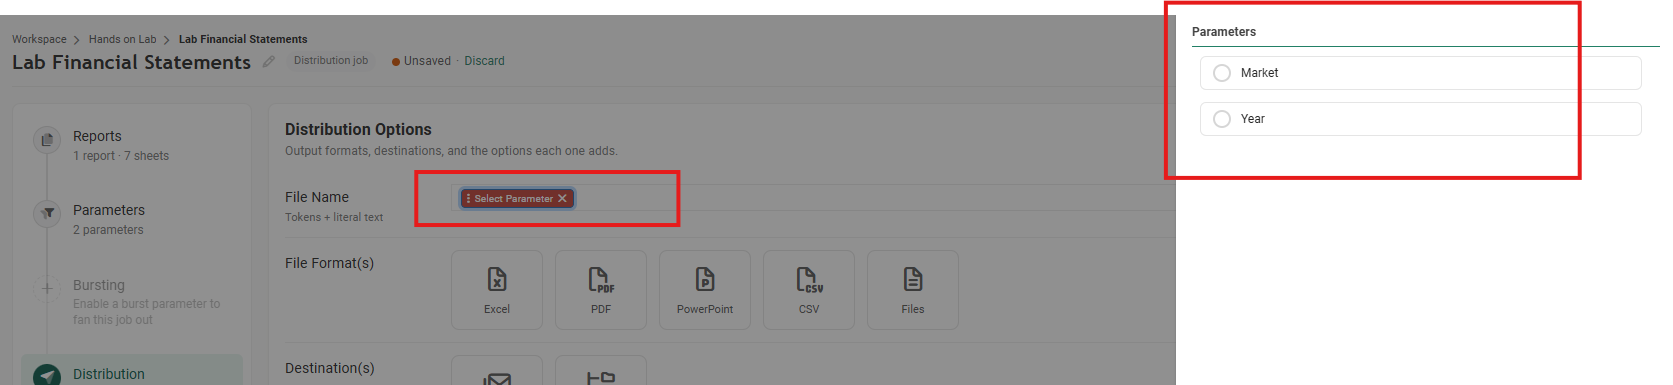
A red Select Parameter pill appears in the box. Select it and choose Year.
The File Name box holding a red Select Parameter pill, outlined, and the Parameters panel open on the right offering Market and YearTap or click the image to view it full screen
Type -, insert a second parameter pill and choose Market, then type a space and Financial Statements.
The finished File Name box: a Year pill, a hyphen, a Market pill, and the text Financial StatementsTap or click the image to view it full screen
The Canada pack will be called 2026-Canada Financial Statements.
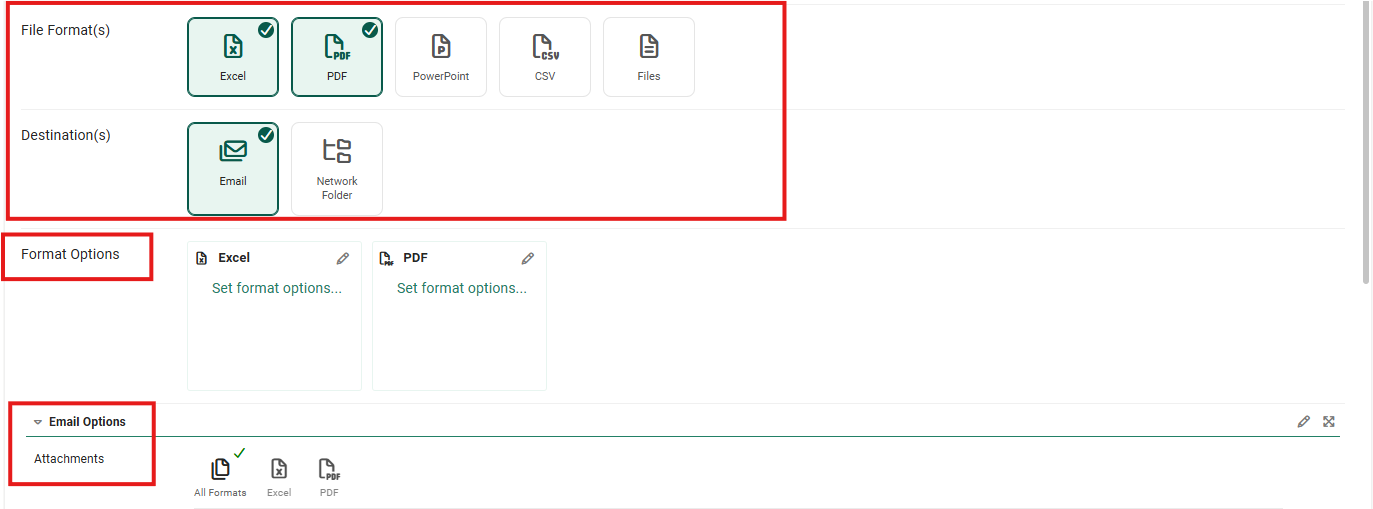
Formats and destination. Under File Format(s) select Excel and PDF. Under Destination(s) select Email. Each choice adds its own options further down the page: Format Options for the two formats and Email Options for the destination.
File Format(s) with Excel and PDF ticked and Destination(s) with Email ticked, all outlined in red, and below them the new Format Options section with Excel and PDF cards reading Set format options, and the Email Options section starting with its Attachments rowTap or click the image to view it full screen
Select the pencil on the Excel card. Formula Options decides what happens to the workbook's formulas in the file people receive:
Option
What the recipient gets
Keep All Formulas
Every formula, Excel's own and any from a connected data source, left live
Remove All Formulas
Values only; the file is completely static
Remove Provider Formulas
Formulas from data sources replaced by their values; Excel's own formulas kept
Remove Provider Formulas (except Input Formulas)
As above, but the formulas that write data back are kept; used only for sending out workbooks to collect data, which needs the Contribution license
File Format is the kind of workbook produced: Excel Workbook (.xlsx), Excel Binary Workbook (.xlsb) or Excel Macro-Enabled Workbook (.xlsm).
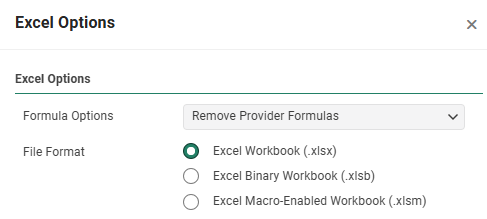
Choose Remove Provider Formulas and leave Excel Workbook (.xlsx).
The Excel Options panel with Formula Options set to Remove Provider Formulas and File Format set to Excel Workbook (.xlsx), with the .xlsb and .xlsm options below itTap or click the image to view it full screen
This workbook has no data source of its own, so here the option removes nothing. It is the right habit all the same: on a workbook connected to a planning system, it hands people a clean file whose Excel formulas still work, without the live connections they cannot use.
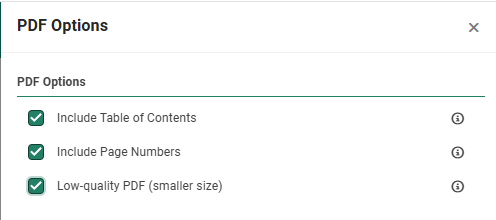
Now select the pencil on the PDF card and tick all three: Include Table of Contents (a contents page built from the worksheets), Include Page Numbers, and Low-quality PDF (smaller size), which trades image quality for a smaller attachment.
The PDF Options panel with Include Table of Contents, Include Page Numbers and Low-quality PDF (smaller size) all tickedTap or click the image to view it full screen
Scroll down to Email Options. The email is built the same way as the file name: text, with values dropped into it.
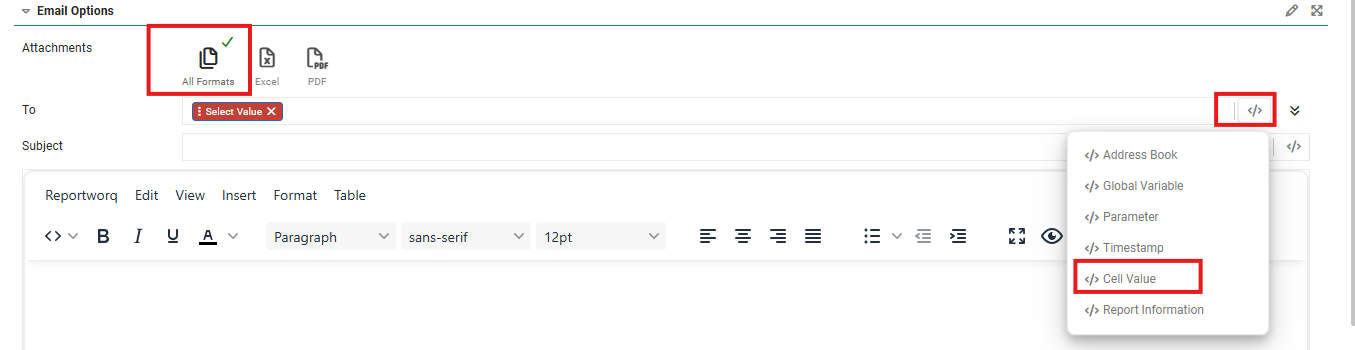
Attachments.All Formats is ticked, so each email carries both the Excel and the PDF file. Leave it. You could instead attach only one format, or untick All Formats to send no attachment at all, which is how you send a newsletter-style email, a dashboard in the body, or a link to where the file was saved instead.
To. The recipient comes from the workbook. Select the </> button at the end of the To box, then Cell Value.
The Email Options section with All Formats outlined in the Attachments row, a red Select Value pill in the To box, and the Insert Variable menu open from the To box's insert button, with Cell Value outlinedTap or click the image to view it full screen
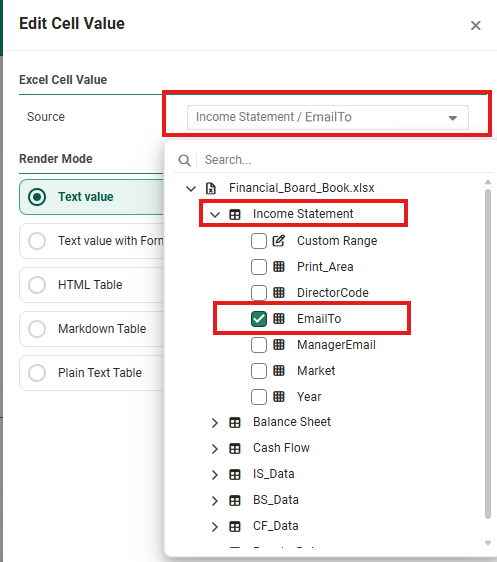
Select the red Select Value pill. In Source, expand the workbook and Income Statement and tick EmailTo, then select Save & Close. (Source asks for the workbook as well as the cell because a report can have several source files.)
The Edit Cell Value panel with the Source tree expanded to Financial_Board_Book.xlsx, Income Statement, listing Custom Range, Print_Area, DirectorCode, EmailTo, ManagerEmail, Market and Year, with the Income Statement node and the ticked cell outlined in red, and Render Mode set to Text valueTap or click the image to view it full screen
EmailTo is cell B3, one of the rows you unhid in step 5. It is a formula that assembles the right recipients for whichever market is in Market: the market's manager, its director and the VP for an individual market, the director and the VP for a region, and the VP alone for Total Company. Because Reportworq writes the market in before it reads the cell, each pack goes to that market's people.
Why not ManagerEmail? It looks like the obvious choice, but it is blank for Total Company, North America, EMEA and APAC, which have no single manager, so four of your seventeen emails would have no recipient.
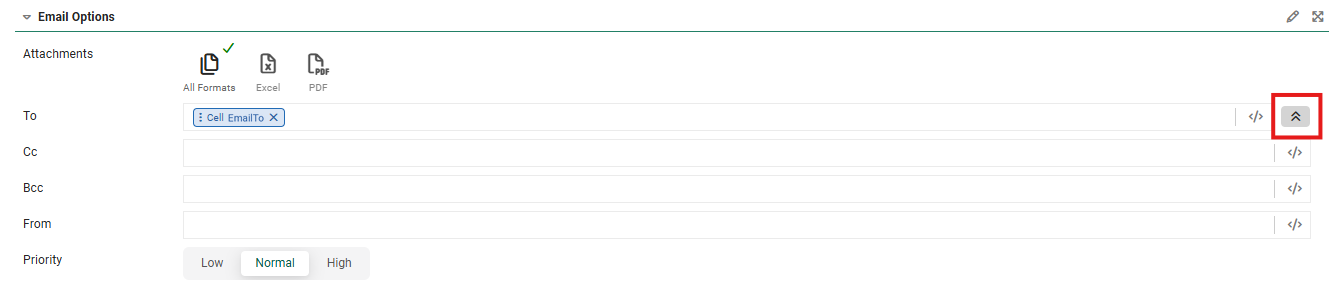
The Email Options section with the To box now holding a Cell pill, and the Show More Fields double chevron at the end of the To box outlined in redTap or click the image to view it full screen
The double chevron at the end of the To box, Show More Fields, opens Cc, Bcc and Priority (Low, Normal, High), and From if your administrator allows the sender to be overridden. Leave them all empty: a blank From sends from the instance's default address. Select the chevron again to close them.
The Email Options section expanded, showing Cc, Bcc and From boxes and the Priority buttons Low, Normal and High with Normal selected, and the collapse chevron outlined in redTap or click the image to view it full screen
Subject. Build it the same way as the file name: insert a Parameter pill and choose Year, type -, insert another and choose Market, then type a space and Financial Statements.
The Subject box holding a Year pill, a hyphen, a Market pill and the text Financial StatementsTap or click the image to view it full screen
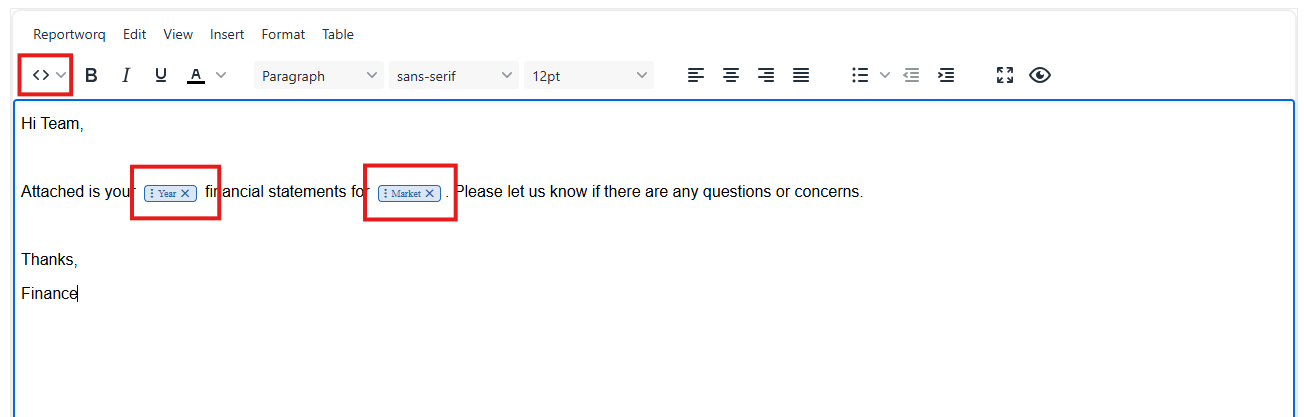
Message. In the body, type:
Hi Team,
Attached is your Year financial statements for Market. Please let us know if there are any questions or concerns.
Thanks,
Finance
For Year and Market, use the <> menu at the left of the editor's toolbar, choose Parameter, then select the red pill and choose the parameter.
The message editor holding Hi Team, then Attached is your, a Year pill, financial statements for, a Market pill, and the rest of the message, with the insert menu at the left of the toolbar and both pills outlined in redTap or click the image to view it full screen
Recipient, subject and message now all change with every pack. Select Save Changes.
The AI Profile step describes what is in the report so that the Reportworq MCP tools can tell which report answers a question someone asks an AI assistant. Nothing in this report needs it yet. A later lab comes back to it.
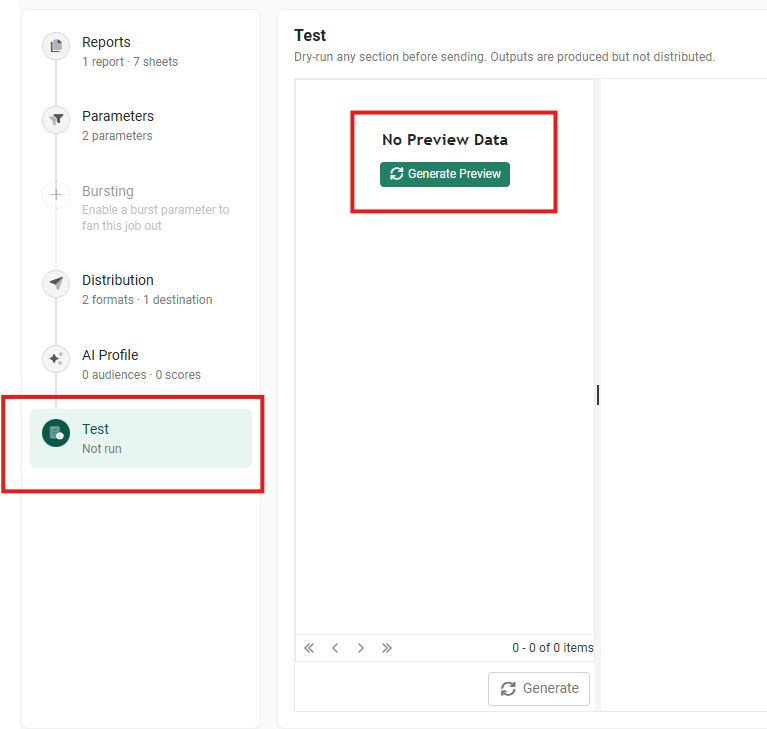
The Test step outlined in red in the step list, with the Test panel reading Dry-run any section before sending. Outputs are produced but not distributed, and the No Preview Data message and Generate Preview button outlinedTap or click the image to view it full screen
This is the most important habit in the course. The preview lists one row per output the report will produce, before anything runs.
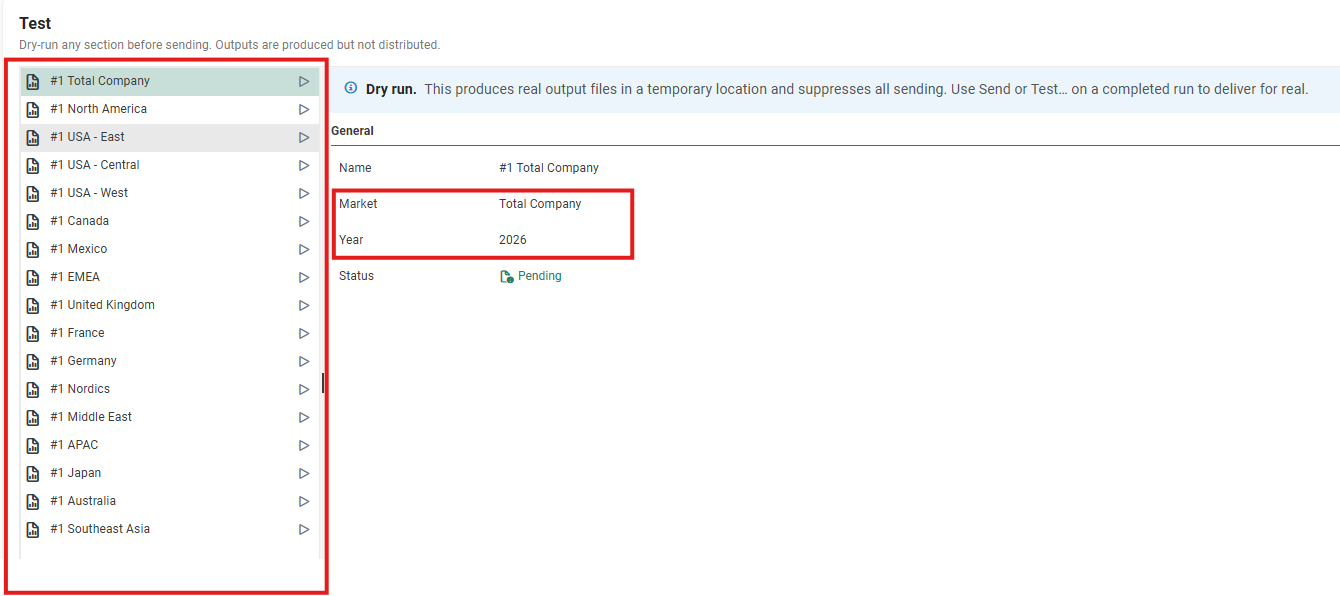
The preview list outlined in red, with seventeen rows from #1 Total Company down to #1 Southeast Asia, and the selected Total Company row's details on the right showing Market: Total Company and Year: 2026, outlinedTap or click the image to view it full screen
Seventeen rows: one per market, exactly what One report per item promised. Select a row and the General panel shows the values it will run with, Market and Year, which is 2026 from Current Year. If the count or the values are not what you expect, the parameters are wrong, and you have found out without sending anything.
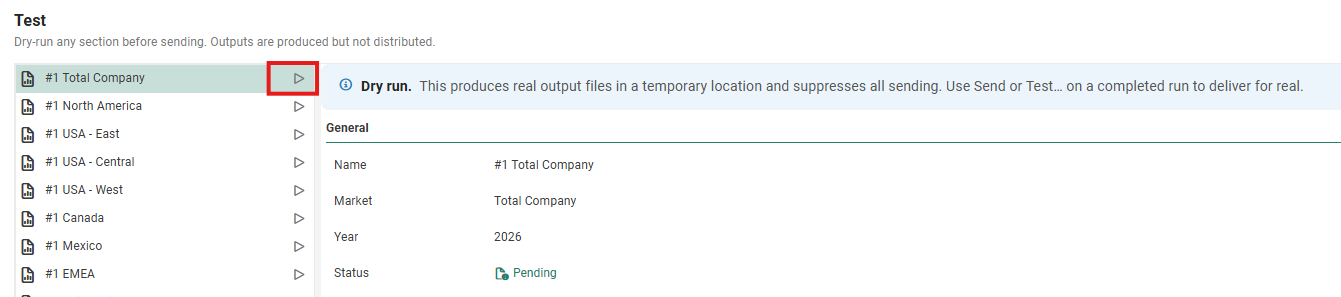
Now select the Run button (the play icon) on the Total Company row.
The top of the preview list with the Run button on the Total Company row outlined in red, and the Dry run notice at the top of the details panelTap or click the image to view it full screen
Read the notice first: this is a dry run. Reportworq calculates that pack in full and produces the real files, but in a temporary location, with all sending suppressed. When it finishes, the panel shows the files and the email exactly as they would go out. Open the files: check that the Income Statement tab is named for the market (and notice that for Total Company the name stops at Total Company - Financial State, the 31-character limit from step 7), that the figures are the market's, and that the Balance Sheet and Cash Flow followed it. Check the email's recipient, subject and message. Send and Test… on the finished run are there to deliver it for real; you do not need them now.
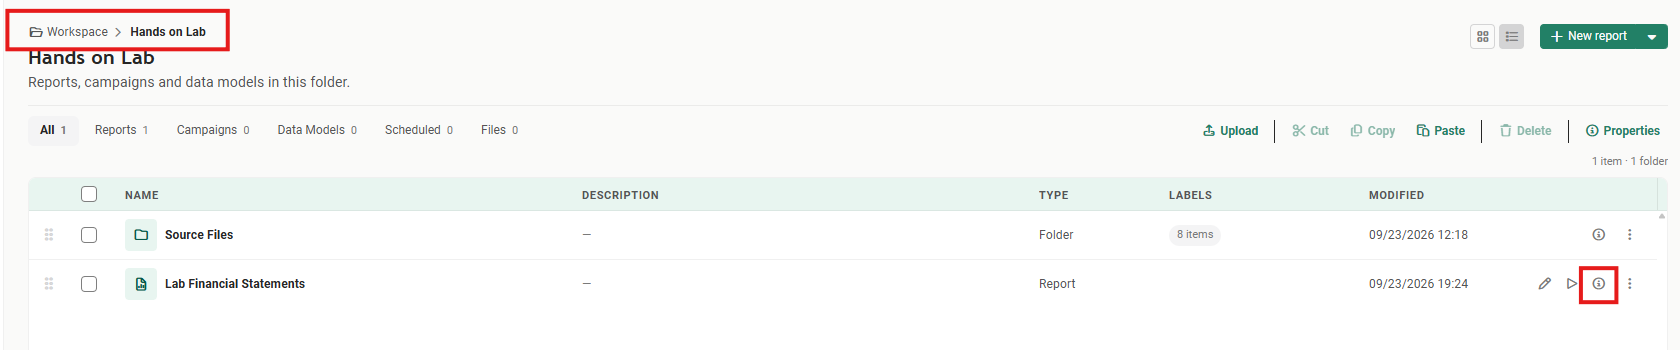
Select Save Changes if you have not already, then use the breadcrumb to go back to Hands on Lab. Select the ⓘ icon, Properties, at the end of the Lab Financial Statements row.
The Hands on Lab folder with the breadcrumb Workspace, Hands on Lab outlined in red, and the Properties icon outlined at the end of the Lab Financial Statements rowTap or click the image to view it full screen
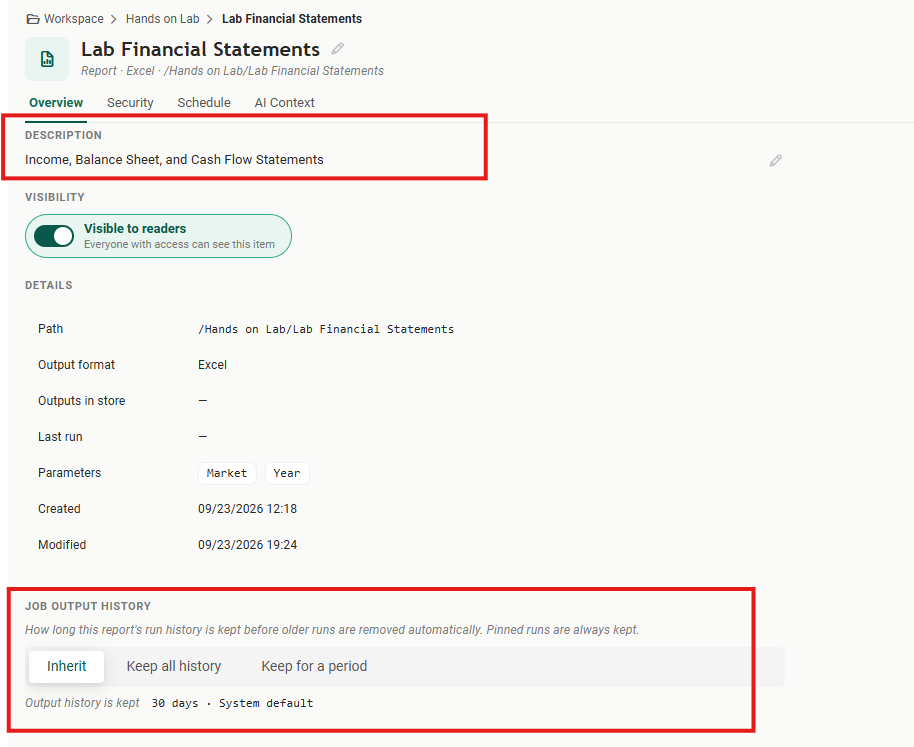
On the Overview tab, select the pencil beside Description and enter Income, Balance Sheet, and Cash Flow Statements, or a description of your own. Leave Visibility on Visible to readers and Job output history on Inherit.
The Lab Financial Statements properties on the Overview tab, with the Description Income, Balance Sheet, and Cash Flow Statements outlined in red, Visibility on Visible to readers, the Details list (Path, Output format, Outputs in store, Last run, Parameters Market and Year, Created and Modified), and the Job Output History section outlined, set to Inherit, which keeps output history 30 days by the system defaultTap or click the image to view it full screen
The same panel tells you the report's path, its parameters and when it was created and last changed, without opening the editor. Save and close it. The description now shows in the folder, which is what the people browsing it will read.
The Hands on Lab folder with the Lab Financial Statements row now showing the description Income, Balance Sheet, and Cash Flow Statements, outlined in redTap or click the image to view it full screen
The worksheet says where; the Parameters step says what. They are separate on purpose. The same Market parameter could be mapped into three worksheets, or into three workbooks, and its values are still defined once. That is also why a parameter mapped into the wrong worksheet goes wrong so quietly: the values are right, and they are being written somewhere nothing reads them.
Reportworq writes, Excel calculates. Reportworq does not know what an income statement is. It writes Canada into Market, lets the workbook recalculate, and captures the result. Everything clever in this report, the Balance Sheet following the Income Statement and the recipient list assembling itself, is the workbook's own formulas. The better your workbook is built, the less the report has to do.
Replication is the one real decision.One report per item means a separate file, and a separate email, for each value. One page per item means the sheet repeats inside one file. Almost every report you will ever build is some combination of those two choices, and the next few labs are about exactly that.
Prove the preview counts before anything runs. On the Parameters step, take Germany out of Market's list, save, and generate the preview again. Sixteen rows. The preview is the cheapest place to catch a list that is wrong. Put Germany back.
Rename the tab from a cell. Open the Income Statement's Sheet Name option and switch it from Text to Cell, then point it at the Market named range. Run a pack and compare the tab name with the one you had.
Compare with the answer key. Open Timberline ▸ Financial Reports ▸ Financial Statements in the editor and walk the same steps. The parameters, formats, file name and email should match yours. Three differences are expected and are not mistakes on your part: it lists only the three visible worksheets rather than all seven, its Income Statement carries a PDF bookmark title rather than a sheet name, and its message wording differs slightly. Anything else that differs is worth going back to look at.
This report does not send anything yet. A dry run suppresses all sending. Running the report for real, from the folder or on a schedule, delivers to the Email Inbox while no email provider is configured, and to real people once one is. Lab 11 covers running on a schedule.
Parameters can come from somewhere other than a list you type. A text list is the simplest source, not the usual one: in production, the list normally comes from the planning model or a database, so adding a market there adds a pack here without anyone editing the report. This course types its lists because the demo content has no data source connected.
Open and Download do the same thing for a workspace file.Open only opens a file in place when it is stored on a network path the browser can reach.
Lab 5: A sheet per value. You have built one file per market. Next you take a copy of the same report, give Year more than one value, and watch every statement repeat inside each market's pack: One page per item doing real work, and the sheet name you set here gaining the year it needs to tell the copies apart.
Feedback on this page
Comments, questions, requests, or something missing or unclear? Email us - the page you are on is filled in for you.