
Lab 5: A sheet per value#
What you are doing. Finance liked the packs from Lab 4 and now wants two years in each one: the 2025 and 2026 statements side by side, in the same file, still one file per market. You are going to make every statement in the pack repeat once per year.
What this shows you. One page per item doing real work: a worksheet copied inside one file, once for each value of a parameter. It is also the moment the warning in Lab 4 comes true. A tab that repeats on its own needs its parameters mapped on the tab itself, and each copy needs a name of its own.
How long. About 40 minutes.
What you need. The finished Lab Financial Statements report from Lab 4, in your Hands on Lab folder, on the same instance, signed in as admin@rw.com.
Before you start#
You are going to work on a copy of your Lab 4 report, so the one-year version stays exactly as you built it. When the copy does something you do not expect, open the original beside it and compare.
This lab writes to the store. It copies a report and changes the copy. Nothing in the Timberline folder, and nothing in your Lab 4 report, is touched.
Part A: A copy to work on#
1. Copy the Lab 4 report#
Open Hands on Lab. At the end of the Lab Financial Statements row, select the ⋮ menu, then Copy.
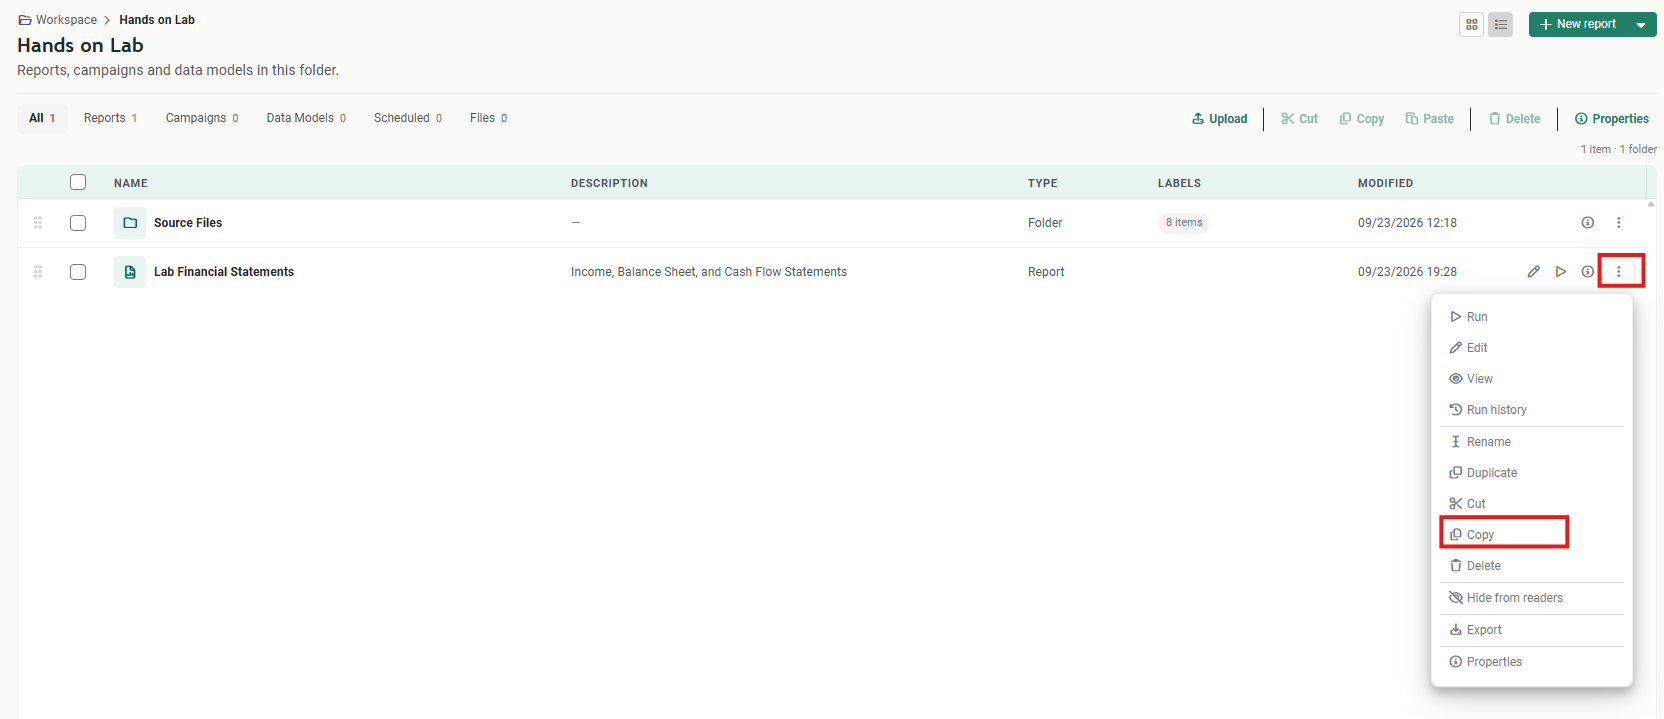
Select Paste in the toolbar. The copy is pasted into the same folder as Lab Financial Statements (1), numbered because the folder already holds a report with that name.
2. Rename it and open it#
At the end of the new row, select the ⋮ menu, then Rename, and name it Lab Financial Statements Sheet Replication.
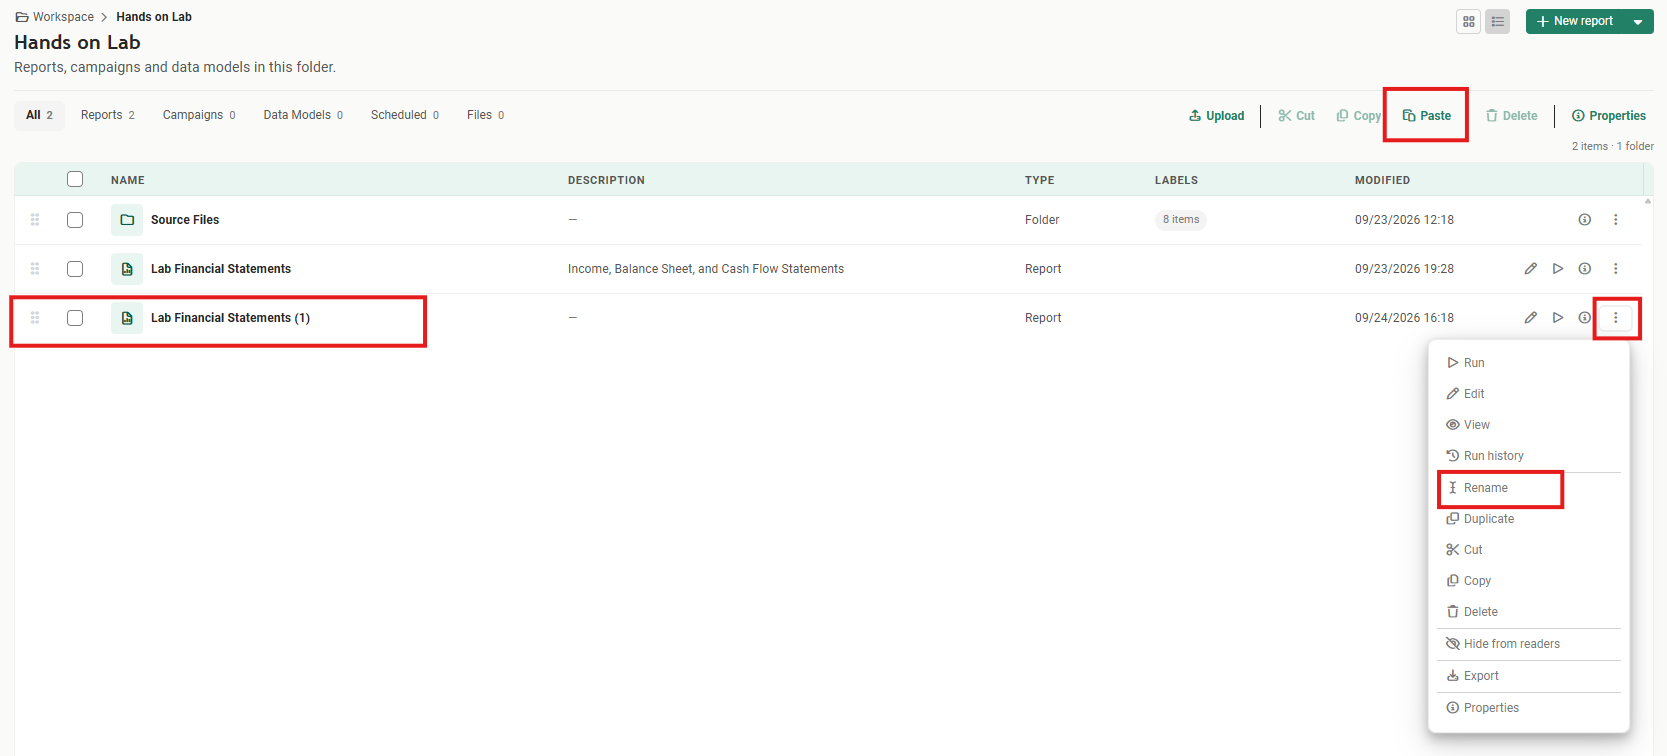
The shortcut is Duplicate. Duplicate, in the same menu, does the copy and the paste in one step and leaves the copy in the same folder. Copy and Paste is the longer way round, and the one to use when the copy belongs in a different folder.
Select the pencil icon at the end of the renamed row to open the report editor.

Everything you set in Lab 4 came across with the copy: the source workbook, the mapped parameters, the sheet name, the formats and the email.
Part B: Make every statement repeat#
Recall how the workbook works, from Lab 4 step 5. Only the Income Statement has control cells you type into, the Market and Year named ranges. The Balance Sheet and the Cash Flow have their own control cells in hidden rows at the top, and those cells are formulas that point back at the Income Statement:
| Tab | Market | Year |
|---|---|---|
| Income Statement | B5, the named range Market |
B6, the named range Year |
| Balance Sheet | B2, which reads =Market |
B3, which reads =Year |
| Cash Flow | B2, which reads =Market |
B3, which reads =Year |
In Lab 4 that was all you needed: one year, so one copy of each tab, and the other two tabs followed the Income Statement. Now each tab repeats once per year, and a copy of the Balance Sheet cannot follow a copy of the Income Statement, so every copy has to be given its own year. That is what this part does, one tab at a time. And because each tab will now appear twice in the file, each copy needs a sheet name with the year in it.
3. Rename the Income Statement's copies#
On the Reports step, select Income Statement in the Report Selection panel. Under Income Statement Output Options, the Sheet Name you set in Lab 4 is summarized as Literal Text: %param:Market% - Financial Statements.
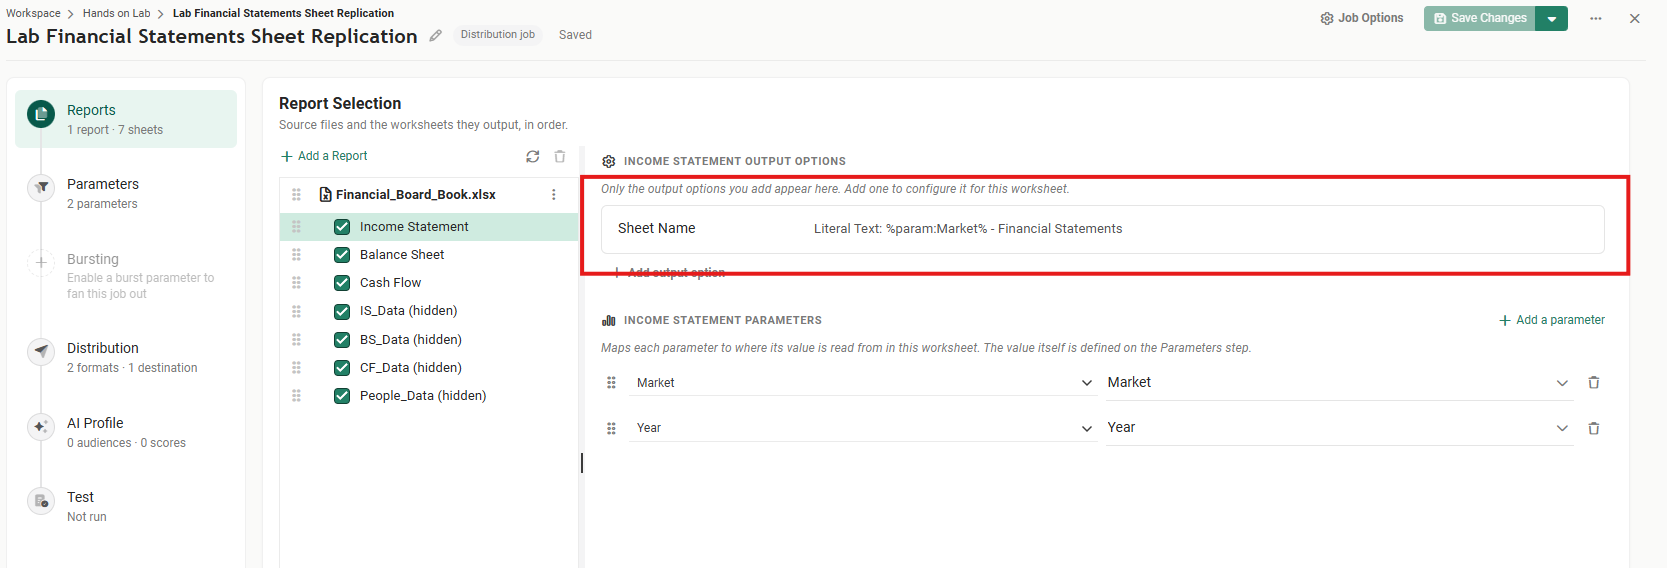
Select the row to edit it. (Hovering over it also shows a pencil, which does the same, and an X, which removes the option.) The Sheet Name Options panel opens.
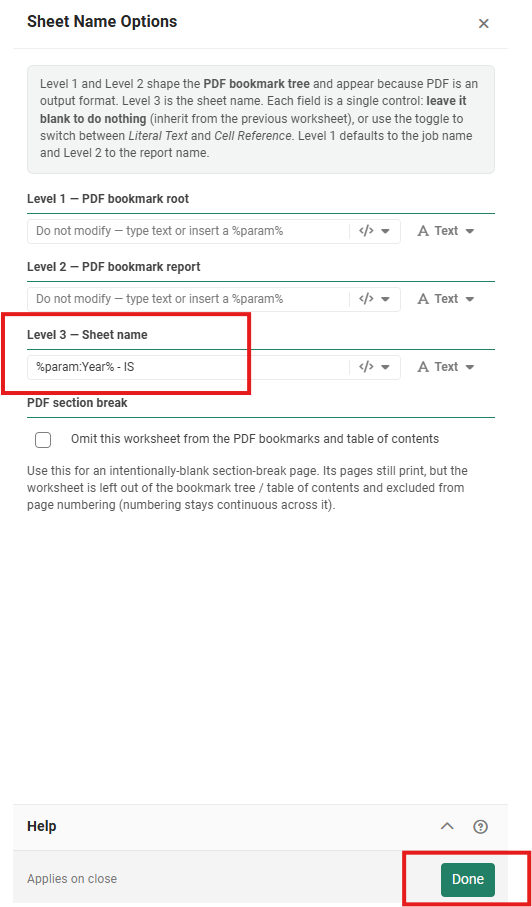
It looks different from the one you used in Lab 4, because in Lab 4 you set the sheet name before you chose PDF on the Distribution step. With PDF as an output format, the panel has three levels:
- Level 1 - PDF bookmark root and Level 2 - PDF bookmark report shape the bookmark tree and table of contents of the PDF, and appear only because PDF is an output format. Left blank, Level 1 is the job name and Level 2 is the report name.
- Level 3 - Sheet name is the sheet name you set in Lab 4.
- PDF section break, a checkbox reading Omit this worksheet from the PDF bookmarks and table of contents, is for a deliberately blank divider page.
Leave Level 1, Level 2 and the checkbox alone for now; step 11 comes back to Level 2. In Level 3 - Sheet name, replace the text so that it reads %param:Year% - IS, then select Done. You can type the token, or delete %param:Market% and insert Year with the </> button, as in Lab 4.
Select Save Changes.
Why the market has gone from the name. Each file is still one market's, so the market adds nothing that tells two tabs in the same file apart; the year is the only thing that differs from copy to copy. It also keeps the name short: 2026 - IS is 9 characters, well inside the 31 that Excel allows, so nothing is cut off the way Total Company - Financial State was in Lab 4.
4. Map the parameters on the Balance Sheet#
Select Balance Sheet in the Report Selection panel, and check that it is the highlighted row before you go on. Select Add a parameter. A row appears, named New Parameter: open the drop-down on its name and choose Market. Select Add a parameter again and choose Year for the second row.
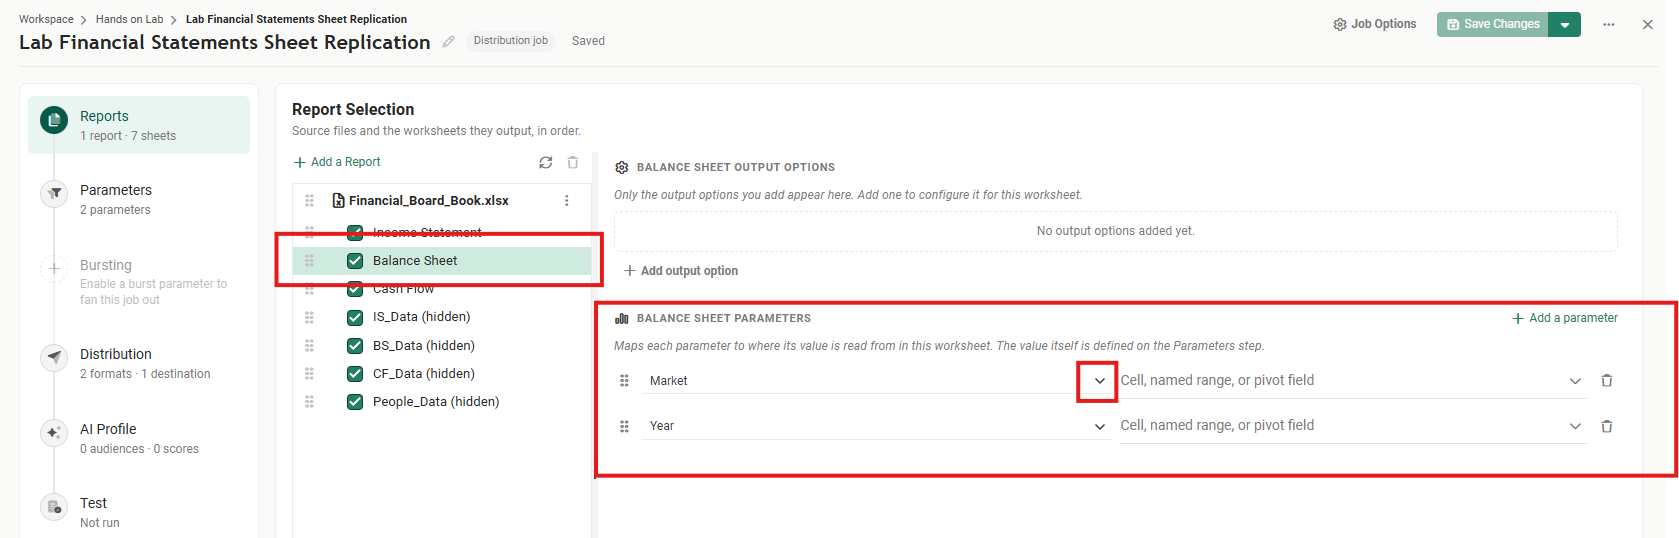
Choosing a name from the drop-down, rather than typing a new one, matters: it is the same Market and the same Year the job already has, with the values you give them on the Parameters step. A parameter's name is shared across the whole job.
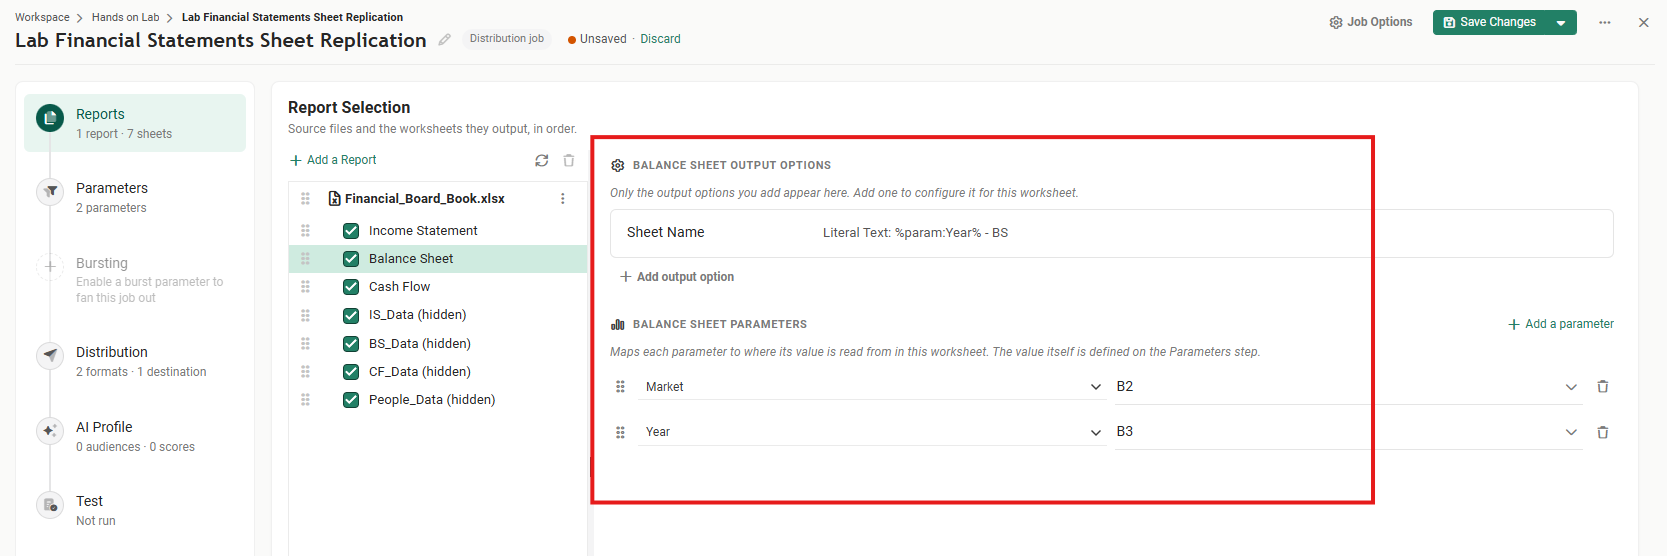
Now say where each value goes on this tab. In the box on the right of the Market row, type B2. On the Year row, type B3. These are the cells, not named ranges: this workbook has no names on the Balance Sheet, and the Market and Year names both belong to cells on the Income Statement. Reportworq writes each copy's value straight into the copy's own B2 and B3, where the formulas pointing at the Income Statement used to be.
Want names on this tab too? You can, but not in this lab. Lab 4 explained why a named range is safer than a cell address. To give the Balance Sheet names of its own, open the workbook in Excel and name B2 and B3 with names that are not
MarketandYear, such asMarketBSandYearBS. Excel does not allow two workbook-level names that are the same, and distinct names keep it clear which tab each one drives. Save the workbook, then in Hands on Lab ▸ Source Files select Upload and upload it: Reportworq asks whether to overwrite the file with the same name, and replaces it in place, so every report that uses it keeps working. Back in the editor, select Reload Reports (the refresh icon from Lab 4 step 6) so the new names appear in the picker.
Still on the Balance Sheet, under Balance Sheet Output Options, select Add output option, then Sheet Name, and set Level 3 - Sheet name to %param:Year% - BS. Select Done, then Save Changes.
5. Do the same for the Cash Flow#
Select Cash Flow and repeat step 4: add Market on B2 and Year on B3, and a Sheet Name of %param:Year% - CF. Select Save Changes.
All three statements now carry both parameters and a sheet name built from the year. The four hidden data tabs have no parameters mapped, so they are not copied.
6. Give Year two values#
Select the Parameters step. Both rows now say they are mapped in more than one worksheet. Select the pencil on the Year row.
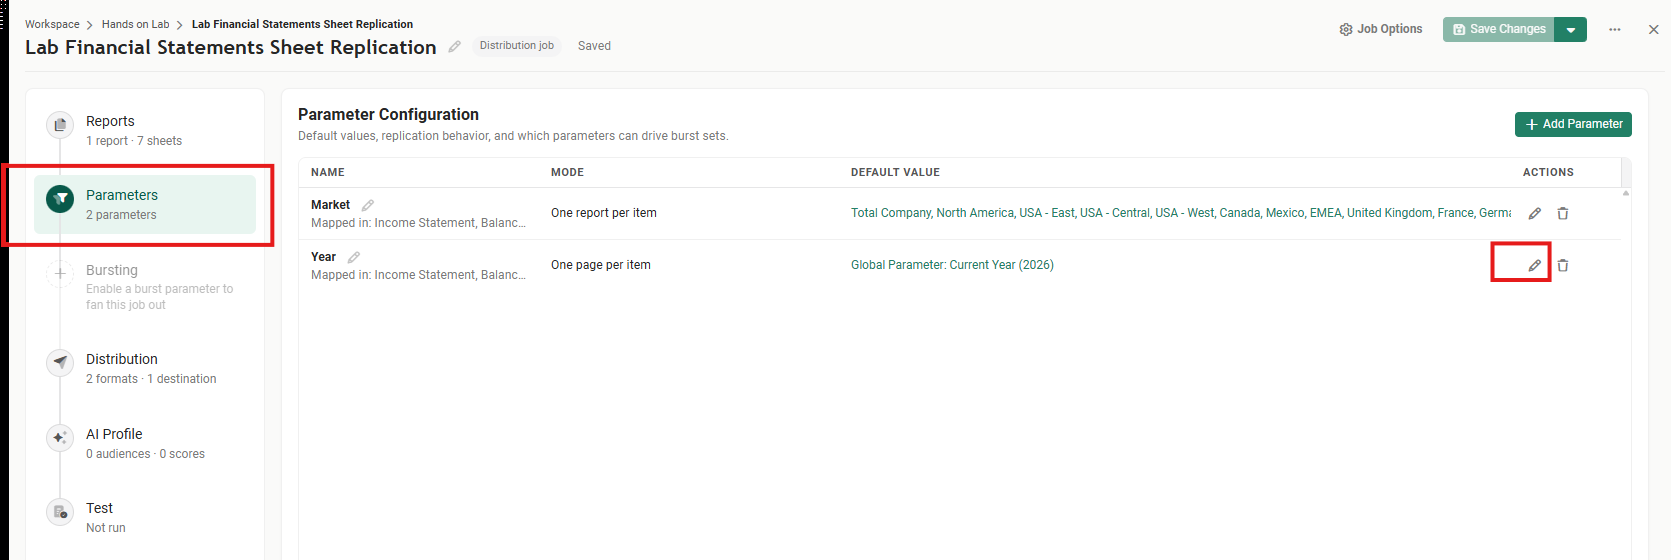
In the panel that opens:
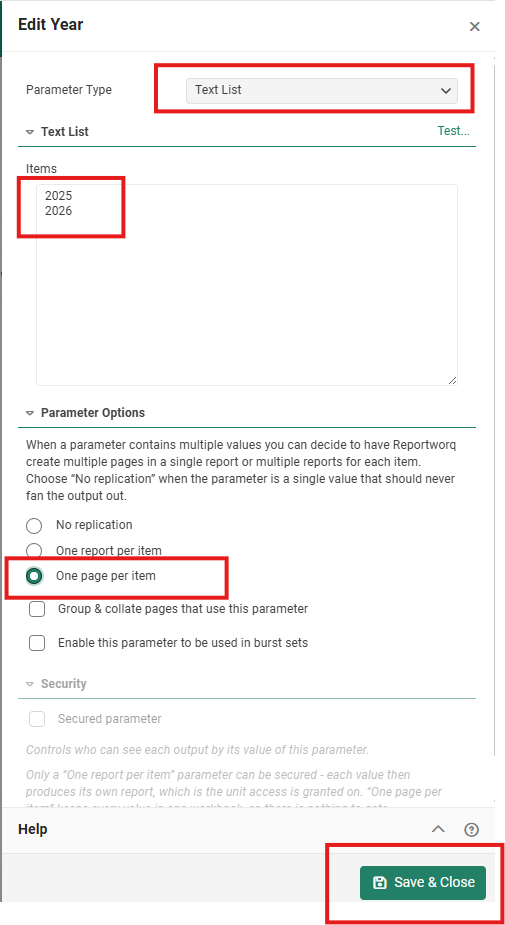
Set Parameter Type to Text List.
Type these into Items, one per line, with no commas:
2025
2026
Under Parameter Options, leave One page per item selected, as you set it in Lab 4. This is the setting that makes the tabs repeat.
Select Save & Close.
You have told Reportworq: here are two years, and I want each one as its own set of pages inside the same file. The workbook holds actual figures for 2022 to 2026, so both years calculate.
The trade-off. In Lab 4, Year came from the Current Year global parameter, so it moved on by itself when the year rolled over. A typed list does not: when the years move on, someone has to edit this list.
Select Save Changes.
7. Take Year out of the file name and the subject#
Select the Distribution step. In Lab 4 the File Name was Year - Market Financial Statements. That worked because Year had one value. A parameter set to One page per item puts all its values into one file, so when you use it in a file name, a subject or a message, it shows all of them, joined with a comma and a space. The Canada file would be called 2025, 2026-Canada Financial Statements.
The rule: keep a One page per item parameter out of the file name and the subject. Select the X on the Year pill in the File Name box, and delete the - after it, so the box holds the Market pill and Financial Statements. Do the same in the email's Subject. Select Save Changes.
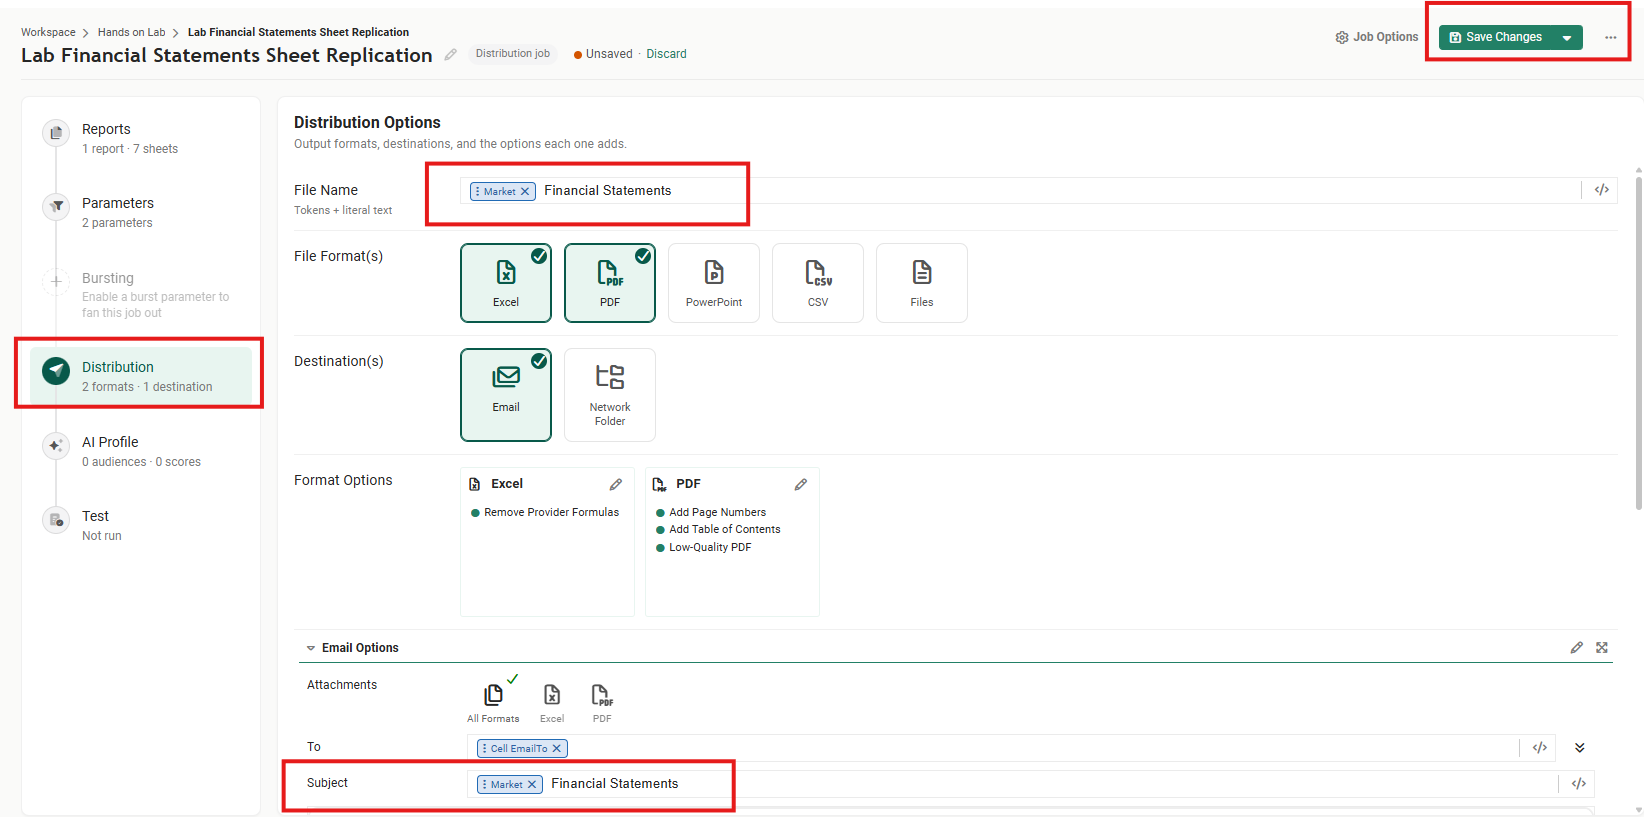
Leave the message alone. It still says Attached is your Year financial statements for Market, and you are going to see what that does.
Part C: What you got#
8. Preview it#
Select the Test step, then Generate Preview.
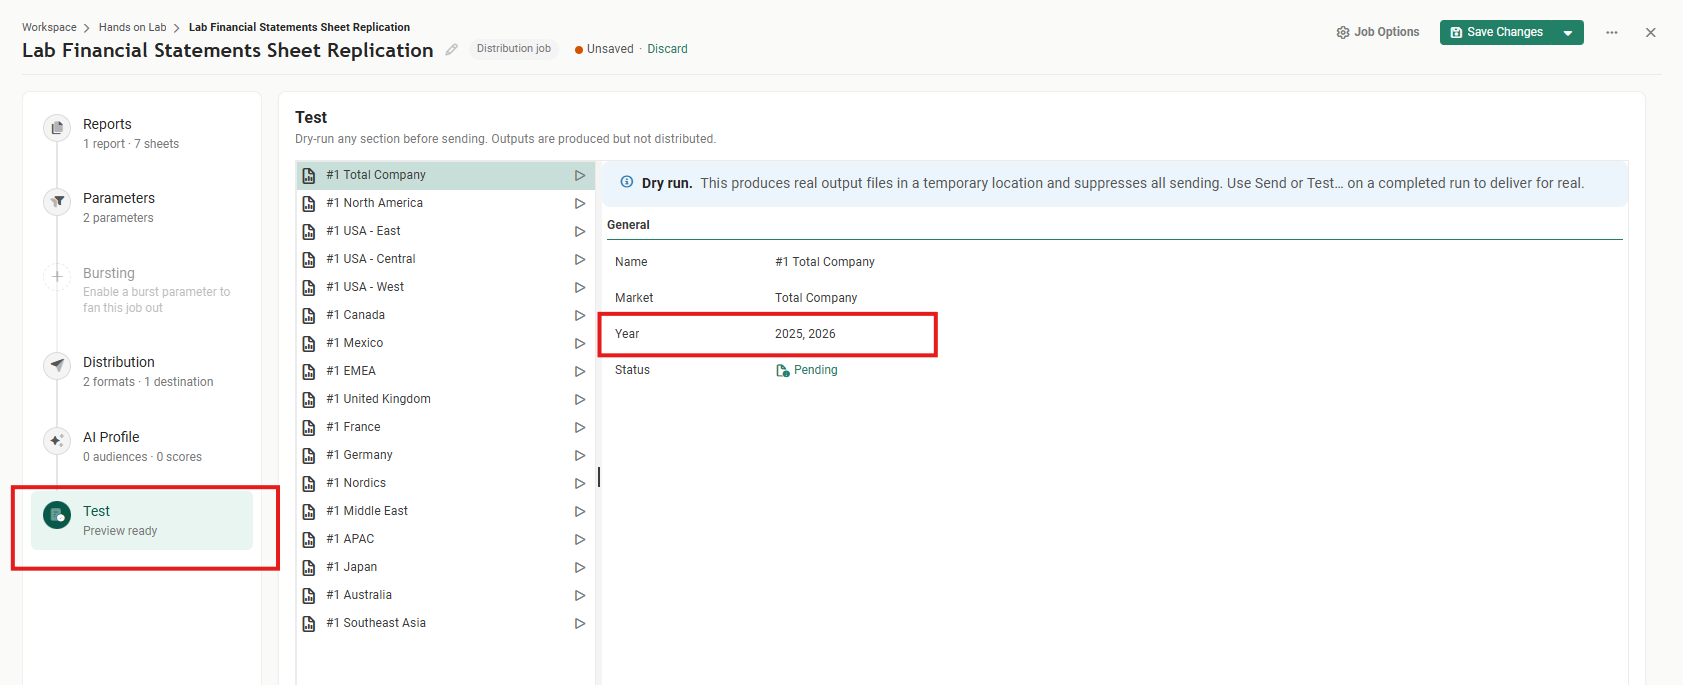
Still seventeen rows, one per market: Market is still One report per item, and adding years to a One page per item parameter adds pages, not files. Select a row, and the General panel shows Year as 2025, 2026: both values, in the same output.
9. Run one and open it#
Select the Run button (the play icon) on the Total Company row. As in Lab 4, this is a dry run: the files are real, and nothing is sent.
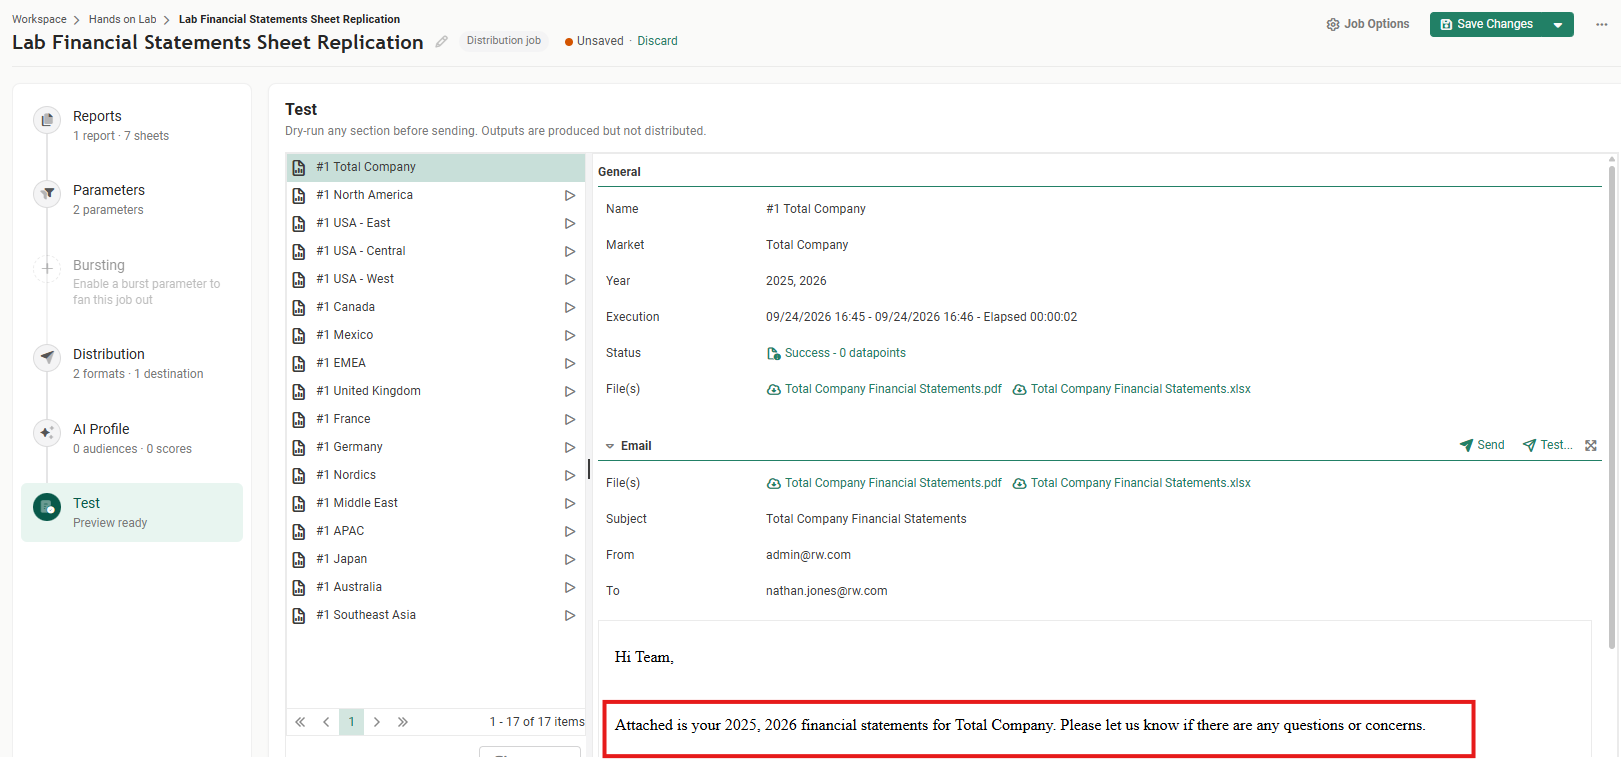
Check three things:
- The files are called
Total Company Financial Statements.pdfandTotal Company Financial Statements.xlsx, with no list of years in the name. - The workbook has six tabs: an Income Statement, a Balance Sheet and a Cash Flow for each year, named
2025 - IS,2026 - ISand so on, each with that year's figures. - The message reads Attached is your 2025, 2026 financial statements for Total Company. That is the same comma-joined list, left there on purpose so you could see it. With two years it reads well enough. With a parameter holding many values it would not, so take it out of the message as well; unlike the file name and the subject, that is a judgment call.
Open the PDF on its table of contents.
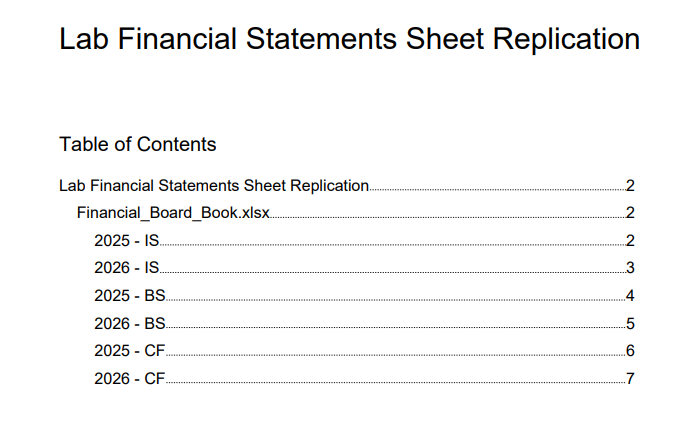
The top two entries are the Level 1 and Level 2 you left blank in step 3: the job's name, then the report's, which is the workbook's file name. Under them come the six sheets, in this order: 2025 - IS, 2026 - IS, 2025 - BS, 2026 - BS, 2025 - CF, 2026 - CF. By default, the copies of each worksheet stay together, in the order the worksheets are listed.
10. Group the pages by year#
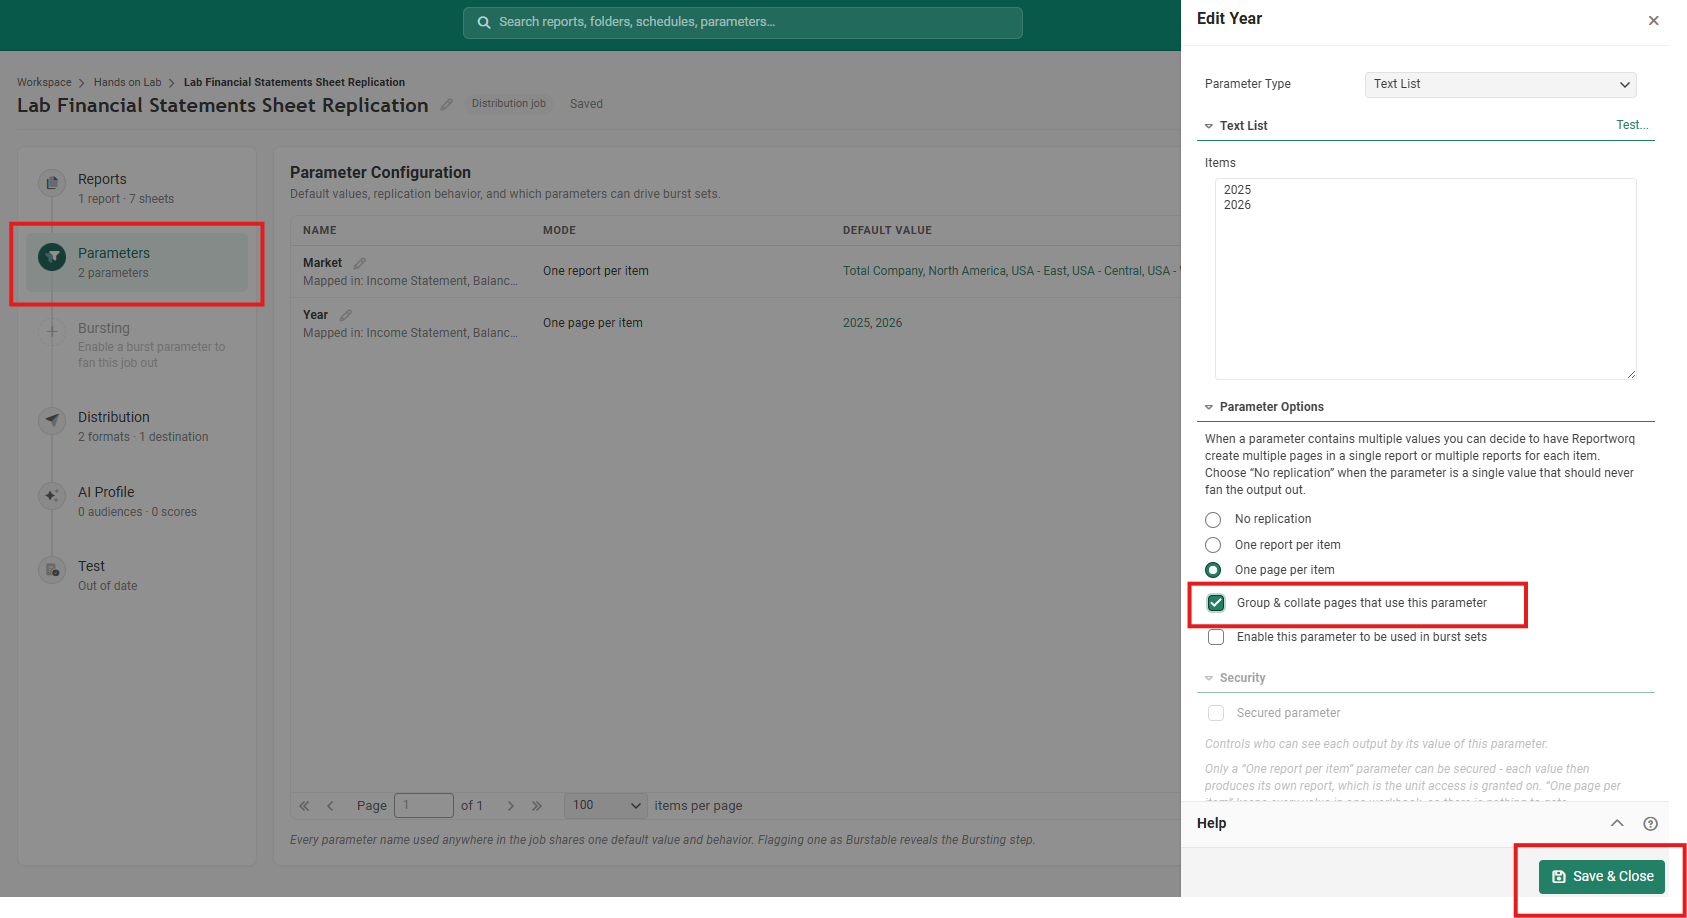
Suppose the board wants the 2025 statements together, then the 2026 statements. Lab 4 described an option on the Parameters step that does exactly that. Go back to Parameters, select the pencil on Year, tick Group & collate pages that use this parameter, and select Save & Close, then Save Changes.
Select the Test step. The preview you generated earlier is still showing, and the editor tells you it is stale in three places: the step reads Out of date under Test, the list ends with * Preview data is out of date., and the Generate button carries a warning icon.
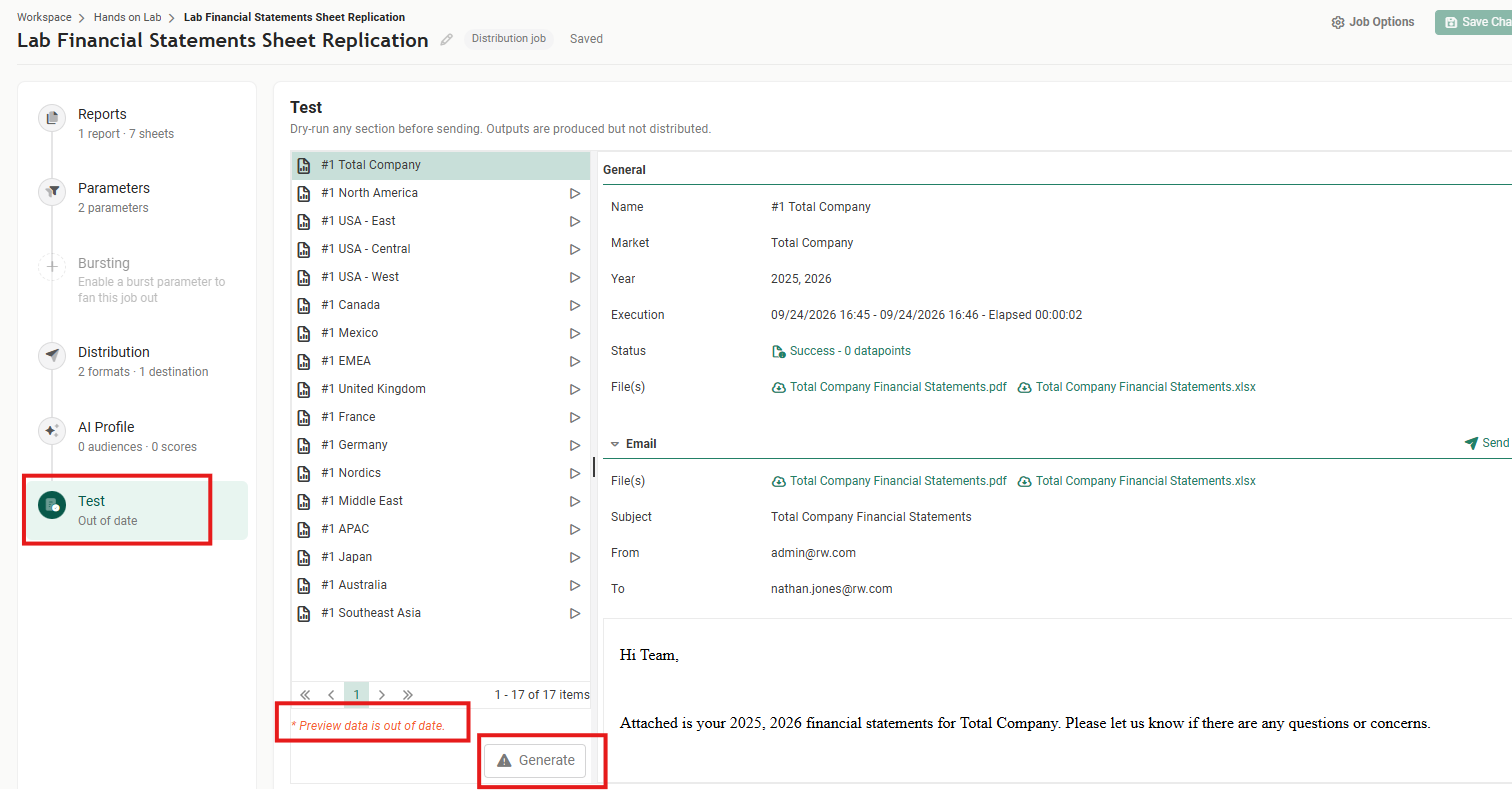
Saved or not? The header beside the report's name reads Saved, or Unsaved with a Discard link, and Save Changes is grayed out when there is nothing left to save. You do not have to save before you test: the preview runs on the job as it is in the editor, so you can try a change in the Test step first and save it only once it does what you want.
Select Generate, run the Total Company row again, and open the new PDF.
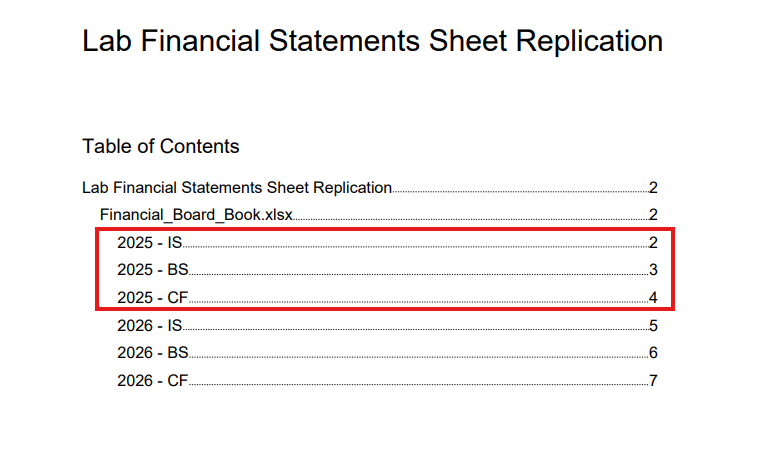
Now the pages are grouped by year: 2025 - IS, 2025 - BS, 2025 - CF, then 2026 - IS, 2026 - BS, 2026 - CF. The Excel file's tabs follow the same order.
The order of the Items list decides which year comes first. Reportworq takes the values in the order you typed them, so 2025 comes first here. Put 2026 first in Items and the 2026 statements lead.
11. Give each year its own heading in the PDF#
The table of contents still has Financial_Board_Book.xlsx, the workbook's file name, as the heading over all six sheets. That is the Level 2 you left blank in step 3. Now that the pages are grouped by year, you can make the year the heading.
Select the Reports step, then Income Statement, and select its Sheet Name row. In Level 2 - PDF bookmark report, type %param:Year% - Financial Statements, or insert Year with the </> button and type - Financial Statements after it. Leave Level 1 and Level 3 as they are, and select Done.
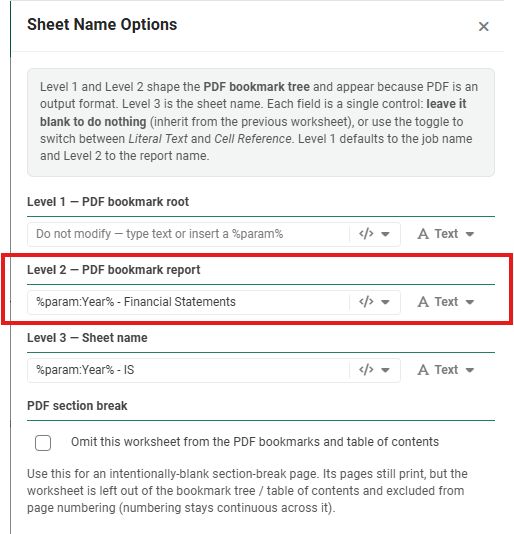
Do the same on the Balance Sheet and the Cash Flow, with the same Level 2 on each. Select Save Changes.
Why set it on all three tabs? A level left blank takes its value from the sheet before it in the output. With Group & collate on, the sheet before each Balance Sheet is the Income Statement for the same year, so setting Level 2 on the Income Statement alone would happen to work. Turn Group & collate off, though, and the first Balance Sheet (2025) comes straight after the 2026 Income Statement, and would be filed under 2026. Setting the level on every tab that repeats gives each copy its own value, whatever the order.
Select the Test step, Generate, run Total Company again, and open the PDF.
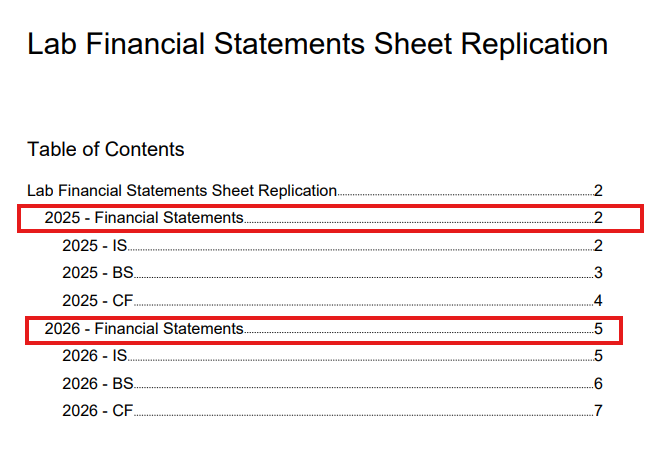
Under the job's name there are now two headings, 2025 - Financial Statements and 2026 - Financial Statements, each over its own three statements. Reportworq starts a new heading whenever the Level 2 value changes from one sheet to the next, and puts consecutive sheets that share a value under one heading. That is why this works best with the pages grouped: without Group & collate, the years alternate, and you would get a new heading for every sheet. Level 2 exists only in the PDF; the Excel file's tabs and contents are unchanged.
Level 1 works the same way one step up: it replaces the job's name at the top of the tree, and a change in its value starts a new top-level entry.
That is the whole lab: one parameter, now doing real work inside each file.
Why it works this way#
A worksheet repeats for the parameters mapped on it, and only those. Reportworq copies the worksheet once per value and writes that copy's value into the cells you mapped. It does not follow the workbook's formulas to work out which tabs depend on a parameter. That is why the Balance Sheet needed its own mappings: without them it would have appeared once, not once per year, however many copies of the Income Statement there were.
One page per item means one file holds every value. So anything that names the file, or the email that carries it, sees the whole list. One report per item is the opposite, one value per file, which is why Market is still safe in the file name and the subject. Knowing which kind of parameter you are putting into a name is most of the work of naming output.
The PDF bookmarks follow the order too. Level 2 and Level 1 start a new heading when their value changes from one sheet to the next, so grouping the pages first is what makes a heading per value possible.
Group & collate changes only the order. It moves the worksheets that use the parameter so that they are grouped by value, in the order of the parameter's list; the pages themselves are the same. Worksheets without the parameter keep their order among themselves, but one that sat between two worksheets that use it moves to after them.
Try this#
- Change which year leads. With Group & collate still on, put
2026above2025in Year's Items, generate, and run Total Company. The 2026 statements now come first. - Add a year. Add
2024to the list. Nine tabs, three per year, and still seventeen files. - See why the names matter. On the Cash Flow, set the sheet name to
CFalone, without the year, and run Total Company. Two tabs cannot share a name, so Reportworq numbers the second one, and the workbook's tabs come out asCFandCF(1), which tells nobody which year is which. The PDF's table of contents is no better: it listsCFtwice. Put%param:Year% - CFback.
Notes and limits#
- Only worksheets with the parameter mapped repeat. A tab without it appears once, whatever the parameter's values. The hidden data tabs in this workbook stay single for exactly that reason.
- A typed list does not follow the calendar. This report no longer uses Current Year, so it shows 2025 and 2026 until someone edits the list.
- Output Order and Group & collate do not mix. Giving any worksheet an Output Order value turns on Enable Manual Collation in Job Options, and while that is on, Group & collate changes nothing. Removing the Output Order does not turn it off again; untick it in Job Options.
- Keep sheet names short. Excel's 31-character limit applies to every copy. A name built from a value that can be long needs counting against the longest value, as in Lab 4.
- Nothing was sent. As in Lab 4, the Test step's dry run suppresses all sending.
Going deeper. For the replication modes and Group & collate, see the parameters reference. For the sheet name and the three PDF bookmark levels, see Worksheet output options. For how parameter values appear in file names and subjects, see Name and organize output.
Next#
Lab 6: Burst sets, and parameters that are not on a worksheet. Next you turn a parameter on for burst sets, which switches on the Bursting step you have left grayed out since Lab 4, and take finer control of how parameter values combine. Then you use a parameter only for reference in the email, not written into any tab.
Feedback on this page
Comments, questions, requests, or something missing or unclear? Email us - the page you are on is filled in for you.
Email feedback on this pageOr write to support@reportworq.com directly.