
Compare performance across reports#
A report's own Run History answers "is this report slower than it used to be". It cannot answer the two questions an administrator asks when several things feel slow at once:
- Did a release regress us? Something changed after an upgrade, but no single report proves it.
- Is a node slower? One machine in a cluster is doing worse work than the others, and no report's own history can see across machines.
The Distribution tab of Settings ▸ Performance answers both. It reads the same run measurements the per-report surfaces read, but scoped across every report instead of within one.
Settings ▸ Performance has two tabs. Distribution, described on this page, covers report and job execution. Contribution is the live monitor for contribution worker processes and sessions, described in Contribution processes. The two are separate surfaces on one screen; nothing on this page applies to the Contribution tab.
When to use it. After an upgrade, when several users report slowness in the same week, when a cluster node is suspected, or as a periodic check on which reports are drifting.
Before you start#
- You need the Administrator entitlement. The page is part of Settings, which is administrator-only and is not offered on a load-balancer node.
- The page reads run history. Only runs executed on a build that records performance telemetry carry measurements, so an instance that has just upgraded will have a thin page until new runs accumulate. See Review a run's performance for what a run records.
Open the page and choose a window#
- Open Settings.
- Select the Performance card. Its description reads "Distribution and contribution: which reports are slowing down, whether a release or a node regressed you, and live contribution workers and sessions."
- The page opens on the Distribution tab. The breadcrumb reads Settings › Performance › Distribution, and the address bar ends in
/distribution, so the tab you are on is part of the link you can share or bookmark. - Choose the window: 30 days (the default), 90 days, or 1 year. Everything on the page, including the baselines, is recomputed inside the window you choose, so a delta on screen is always explained by runs you can see.
- Select Refresh to re-read run history. Runs written by an out-of-process job runner reach the web application as a notification, and Refresh is what you use if a run you expect is not there yet.
- Select Close to return to Settings.
The window selector and Refresh belong to the Distribution tab and are absent while the Contribution tab is showing; that tab carries its own auto-refresh switch and its own Refresh.
If nothing has run in the window, the page says "No runs in this window." and suggests widening the window or checking that job-history logging is on.
Read the five figures#
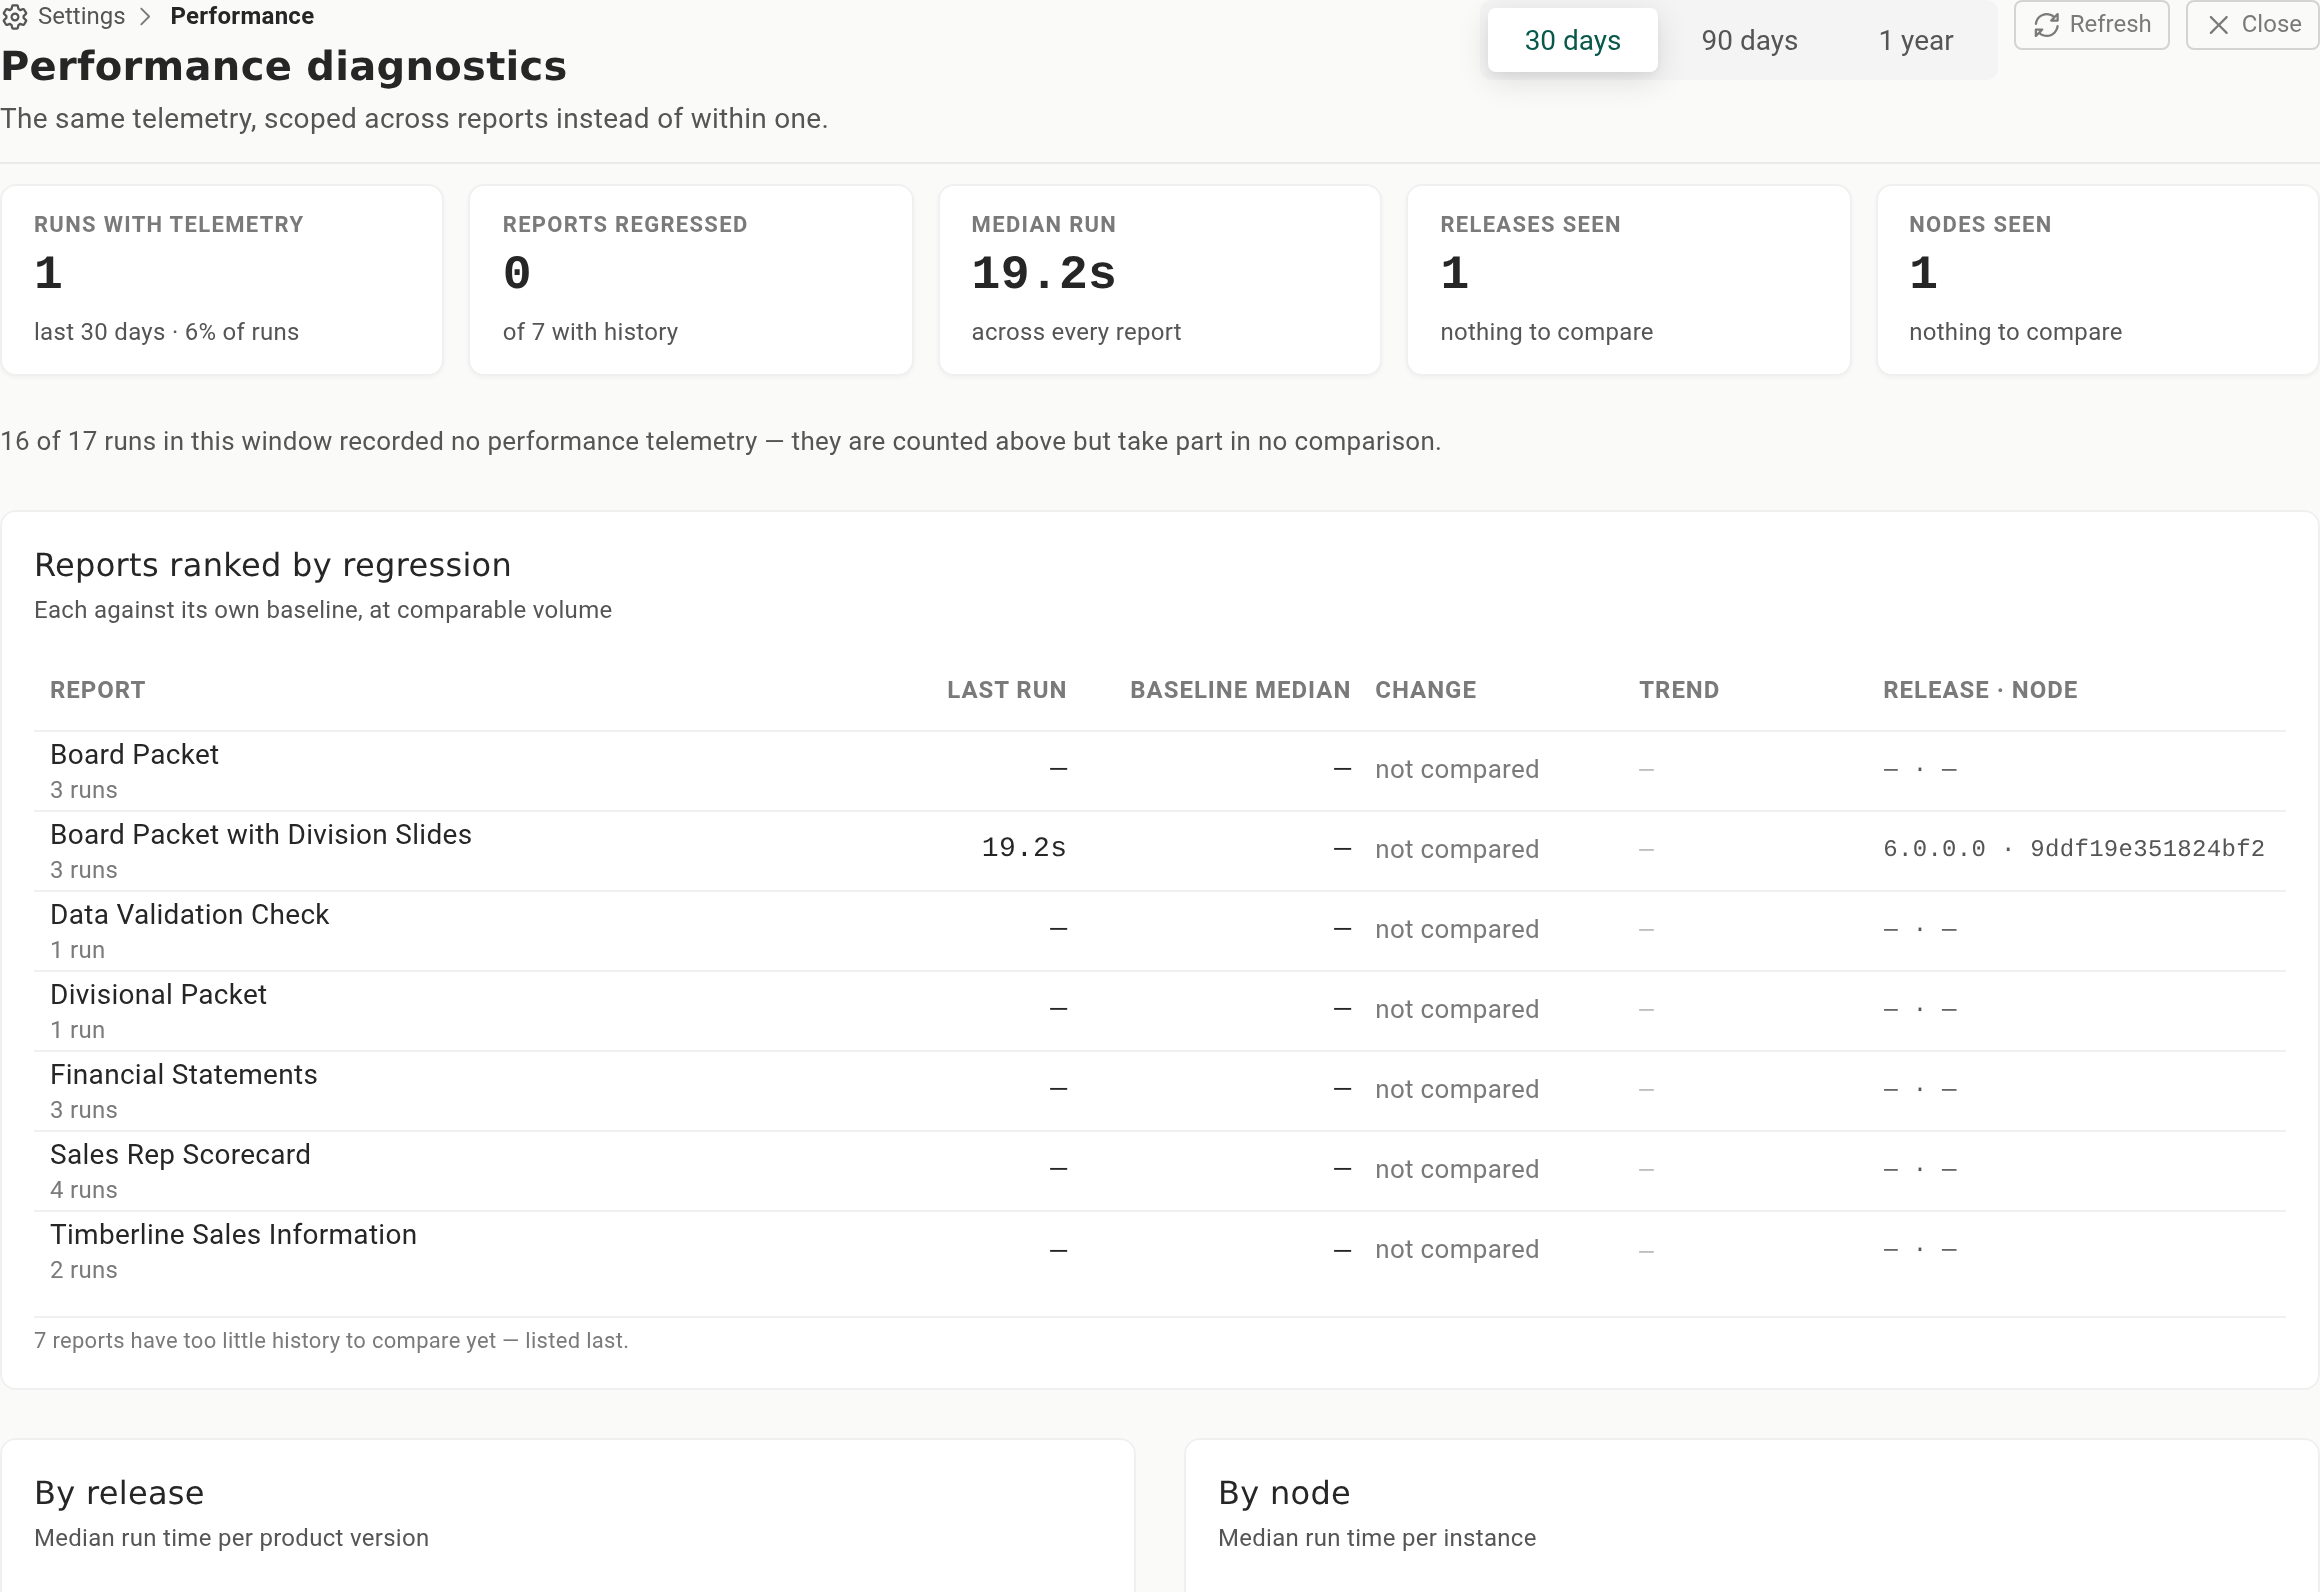
| Figure | How to read it |
|---|---|
| Runs with telemetry | How many runs in the window carried a measurement, with the window length and the percentage of all runs beneath it. A low percentage means most of this window predates telemetry, and the page below is thinner than it looks. |
| Reports regressed | How many reports are more than 15 percent above their own baseline, out of every report with run history in the window. |
| Median run | The middle run duration across every report. It is taken over successful runs only, so a batch of early failures cannot make the instance look faster than it is. |
| Releases seen | How many distinct product versions ran in the window. One release is "nothing to compare". |
| Nodes seen | How many distinct instances ran in the window. One node is "nothing to compare". |
Where some runs in the window recorded nothing, a line under the figures says how many. Those runs are counted in the totals but take part in no comparison.
Read the report ranking#
Reports ranked by regression lists reports worst first, each measured against its own baseline at comparable volume.
| Column | What it shows |
|---|---|
| Report | The report name, with how many runs it had in the window. |
| Last run | The elapsed time of its most recent run in the window. |
| Baseline median | The median of that run's comparable predecessors. |
| Change | The difference between the two, as an up or down indicator. Where no fair comparison is possible the cell reads "not compared" and the reason is in its tooltip. |
| Trend | The report's run times in the window as a small chart. A run with no measurement breaks the line rather than dropping it to zero. |
| Release, node | The product version and the instance name of the most recent run. On a single-server installation the instance name is the server's own generated instance id, so the useful reading here is "did this change", not the name itself. |
The baseline rules are the same ones the per-report run list uses: the median of up to 12 comparable earlier runs, at least 3 of them before any comparison is offered, a 15 percent dead band, a run is never in its own baseline, and failed, canceled, and unmeasured runs are held out. They are described in full in Review a run's performance.
Reports that cannot be compared are listed last rather than dropped, and a note under the table says how many. "We could not compare this" is information too.
Read the release and node pivots#
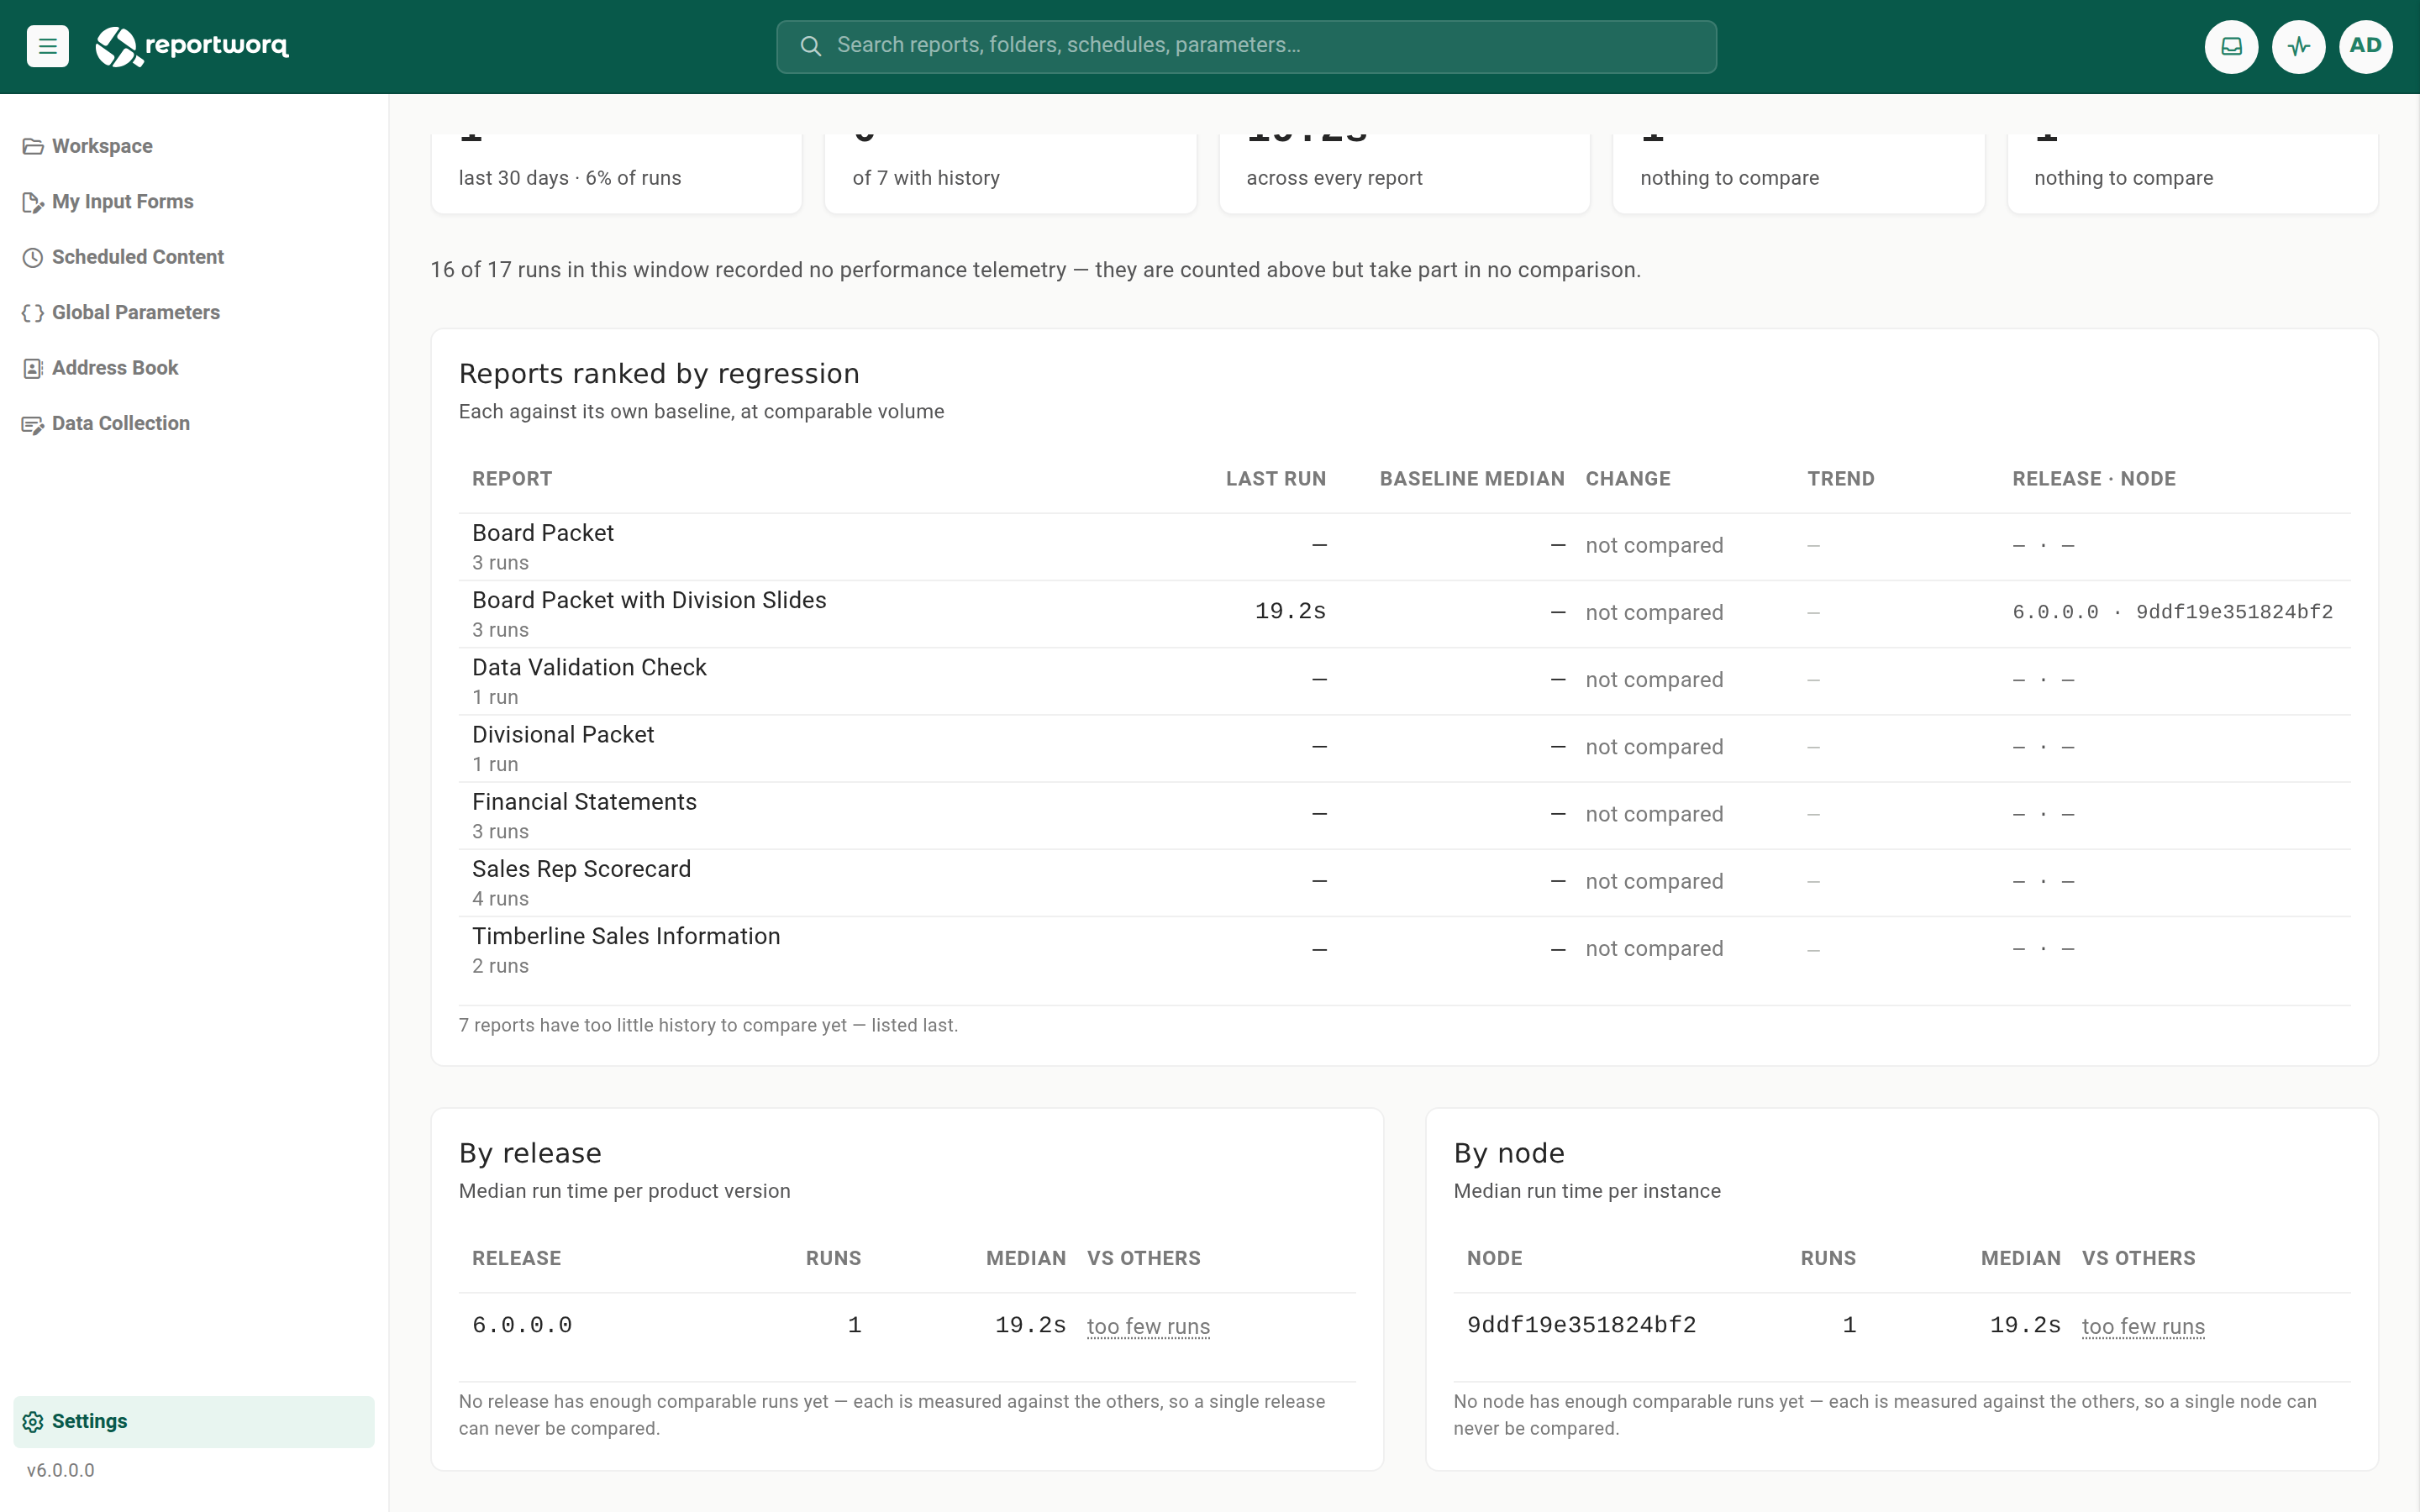
Two tables sit side by side at the foot of the page: By release (median run time per product version) and By node (median run time per instance). Both have the same columns. On a narrow browser window the two tables scroll sideways inside their own panels rather than pushing the page wider, so the last column may need a sideways scroll to reach.
| Column | What it shows |
|---|---|
| Release or Node | The product version, or the instance name. |
| Runs | How many comparable runs the group contributed. |
| Median | The group's median run duration. |
| vs others | How the group compares to every run outside it. |
| Peak memory | The highest working set any run in the group reached. |
Three rules govern these pivots, and they are why a cell sometimes refuses to give you a number.
- A group is compared against the other groups, never against the overall median. A node that runs most of the work would drag an overall median toward itself and look normal no matter how slow it was.
- A group needs at least 3 runs before it is compared, and the cell reads "too few runs" below that. There also has to be something to compare it with: a single release or a single node can never be compared, and the note under the table says so rather than leaving a blank cell unexplained.
- Volume has to match. If a group processed more than 15 percent more or less data than the others, the cell reads "different volume" and no verdict is given. A release that looks 40 percent slower because its runs happened to carry three times the data is not a regression, and reporting it as one would make every other row untrustworthy.
Only successful runs take part. A run that failed or was canceled has a real duration and no meaning, and letting it into a median turns a crash-heavy node into a fast one.
Notes and limits#
- The report table has no paging and no row cap. It lists every report with a run in the window. On a large installation that table is long, and narrowing the window is the only way to shorten it.
- Runs, not reports, define the list. A report that has been deleted still has run history, so it can appear here. That is deliberate: the page exists to explain runs that already happened.
- It reads only the summary carried on each run's history entry. No execution database and no performance artifact is opened, which is what makes the page usable on an instance with thousands of runs. The cost of that choice is that nothing below whole-run totals is available here. For a breakdown by output, workbook, phase, or calculation engine, open the run itself, see Review a run's performance.
- This is not alerting. There are no thresholds to set and no notifications. The window selector and Refresh are the only controls on this tab.
- Performance data ages out with the run. It is stored with the run and is removed when retention removes the run, see Output retention.
Going deeper. For the section this page belongs to, including how to size a deployment and the levers worth pulling once you have found the problem, start at Performance and capacity planning. To break a single run down until the cost is attributable to a phase or an engine, see Review a run's performance. To find the point in a report's history where its behavior changed, see Find when a report got slower. For the other tab on this screen, see Contribution processes. For collecting logs for the support desk, see Log diagnostics and support packets.
Feedback on this page
Comments, questions, requests, or something missing or unclear? Email us - the page you are on is filled in for you.
Email feedback on this pageOr write to support@reportworq.com directly.