
Find when a report got slower#
The Elapsed vs baseline column in Run History tells you whether the latest run was normal. That is the wrong question for a report that has been drifting for a fortnight, because every individual run looked fine against a baseline that was itself creeping upward.
The Compare tab asks the other question: across this report's whole history, is there a point where its typical run time changed, and when was it? It is not a comparison of two runs you pick. It searches for a single step, and it either finds one or says plainly that there is not one.
When to use it. When a report feels slower but no single run is flagged, when you want to line a slowdown up against an upgrade or a data-model change, or when you want to know whether one output of a large burst has drifted while the rest have not.
Before you start#
- Open the report's Run History: in the workspace browser, open the report row's ... menu and select Run history. See Track activity and run history.
- The tab sits behind View diagnostics, which a view-only User account does not have. Authors and administrators reach it.
- The search needs at least six comparable runs, three on each side of the point it is testing. A report with fewer says so rather than guessing.
Open the Compare tab#
- In Run History, select the run you want to start from.
- Select View diagnostics.
- Select Compare. The tab is present on every run, alongside Diagnostics and Performance. AI diagnostics appears next to them only for a run that failed or completed with warnings.
Which run you started from does not change the answer. The tab looks at the report's whole history, not at that one run.
Read the verdict#
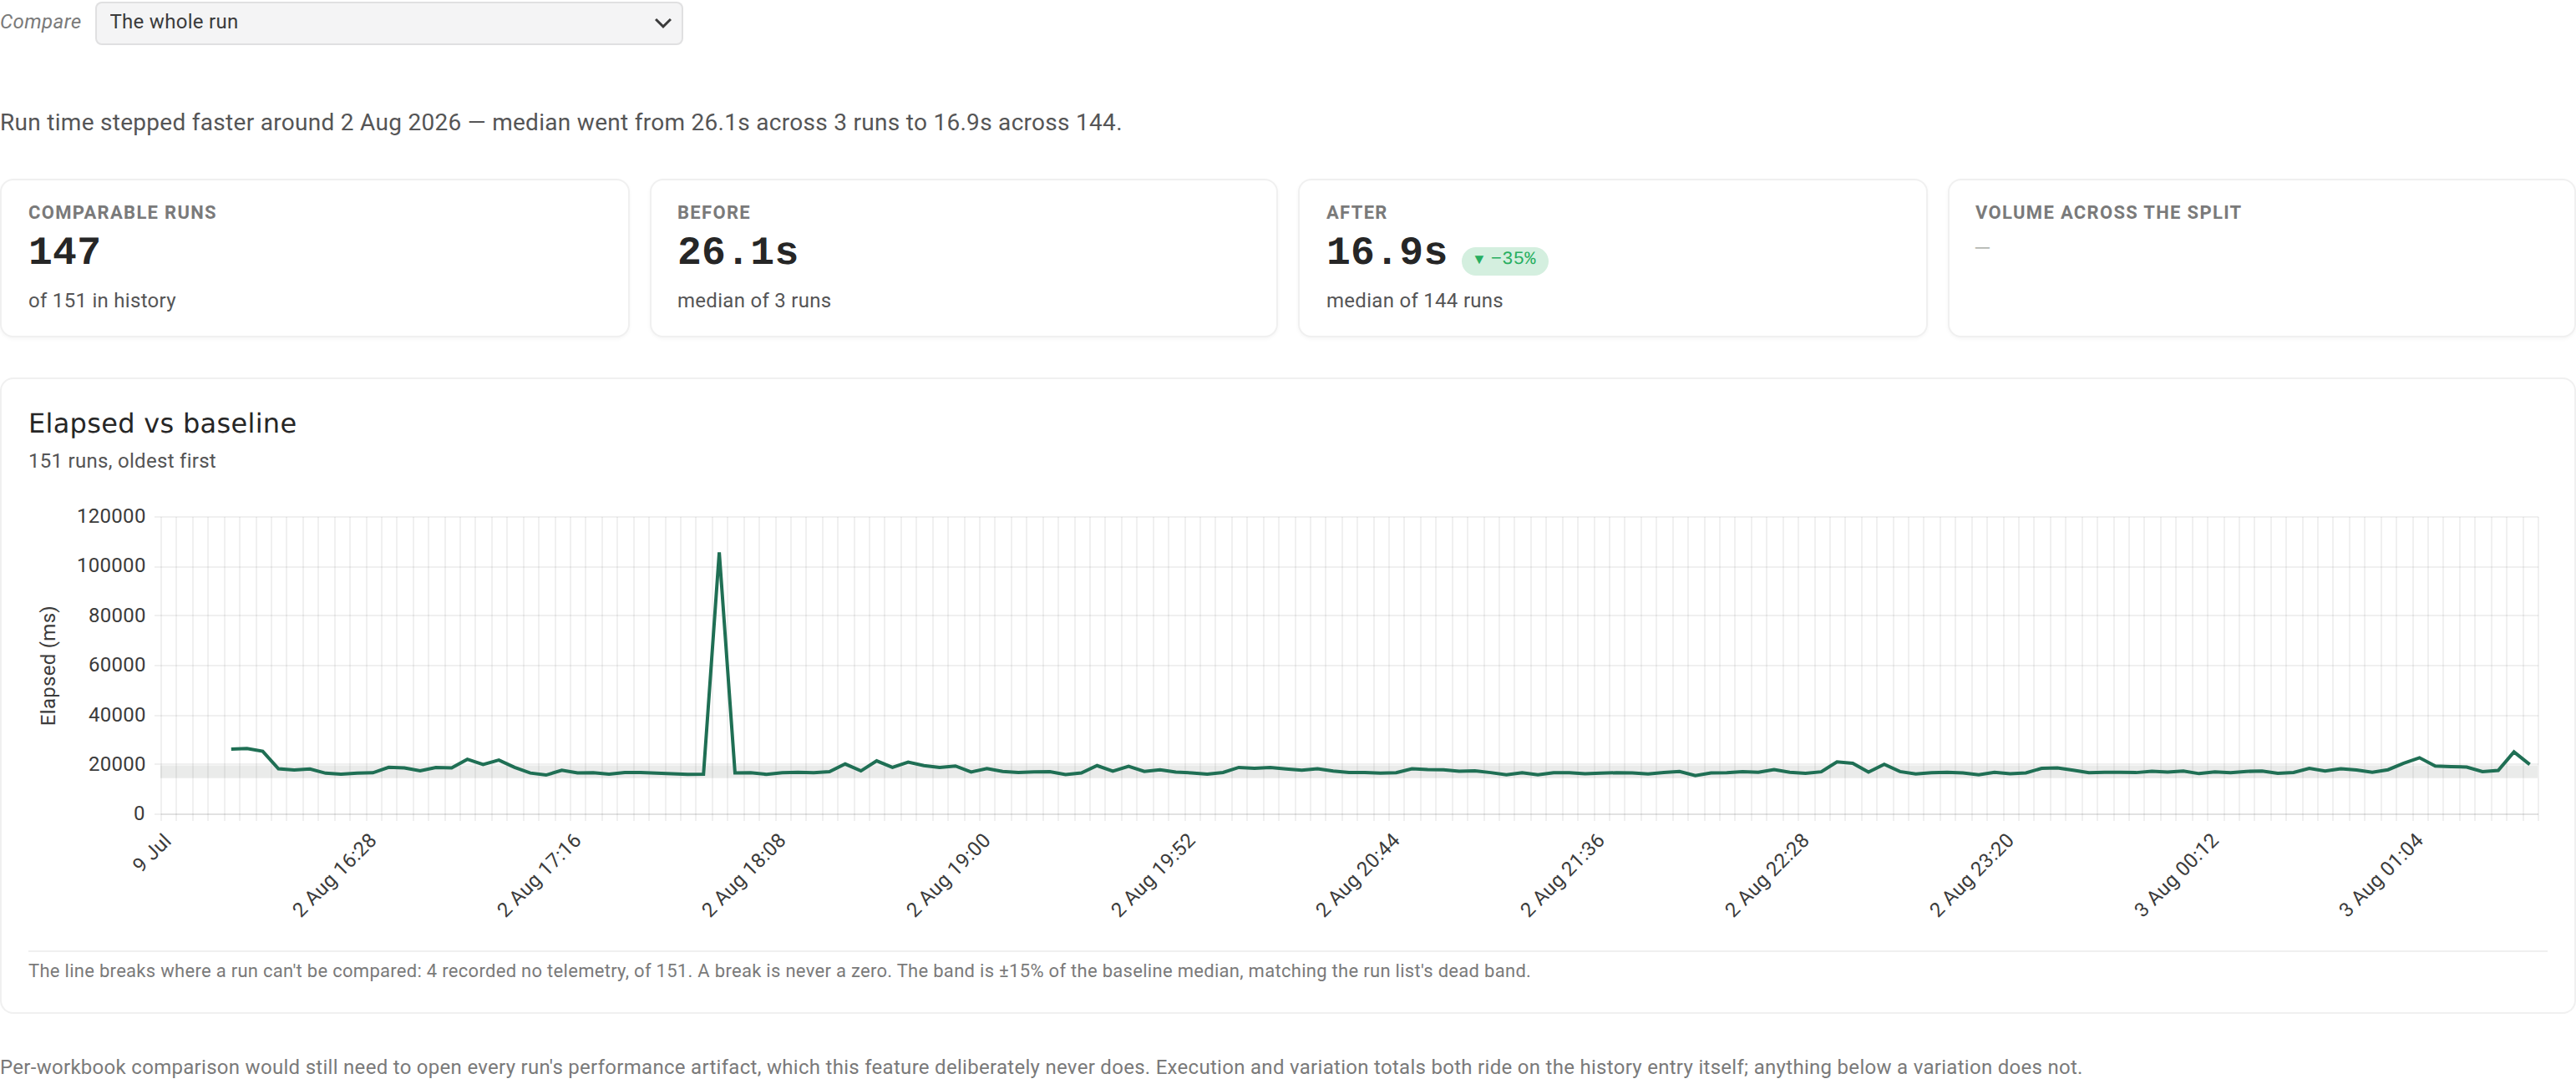
The tab leads with one sentence. It is the whole answer, and everything below it is the evidence.
Where a step is found, the sentence names the direction, the approximate date, and the medians on each side, for example that run time stepped slower around a given date and the median went from one figure across a number of runs to another figure across the rest. It then adds what the data can honestly say about the cause:
- Volume. If data volume moved by more than 15 percent across the same split, the sentence says so, because "it got slower" and "it got bigger" are different findings. If volume barely moved, it says that too, which is the stronger result: the report is not simply doing more work.
- Release. If the product version differs on either side of the point, the sentence names the change.
- Node. If the runs moved to a different execution instance, the sentence names that too.
A cause is named only when the data actually shows one. Where the runs on one side disagree with each other, nothing is named rather than a majority being presented as a fact.
Where no step is found, the sentence says the run time has stayed within its usual range across the whole window. That is a finding, not a failure.
Read the figures and the chart#
Four figures sit under the verdict.
| Figure | How to read it |
|---|---|
| Comparable runs | How many runs could take part, out of the runs in history. Failed, canceled, and unmeasured runs are excluded. |
| Before | The median run time on the earlier side of the step, and how many runs that is. |
| After | The median on the later side, with the change against Before beside it, and how many runs it covers. |
| Volume across the split | How far data volume moved between the two sides, as a percentage of data points. |
Where there is no step, Before and After report why instead of showing a value, and they distinguish the two reasons carefully: "there was not enough history to look" is a gap, "we looked and there was no step" is a finding, and mistaking one for the other would send you looking in the wrong place.
Below the figures, the Elapsed vs baseline chart plots every run oldest first, with a band drawn at 15 percent either side of the median. That band is the same dead band the run list uses, so a point inside it is a run nobody would have flagged.
The note under the chart explains every gap in the line. Runs that recorded no measurement and runs that failed or were canceled are counted separately, because they are different facts. A break in the line is never a zero.
Narrow the search to one variation#
A job that bursts produces several outputs from one run. Its total moves for reasons that have nothing to do with any one of them: a burst list grew, a run was restricted to a single recipient to test a fix, a region was retired. Every one of those makes whole-run totals incomparable while leaving each surviving output perfectly comparable with its own past.
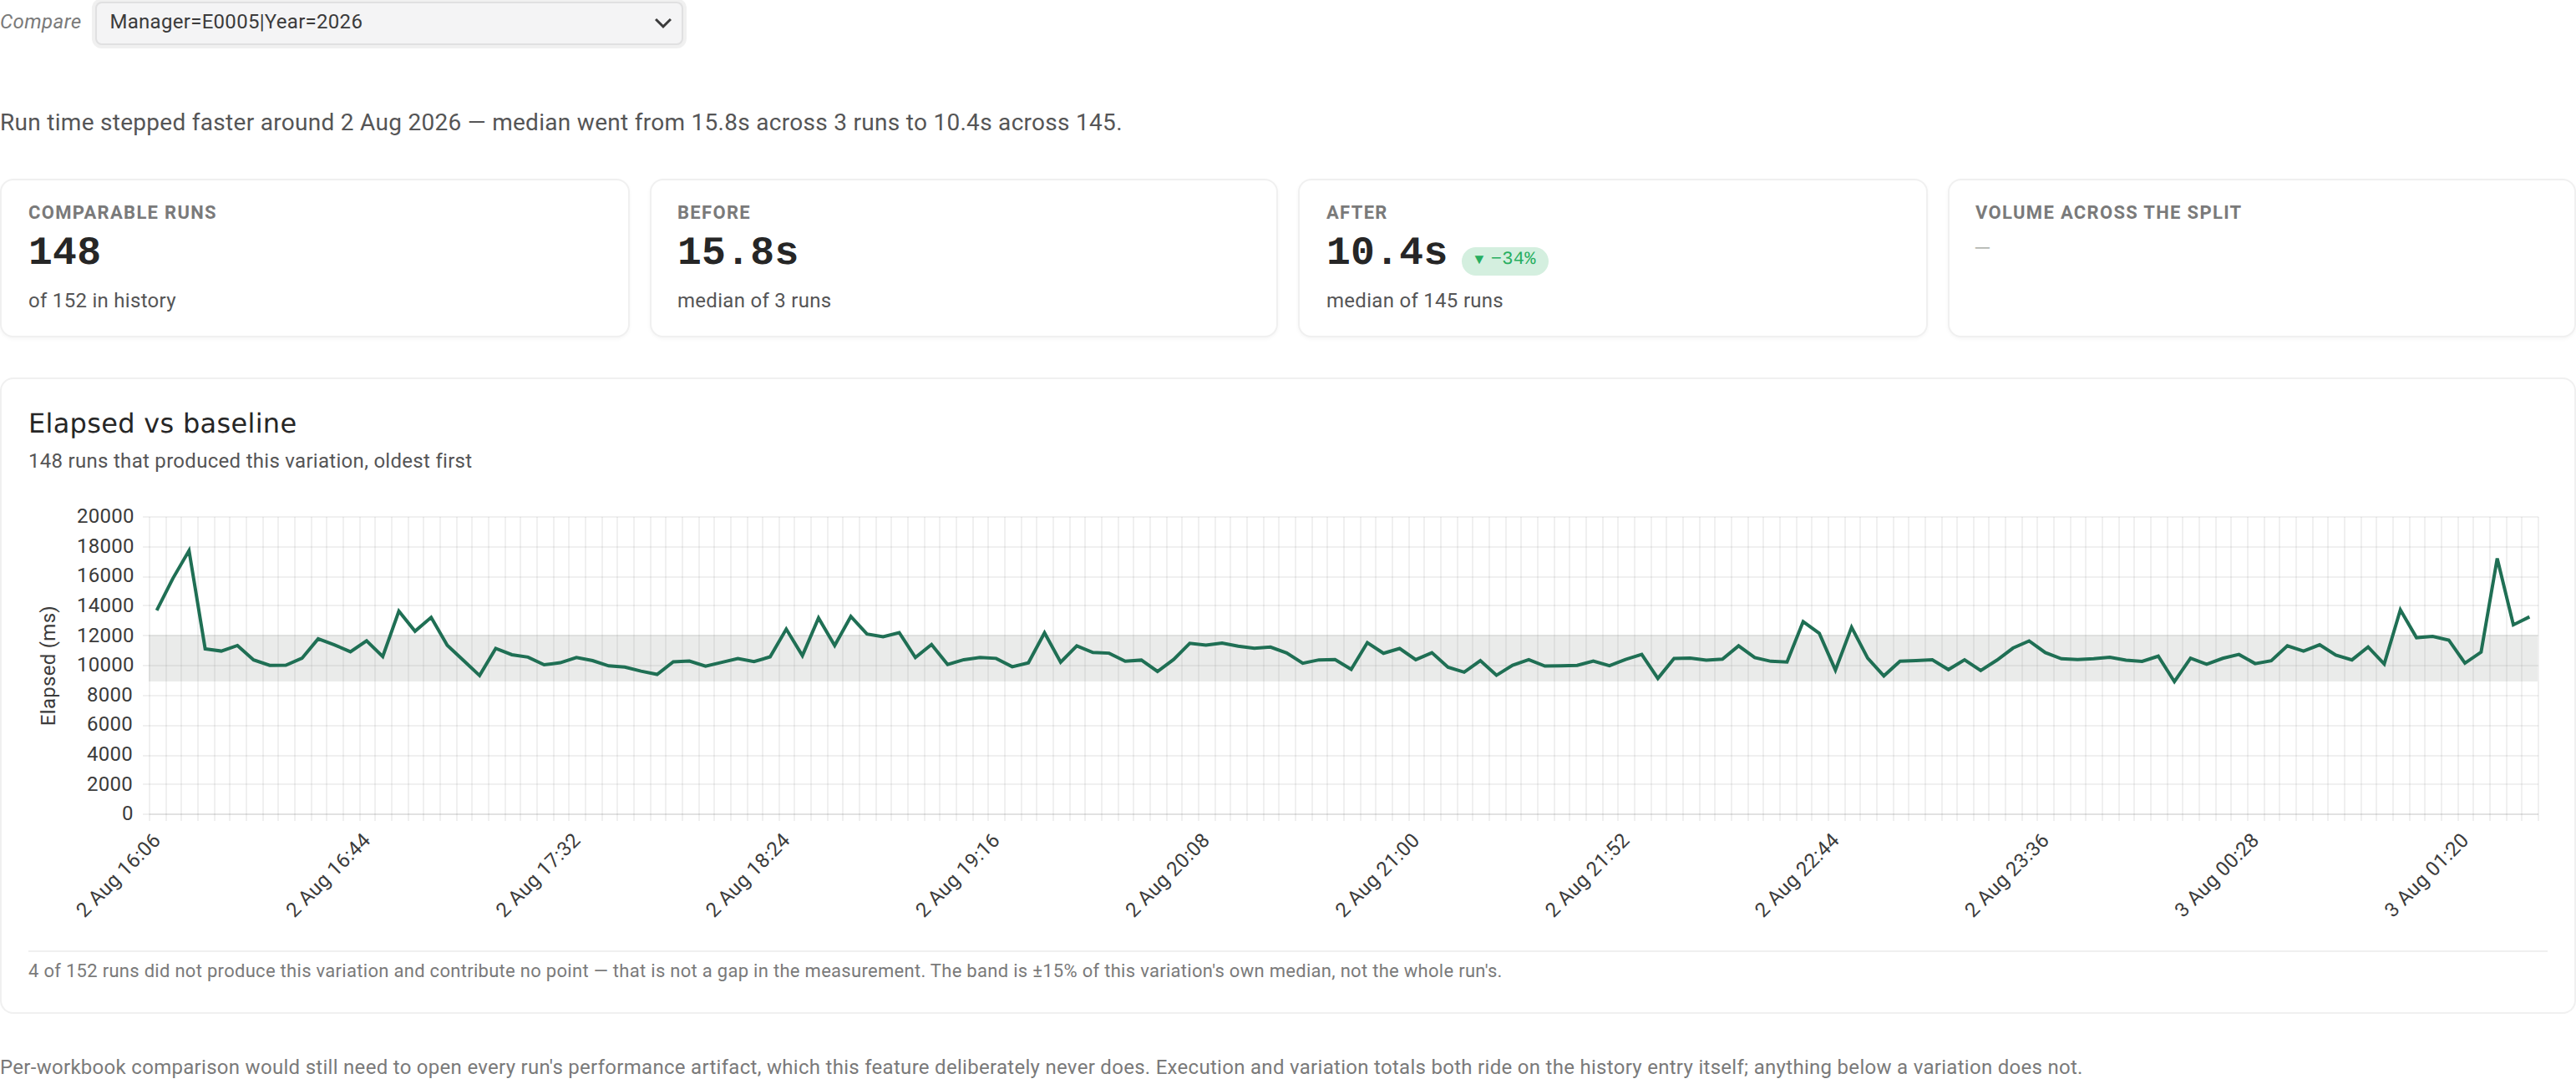
The Compare picker at the top of the tab switches the scope.
- Leave it on The whole run to search the report's total run time.
- Or select one variation to search only that variation's history. Each entry is one output identity, labeled as it was on the most recent run that produced it.
A variation is what the job author declared as varying: a parameter supplied per entry by a burst set, or a parameter set to one report per item. It is deliberately not what the data happened to produce, so a weekly report stays the same report every week even when the query behind it returns ten items in January and twenty in June. A parameter set to one page per item shapes worksheets rather than outputs and is not part of the identity, and neither is the recipient, so re-pointing a burst at a different mailbox does not start a new history.
At variation scope, three things change:
- The chart shows only the runs that produced this variation. A run that did not produce it contributes no point at all, because the report simply was not asked for that night. The note under the chart says how many runs are absent for that reason, so a twelve-point line under a report with forty runs does not read as missing telemetry.
- The band is drawn around this variation's own median, not the whole run's.
- Release and node are not named. One variation's history spans executions that may disagree about which node ran them, and naming one would be a coin flip presented as a fact.
Where a single run produced several outputs sharing one identity, their cost is added together into that run's point, and the note says so. Without that, a job whose burst grew from one output to fifty would look like a catastrophic slowdown.
Two notes appear beside the picker when they apply:
- The job declares no varying parameter, so every output shares one identity. Trending it is trending the whole job, not one report inside it.
- The variation has been seen in one run only, so there is nothing to trend yet.
Notes and limits#
- The picker only appears when there is something to pick. Variation identity is recorded on runs executed from this release onward, so a report whose runs all predate it has none. In that case the tab compares whole runs and says so under the chart, rather than offering an empty list that would read as "this report has no variations".
- A step needs to be worth naming. The two sides must differ by at least 20 percent, with at least 3 runs on each side. Below either threshold nothing is reported, deliberately: with less than that, one unusual run wears a confident label.
- Only one step is reported, the single most significant one. The tab does not enumerate every wobble in a history.
- Failed, canceled, and unmeasured runs never take part. A job that died after 30 milliseconds has a real number and no meaning, and letting it in would either invent a step change or hide one.
- There is no level below a variation here. A per-workbook comparison would mean opening every run's performance artifact, which this tab deliberately never does. For a breakdown by output, workbook, phase, or engine, use the Performance tab on one run, see Review a run's performance.
- Comparison ages out with the runs. History that retention has removed cannot be compared, see Output retention.
Going deeper. To break one run down until the cost is attributable to a phase or a calculation engine, see Review a run's performance. To ask the same question across every report at once, and to pivot by release or by node, see Compare performance across reports.
Feedback on this page
Comments, questions, requests, or something missing or unclear? Email us - the page you are on is filled in for you.
Email feedback on this pageOr write to support@reportworq.com directly.