
Review a run's performance#
Every run measures itself: how long it took, how much memory and CPU it used, and which formula families and calculation services accounted for the time. Nothing has to be turned on, and no setting controls it. Four places read that measurement, and this page covers the first two:
- Run History compares each run against the same report's own recent runs, so a slowdown is visible in the list.
- The Performance tab on a run's diagnostics breaks one run down until the cost is attributable to a specific output, workbook, processing phase, or calculation engine.
- The Compare tab searches the report's whole history for the point where its typical run time changed, see Find when a report got slower.
- Settings ▸ Performance ranks every report against its own baseline and pivots the instance by release and by node, see Compare performance across reports.
When to use it. When a pack that used to finish in three minutes now takes twenty, when you need to know which workbook in a large burst is the expensive one, or when you suspect a formula is being recalculated far more often than it needs to be. Also for capacity planning: peak memory and maximum CPU per run tell you what an execution host has to hold.
Before you start#
- Open the report's Run History: in the workspace browser, open the report row's ... menu and select Run history. See Track activity and run history.
- The three performance columns are visible to anyone who can see the run list. The Performance tab is not: it sits behind View diagnostics, which a view-only User account does not have. Authors and administrators reach it.
- Only runs executed on a build that records performance telemetry carry the data. Earlier runs say so rather than reporting zero.
Compare a run against its own history#
The run list carries three performance columns.
| Column | What it shows |
|---|---|
| Elapsed vs baseline | How long the run took, with a change indicator beside it. The indicator's tooltip names the comparison, for example a baseline of 3m 40s taken as the median of the previous 12 comparable runs. |
| Trend | A small chart of the report's recent elapsed times with the baseline drawn in, so a step change reads as a shape rather than as a number. A run with no telemetry breaks the line instead of dropping it to zero. |
| Peak mem | The highest working set the run reached, in MB or GB. |
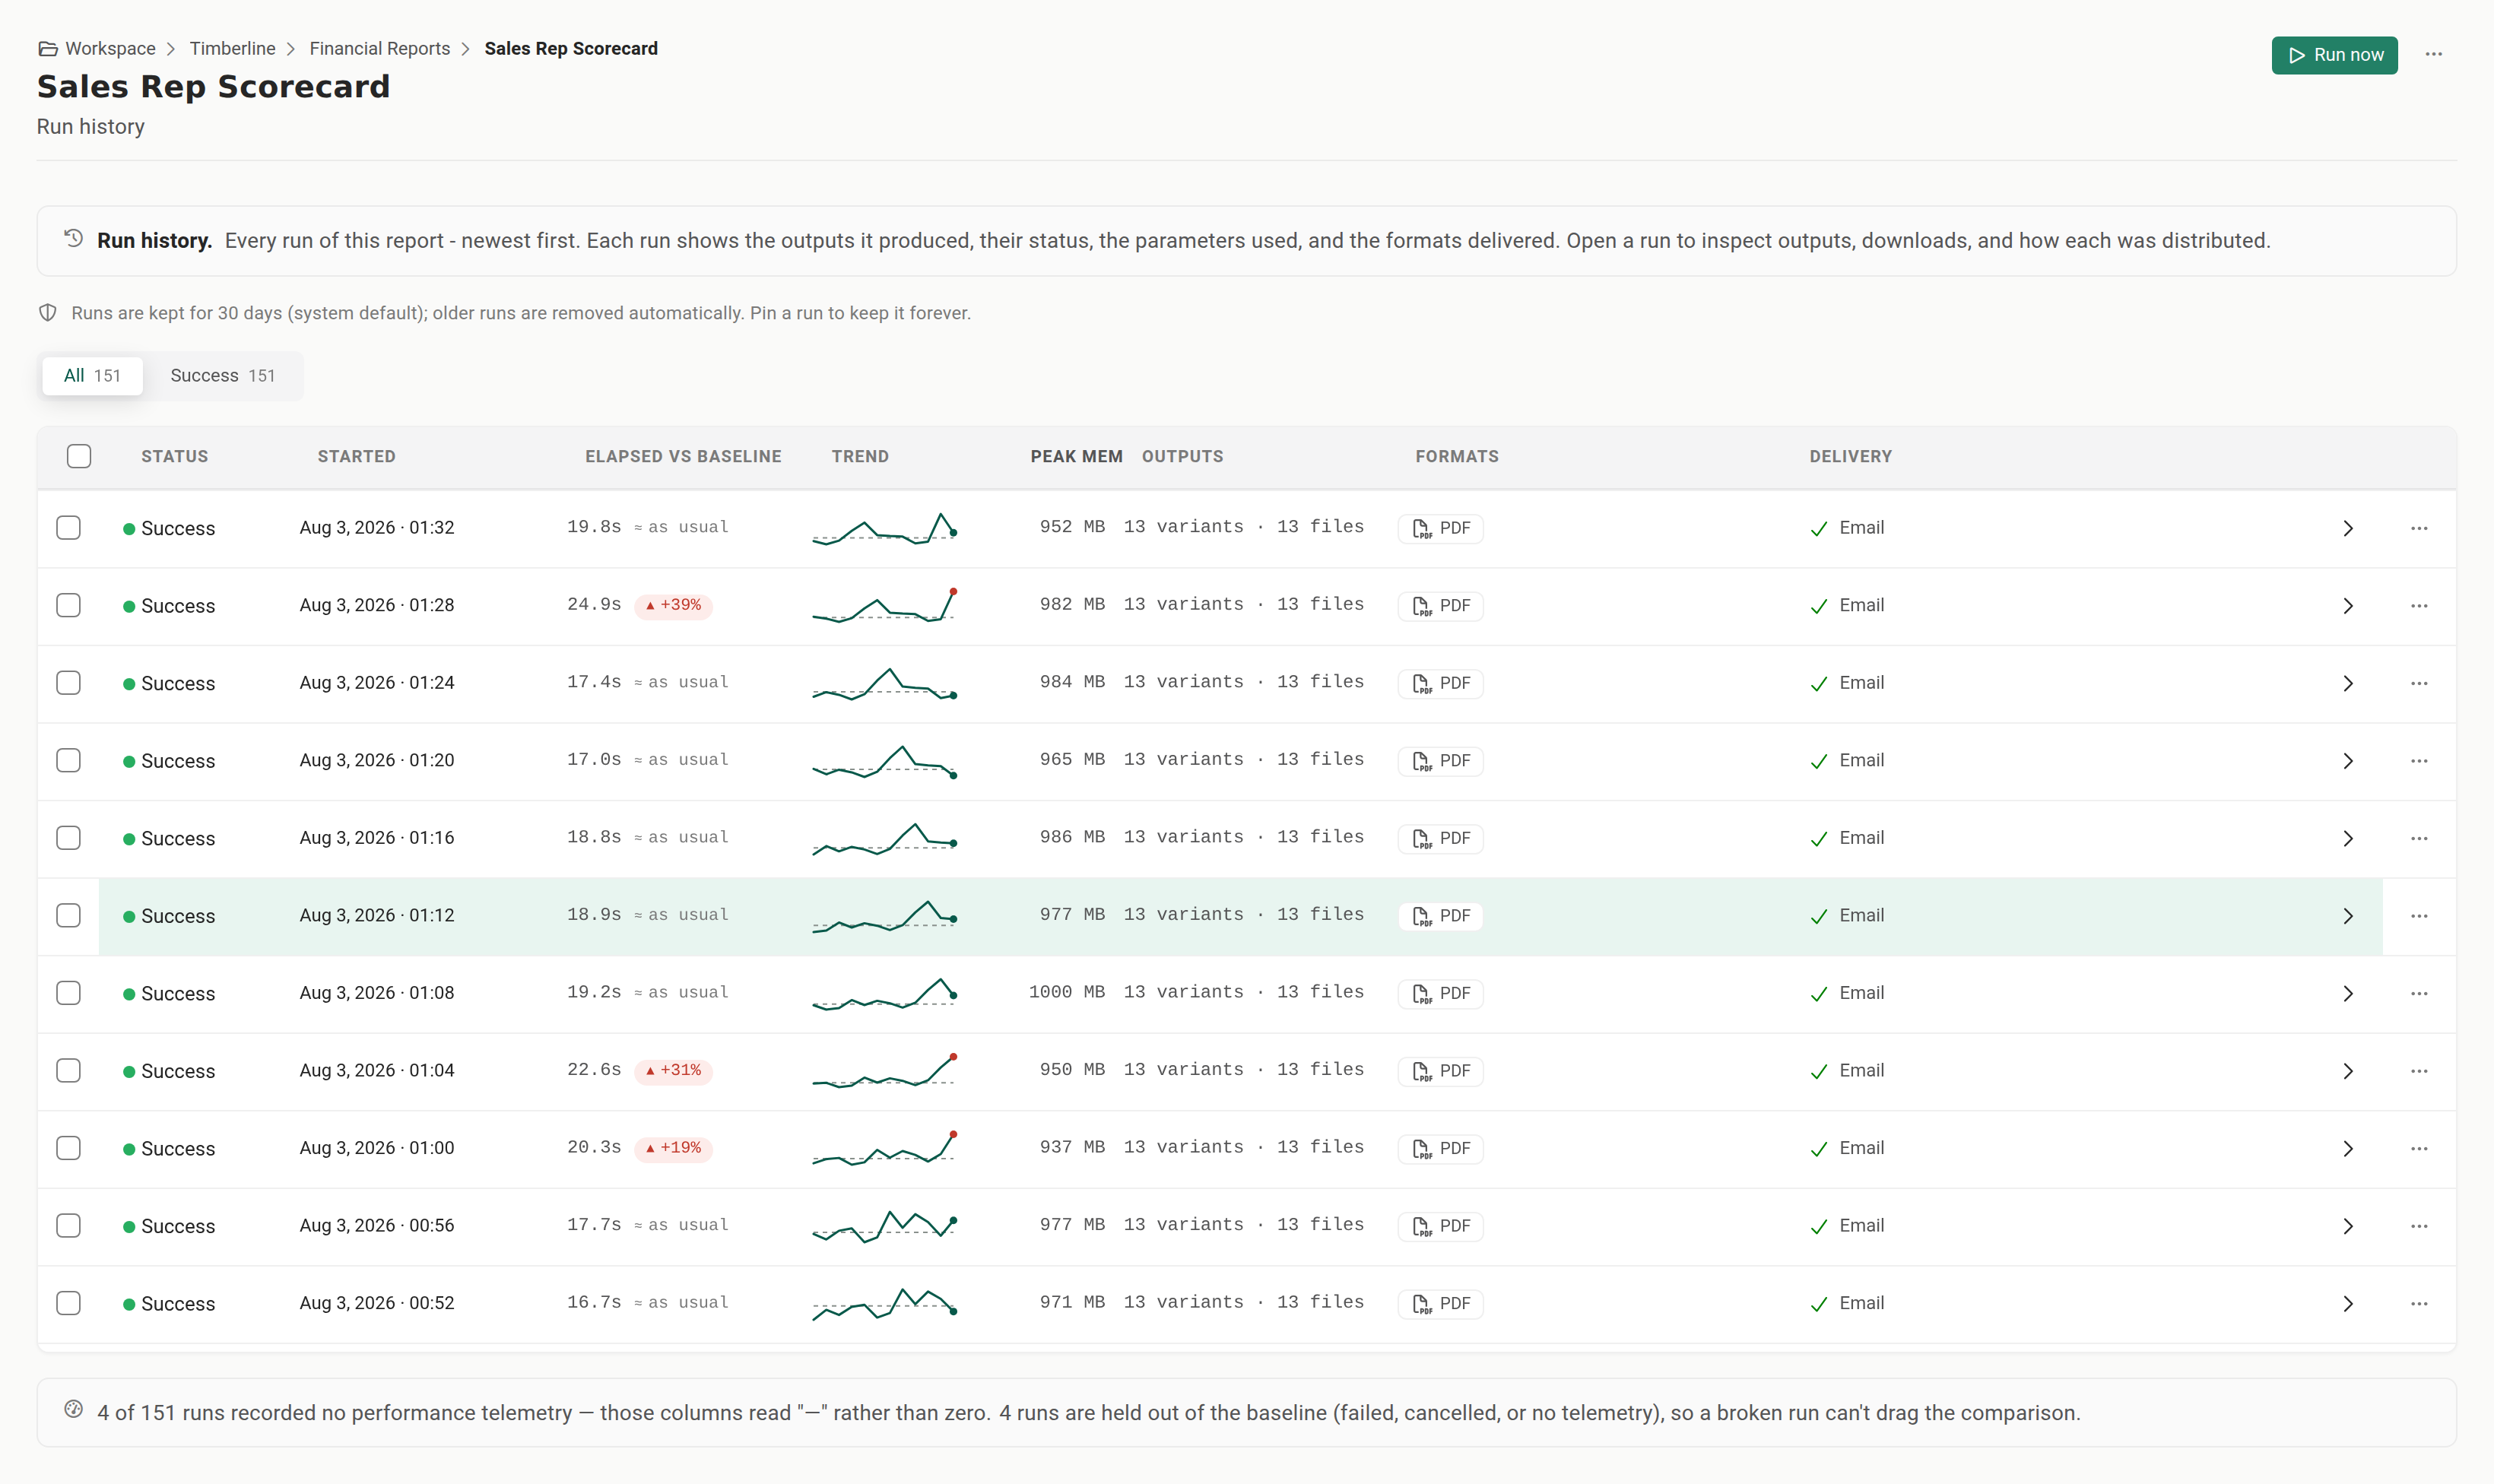
Five rules govern the comparison, and they explain why a delta is sometimes absent:
- The baseline is the median of up to 12 earlier comparable runs of the same report. The median is deliberate: one pathological run, a datasource timeout or a ten-times-larger burst, would drag an average far enough to hide every later regression.
- A report needs at least 3 earlier comparable runs before any comparison is offered. Below that, the column reports no comparison rather than measuring a run against a single predecessor.
- A difference within 15 percent counts as noise and is not flagged.
- A run is never part of its own baseline.
- Failed, canceled, and no-telemetry runs are held out of the baseline, and they get no delta of their own. A job that died after 30 milliseconds would otherwise be reported as the fastest run in the list.
Below the list, a note states how many runs recorded no telemetry and how many are held out of the baseline. A column full of dashes therefore reads as missing history rather than as a broken screen.
Two different elapsed figures. Where telemetry exists, the elapsed time is measured from execution start. Where it does not, the column falls back to the wall-clock duration on the run record, and the value's tooltip says which one you are looking at. The two are never mixed inside one trend.
Open the Performance tab for one run#
- In Run History, select the run you want to inspect.
- Select View diagnostics.
- Select Performance. The tab is present on every run, alongside Diagnostics and Compare. AI diagnostics appears next to them only for a run that failed or completed with warnings.
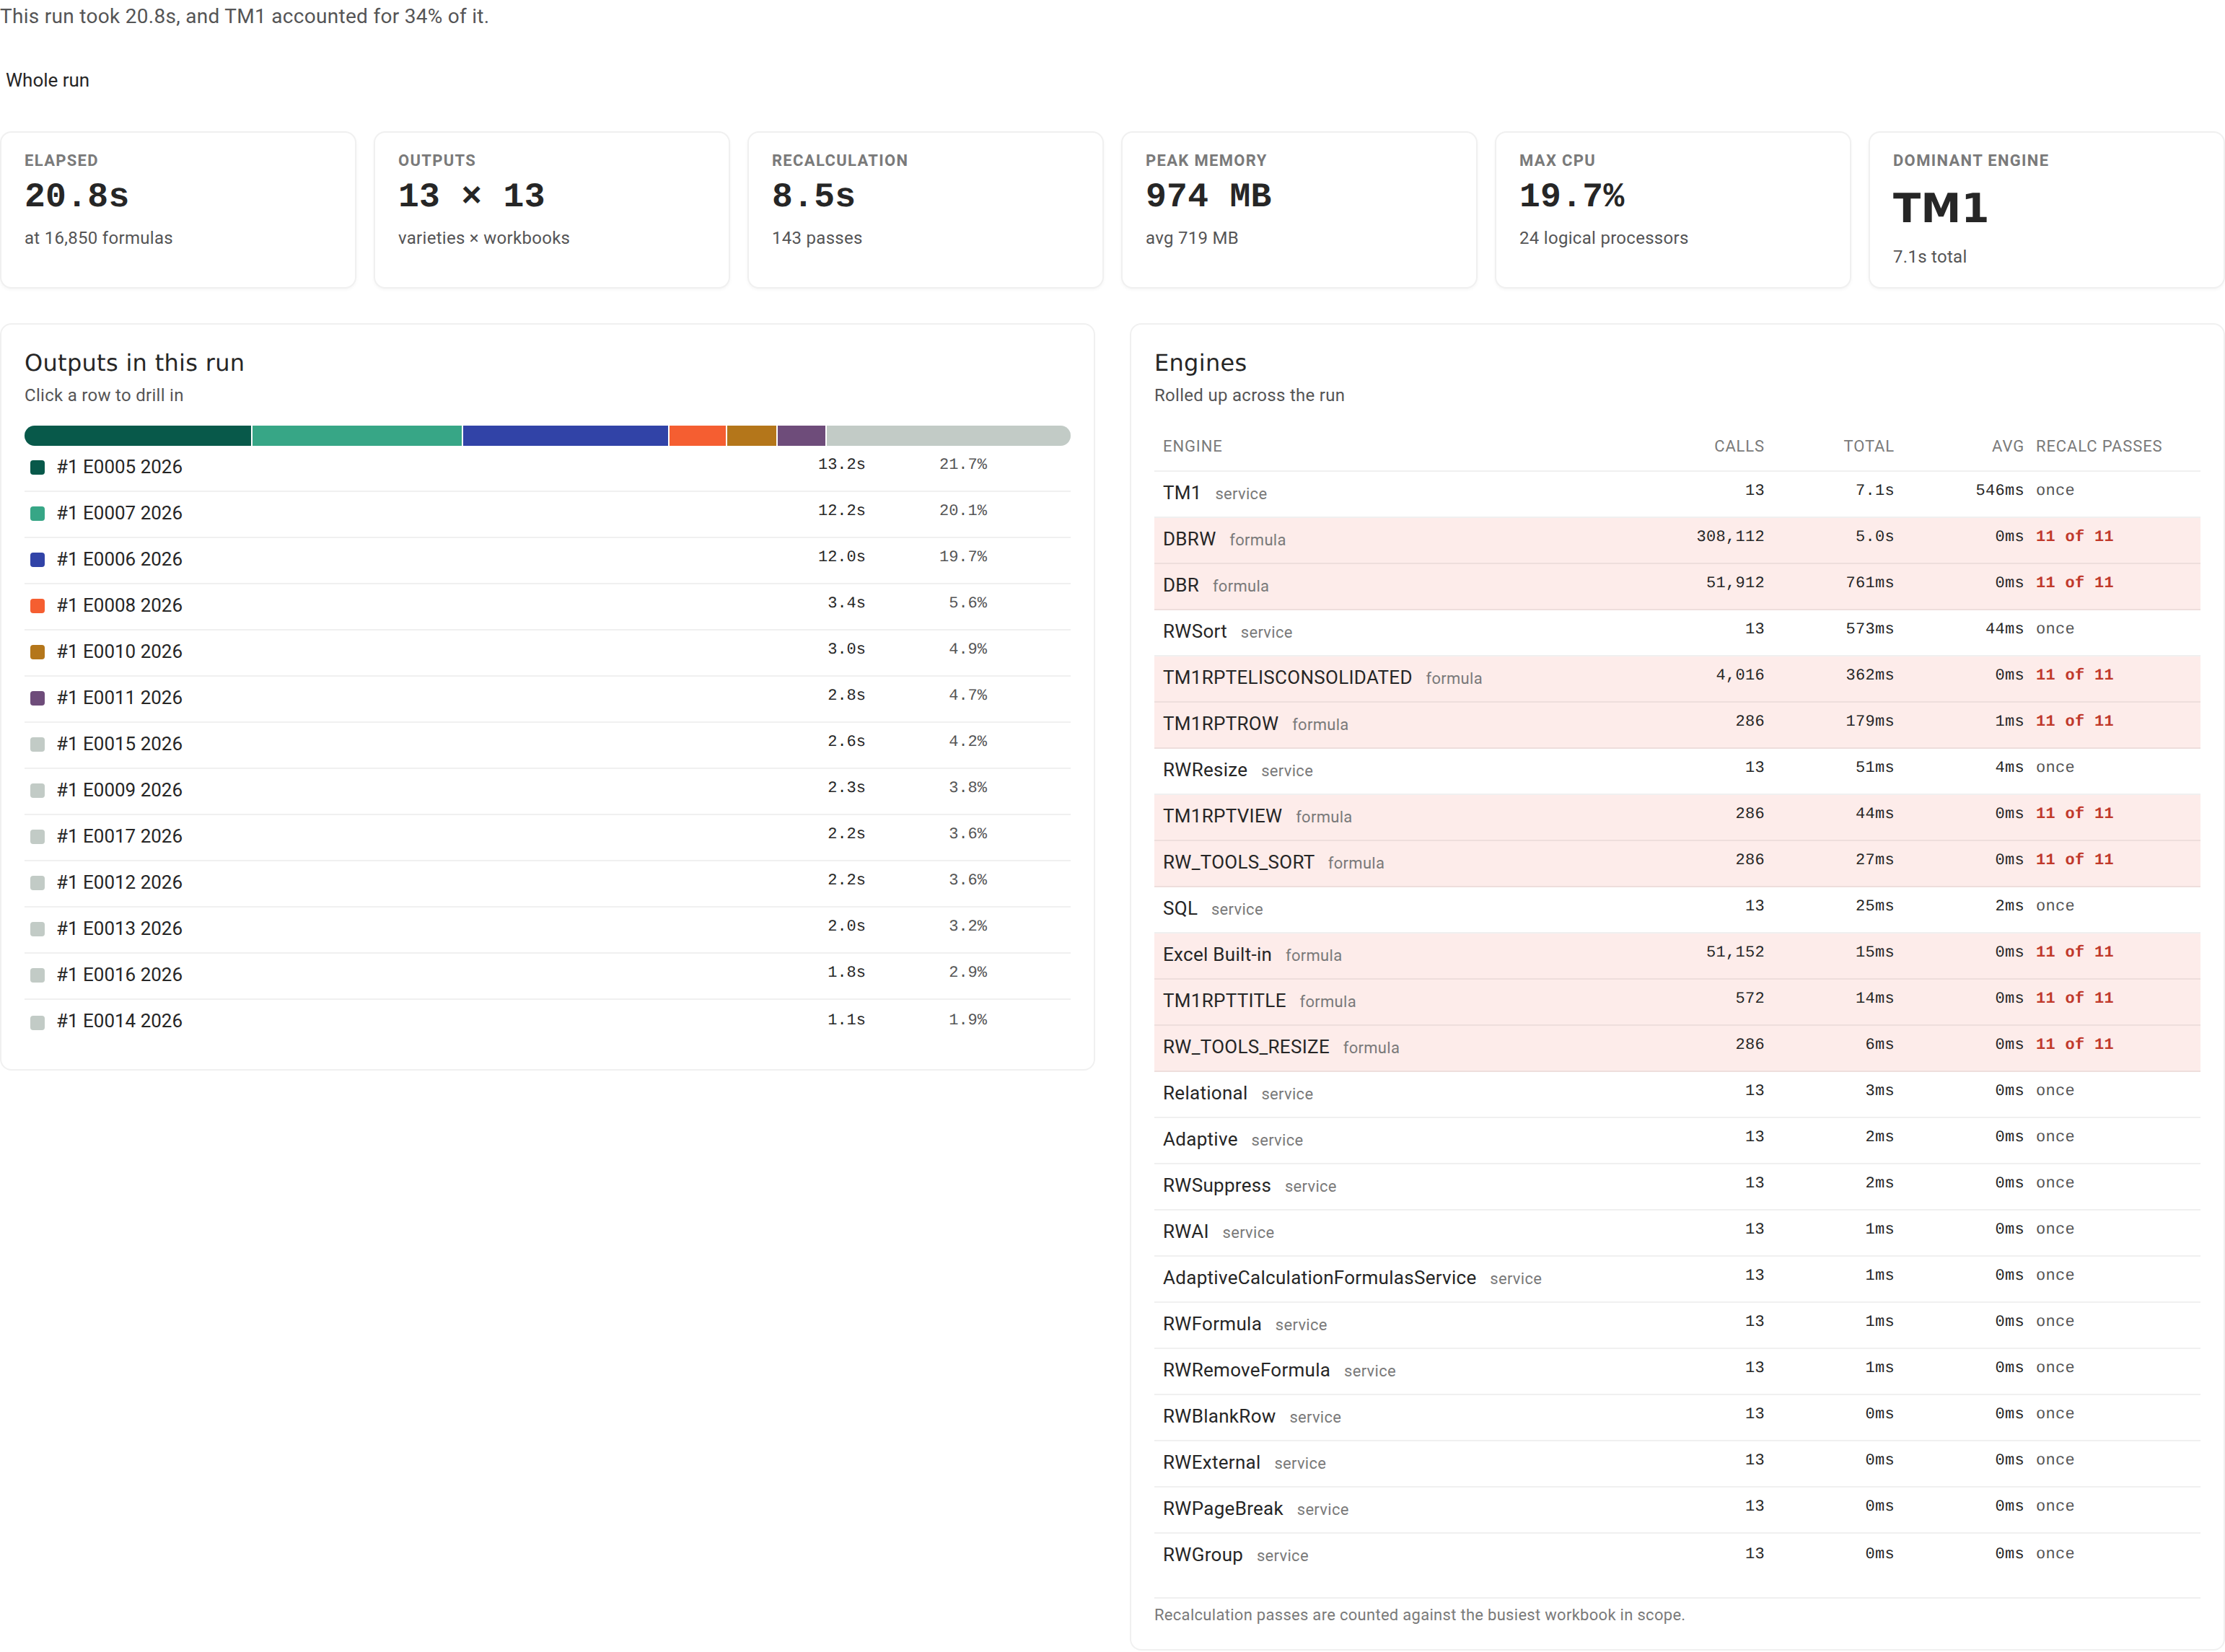
A run with no telemetry shows a short explanation in place of the breakdown. Two cases produce it: the run finished before performance telemetry existed, or it was a held-report release, which deliberately does not overwrite the original run's measurements.
Read the breakdown#
The tab leads with one sentence naming the dominant cost, for example that the run took 4m 12s and one engine accounted for 63 percent of it. Where no single engine dominates, it says the time was spread across several engines instead.
Six figures follow.
| Figure | How to read it |
|---|---|
| Elapsed | Total time, with the volume it covered underneath: data points where the run recorded them, otherwise the formula count. Volume is what makes "twice as slow" and "twice as slow for twice the data" different findings. |
| Outputs | The shape of the run, as generated outputs by workbooks. |
| Recalculation | Time spent recalculating, and how many passes it took. |
| Peak memory | Highest working set, with the average beside it. A long run's sample timeline is thinned, and the figure says when that happened. |
| Max CPU | Highest process CPU, with the host's logical processor count. A run too short to sample twice reports that CPU was never measured, not zero. |
| Dominant engine | The costliest formula family or calculation service, and its total. |
Walk from the run down to a phase#
Below the figures, one list ranks the current scope's contents by cost, largest first, with a bar showing the same proportions. Select a row to go one level deeper, and use the path above the list to come back up. The walk is always the same three levels:
- Whole run, listing the outputs it generated.
- One output, listing the workbooks inside it.
- One workbook, listing its processing phases. Phases are the last level.
At workbook level, two tails are listed separately from the ranked phases: phases that ran but cost nothing measurable, and phases that never ran at all. Keeping them apart matters, because "this workbook has no charts" and "charts were free" are different facts about the same run.
Read the engine table#
The Engines table lists one row per formula family (for example the Planning Analytics or SQL retrieval functions, with all built-in Excel functions folded into a single row) and per calculation service, with Calls, Total, Avg, and Recalc passes.
Recalc passes is the column to read. It says once for an engine that ran a single time, or N of M for one that re-ran during recalculation. An engine reading 5 of 5 on a five-pass workbook ran on every pass, and Reportworq highlights that row when the pass count is high enough for it to be expensive. That pattern is worth acting on: a data retrieval repeated on every recalculation pass is usually a formula that can be restructured, not an unavoidable cost. Engines that ran at no measurable cost are counted in a note under the table rather than listed.
Above workbook level the pass counts are folded together from the workbooks in scope, and the table says so, so 5 of 5 there means "in the recalculation loop the whole way" rather than a run-wide total.
Notes and limits#
- Runs that predate telemetry never gain it. The measurement is written when the run executes, so history from an earlier build stays empty. Look at the runs from the current build onward.
- A failed run still records its performance, deliberately, since a failure is often exactly the run whose breakdown you want.
- Releasing a held report writes no new measurement. The release re-opens the original run's record, and overwriting it with a distribution-only measurement would destroy the history this feature exists to build.
- Performance data ages out with the run. It is stored with the run's other diagnostics and is removed when retention removes the run. Pin a run to keep it, for example a period-close run you expect to compare against. See Output retention.
- This is not alerting. There are no thresholds to set and no notifications. The baseline rule is fixed as described.
- A view-only User never reaches the Performance tab, because View diagnostics is not available to that role.
Going deeper. For what to change once you know where the time went, see Manage and improve performance. To find the point in this report's history where its run time changed, rather than judging one run, see Find when a report got slower. Administrators can ask the same question across every report at once, and pivot by product release or execution node, in Compare performance across reports. To read a failing run's log, attachments, and HTTP trace instead, see When a job fails. To change how long runs and their diagnostics are kept, see Output retention.
Feedback on this page
Comments, questions, requests, or something missing or unclear? Email us - the page you are on is filled in for you.
Email feedback on this pageOr write to support@reportworq.com directly.