
Profile and stress-test a campaign#
Campaign profiling answers two capacity questions before a campaign goes live: how much server memory does a form cost, and what will contributors actually experience when many of them fill forms at the same time. It is a diagnostics screen on the Campaign Dashboard, not part of the contributor experience.
The screen has three tabs, each a self-contained tool:
| Tab | Answers | How it works |
|---|---|---|
| Memory profiling | How much memory does this form cost the server? | Opens the form in an isolated worker on the server and measures its footprint. Read-only. |
| Stress testing | Will the deployment hold up under real load? | Builds plan files for the rw-stress-runner, a separate tool that drives real browsers as virtual contributors. |
| Analysis | What did contributors experience? | Reads the result files the runner produced and reports the timings in plain language. |
The worked example throughout is a Q3 budget round with two forms, North America Budget and EMEA Budget.
Before you start#
- The campaign has generated forms. Memory profiling and stress plans both read the generated form workbooks.
- For a stress test, set up a dedicated stress-test user and a disposable copy of the campaign (see Recommended setup).
- To run a stress test you need one or more Windows load-generator machines with the .NET 10 runtime installed. The load generators are Windows regardless of what the server runs.
Open Campaign profiling#
- Open the campaign's Campaign Dashboard.
- On the dashboard toolbar, select Campaign profiling.
The screen opens on the Memory profiling tab. It profiles the forms you had selected in the dashboard, or every form in the campaign when nothing is selected. The breadcrumb reads Workspace ▸ Campaign ▸ Profiling; select Close to return to the dashboard.
To jump straight to memory profiling for a single form, open that form's Actions menu and select Profile Memory. The screen opens on the Memory profiling tab with only that form selected; you can add more.

Memory profiling#
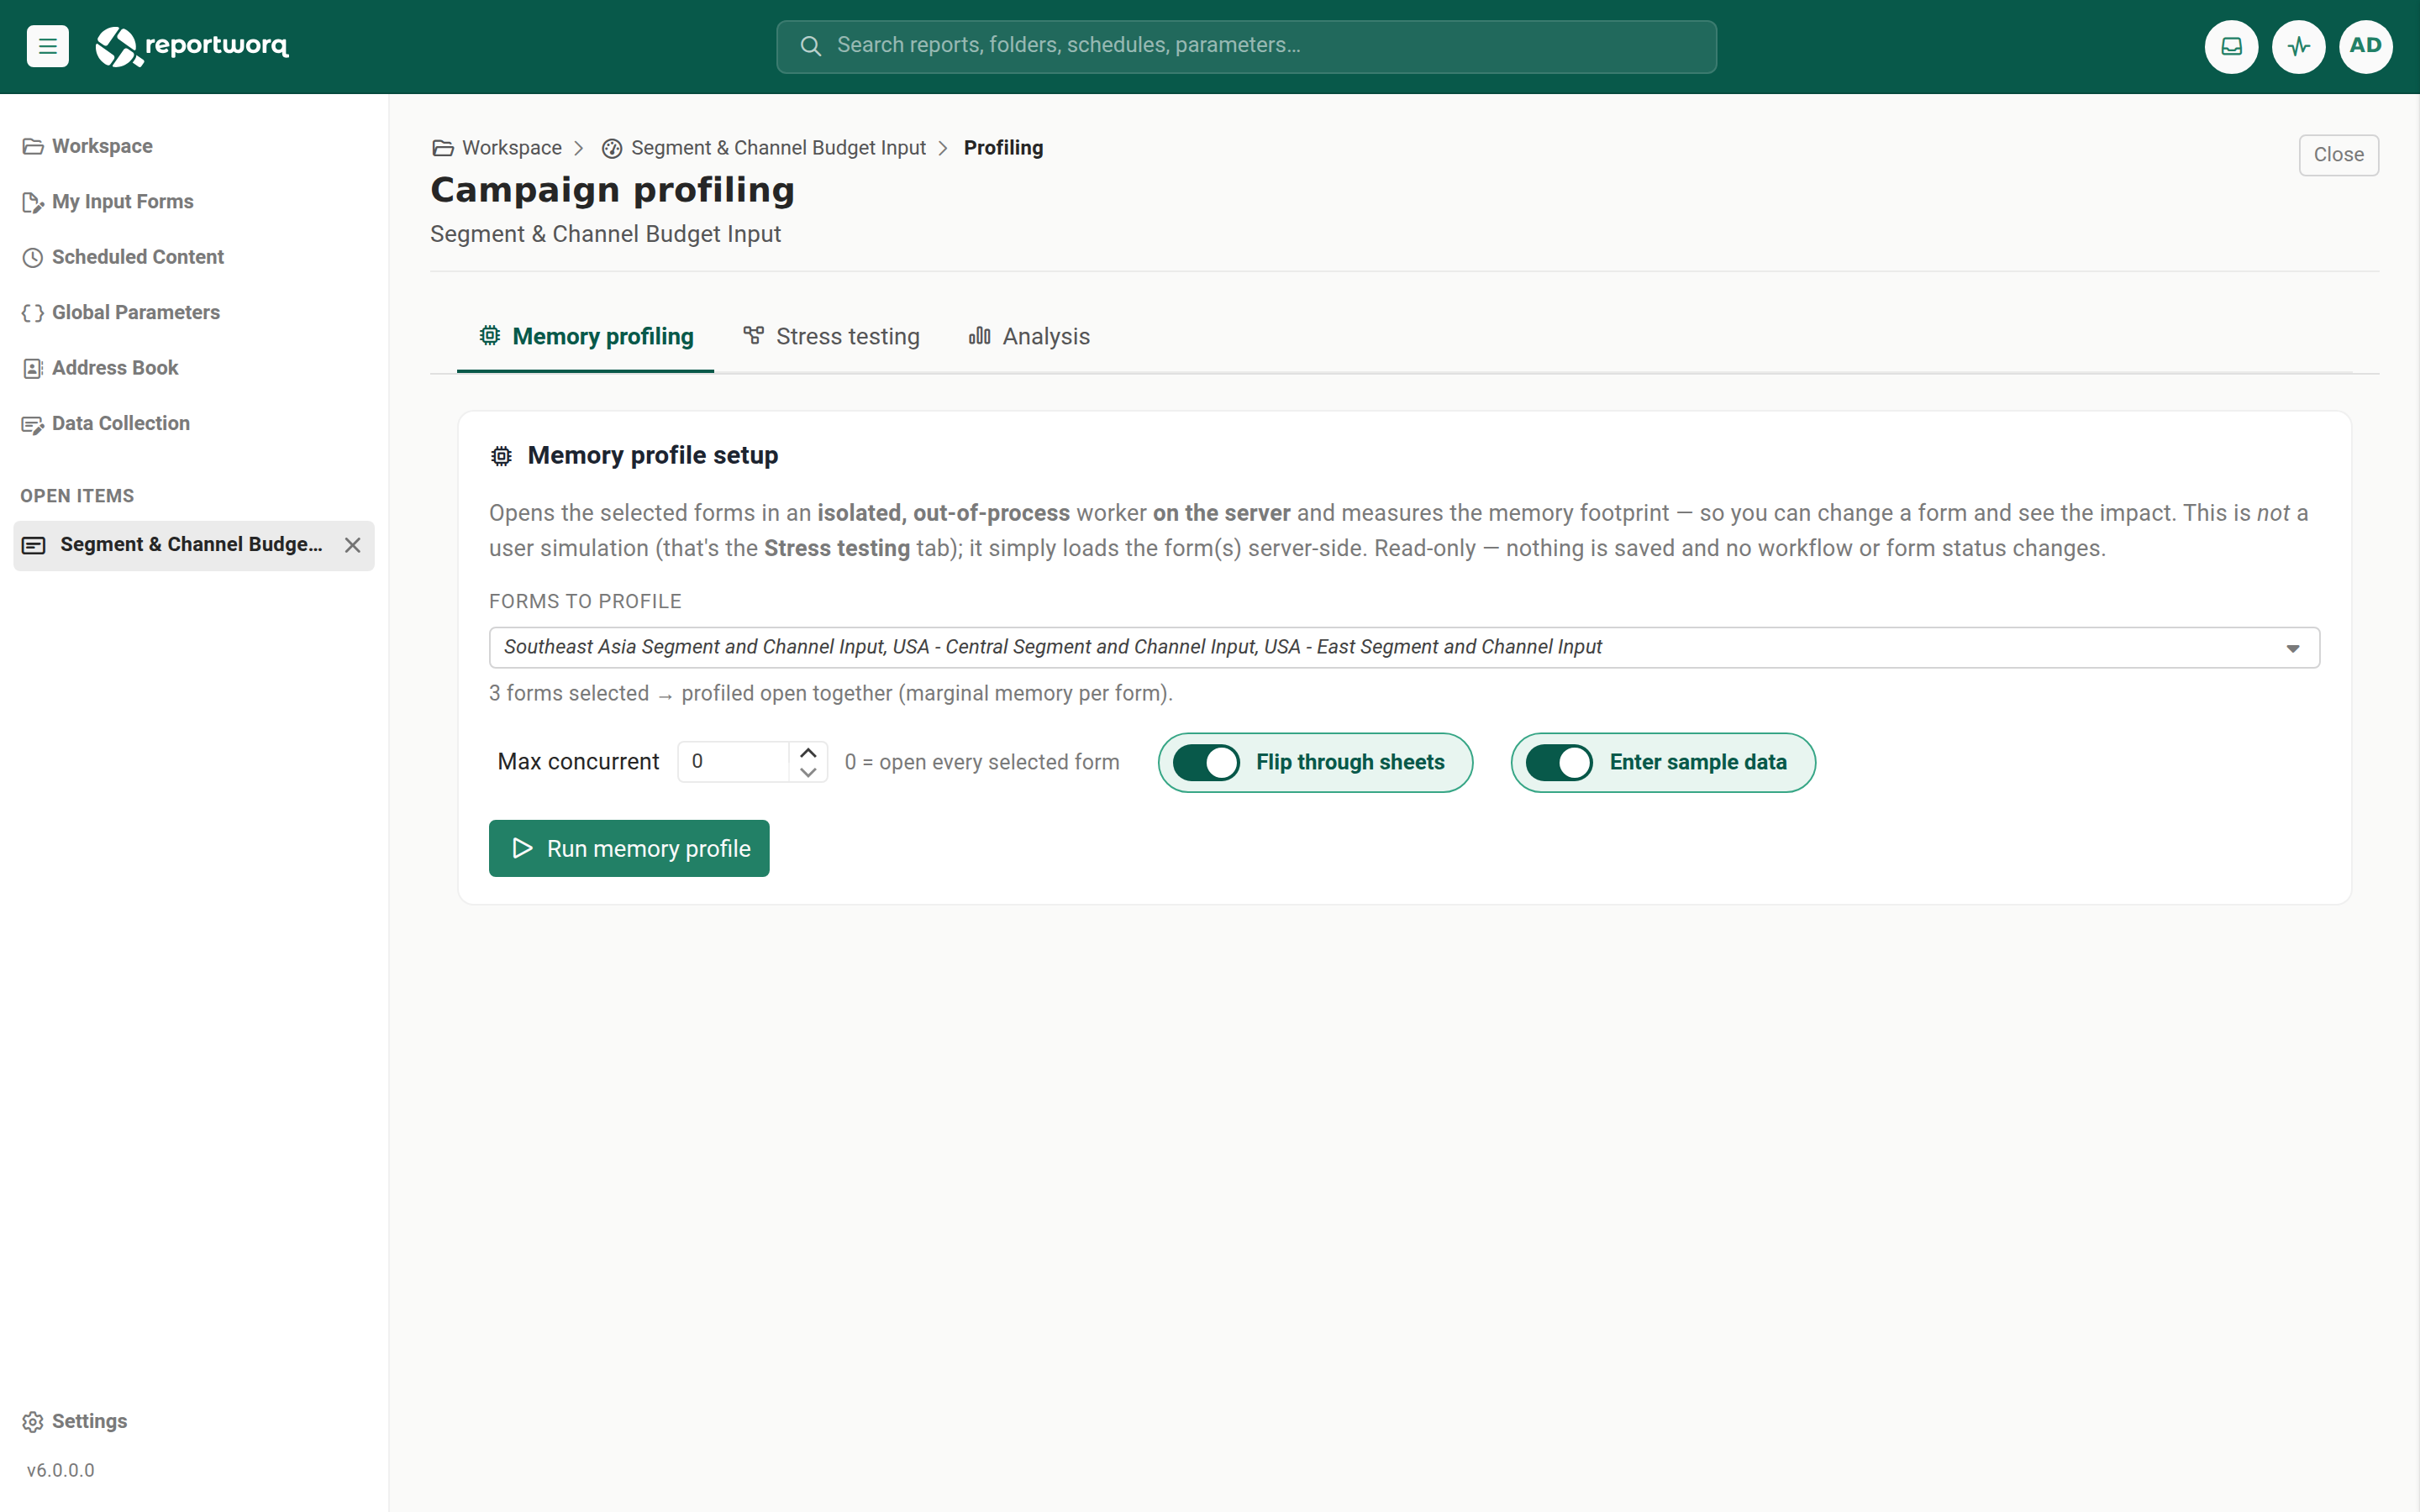
Memory profiling opens a form in an isolated, out-of-process worker on the server and measures its memory footprint, so you can change a form and see the effect on cost. It is not a user simulation; that is the Stress testing tab. It is read-only: nothing is saved, and no workflow or form status changes.
Run a profile#
- Under Forms to profile, select one or more forms from the dropdown. The number you pick sets the mode:
- One form gives a detailed per-form footprint measured over several cycles.
- Several forms profiles them all open at once, to measure the marginal cost of each additional form.
- Set the run options:
- For a single form, set Cycles (1 to 10, default 3). Each cycle opens, measures, and closes the form; the first cycle is a warm-up and is excluded from the averages.
- For several forms, set Max concurrent (0 opens every selected form).
- Flip through sheets and Enter sample data exercise the form the way a contributor would. Both are on by default; leaving them on gives a more realistic footprint.
- Select Run memory profile. The worker profiles on the server while the button shows progress.
- To keep the numbers, select Download CSV or Download JSON.
Read a single-form profile#
The Per-form memory footprint card leads with the numbers that matter:
- Peak per form (avg) is the working memory one open form costs at its peak, averaged across cycles, with the observed range.
- Steady (just opened) is the cost right after the form opens, before any interaction.
- Bytes per cell (at peak) relates cost to form size, alongside the cell and input-cell counts.
- Held after close is memory still held after the form closes, a retention or leak signal.
Below the stats, an estimate reads ~N of this form open at once on the profiling machine, derived from the free memory on the profiling machine (using 80% of it, divided by the average peak per form). Treat it as indicative: real capacity depends on the server and the worker pool. The Form & run facts and Per-cycle detail cards give the underlying sizing and the raw per-cycle measurements.
Read a multi-form profile#
When several forms are profiled together, the Forms open together card reports Forms held open, the Marginal cost per form (the true cost of each additional concurrent form, after the first), the First form cost (which includes one-time warm-up), and the Machine memory peak. The Ramp table shows memory climbing as each form opens.
If a form cannot be opened, most often because its generated workbook has not been created yet or its saved copy is empty, it is listed under Skipped, with the reason, and the rest are profiled normally.
Stress testing#
Stress testing measures the live contributor experience under load. The screen here builds the plan files; the load itself is generated by the rw-stress-runner, a separate executable that drives real browsers as virtual contributors. Each virtual contributor signs in, opens a form, reads it, and fills it in one cell at a time at human pace, the same path a real contributor takes, which is what actually stresses the server.
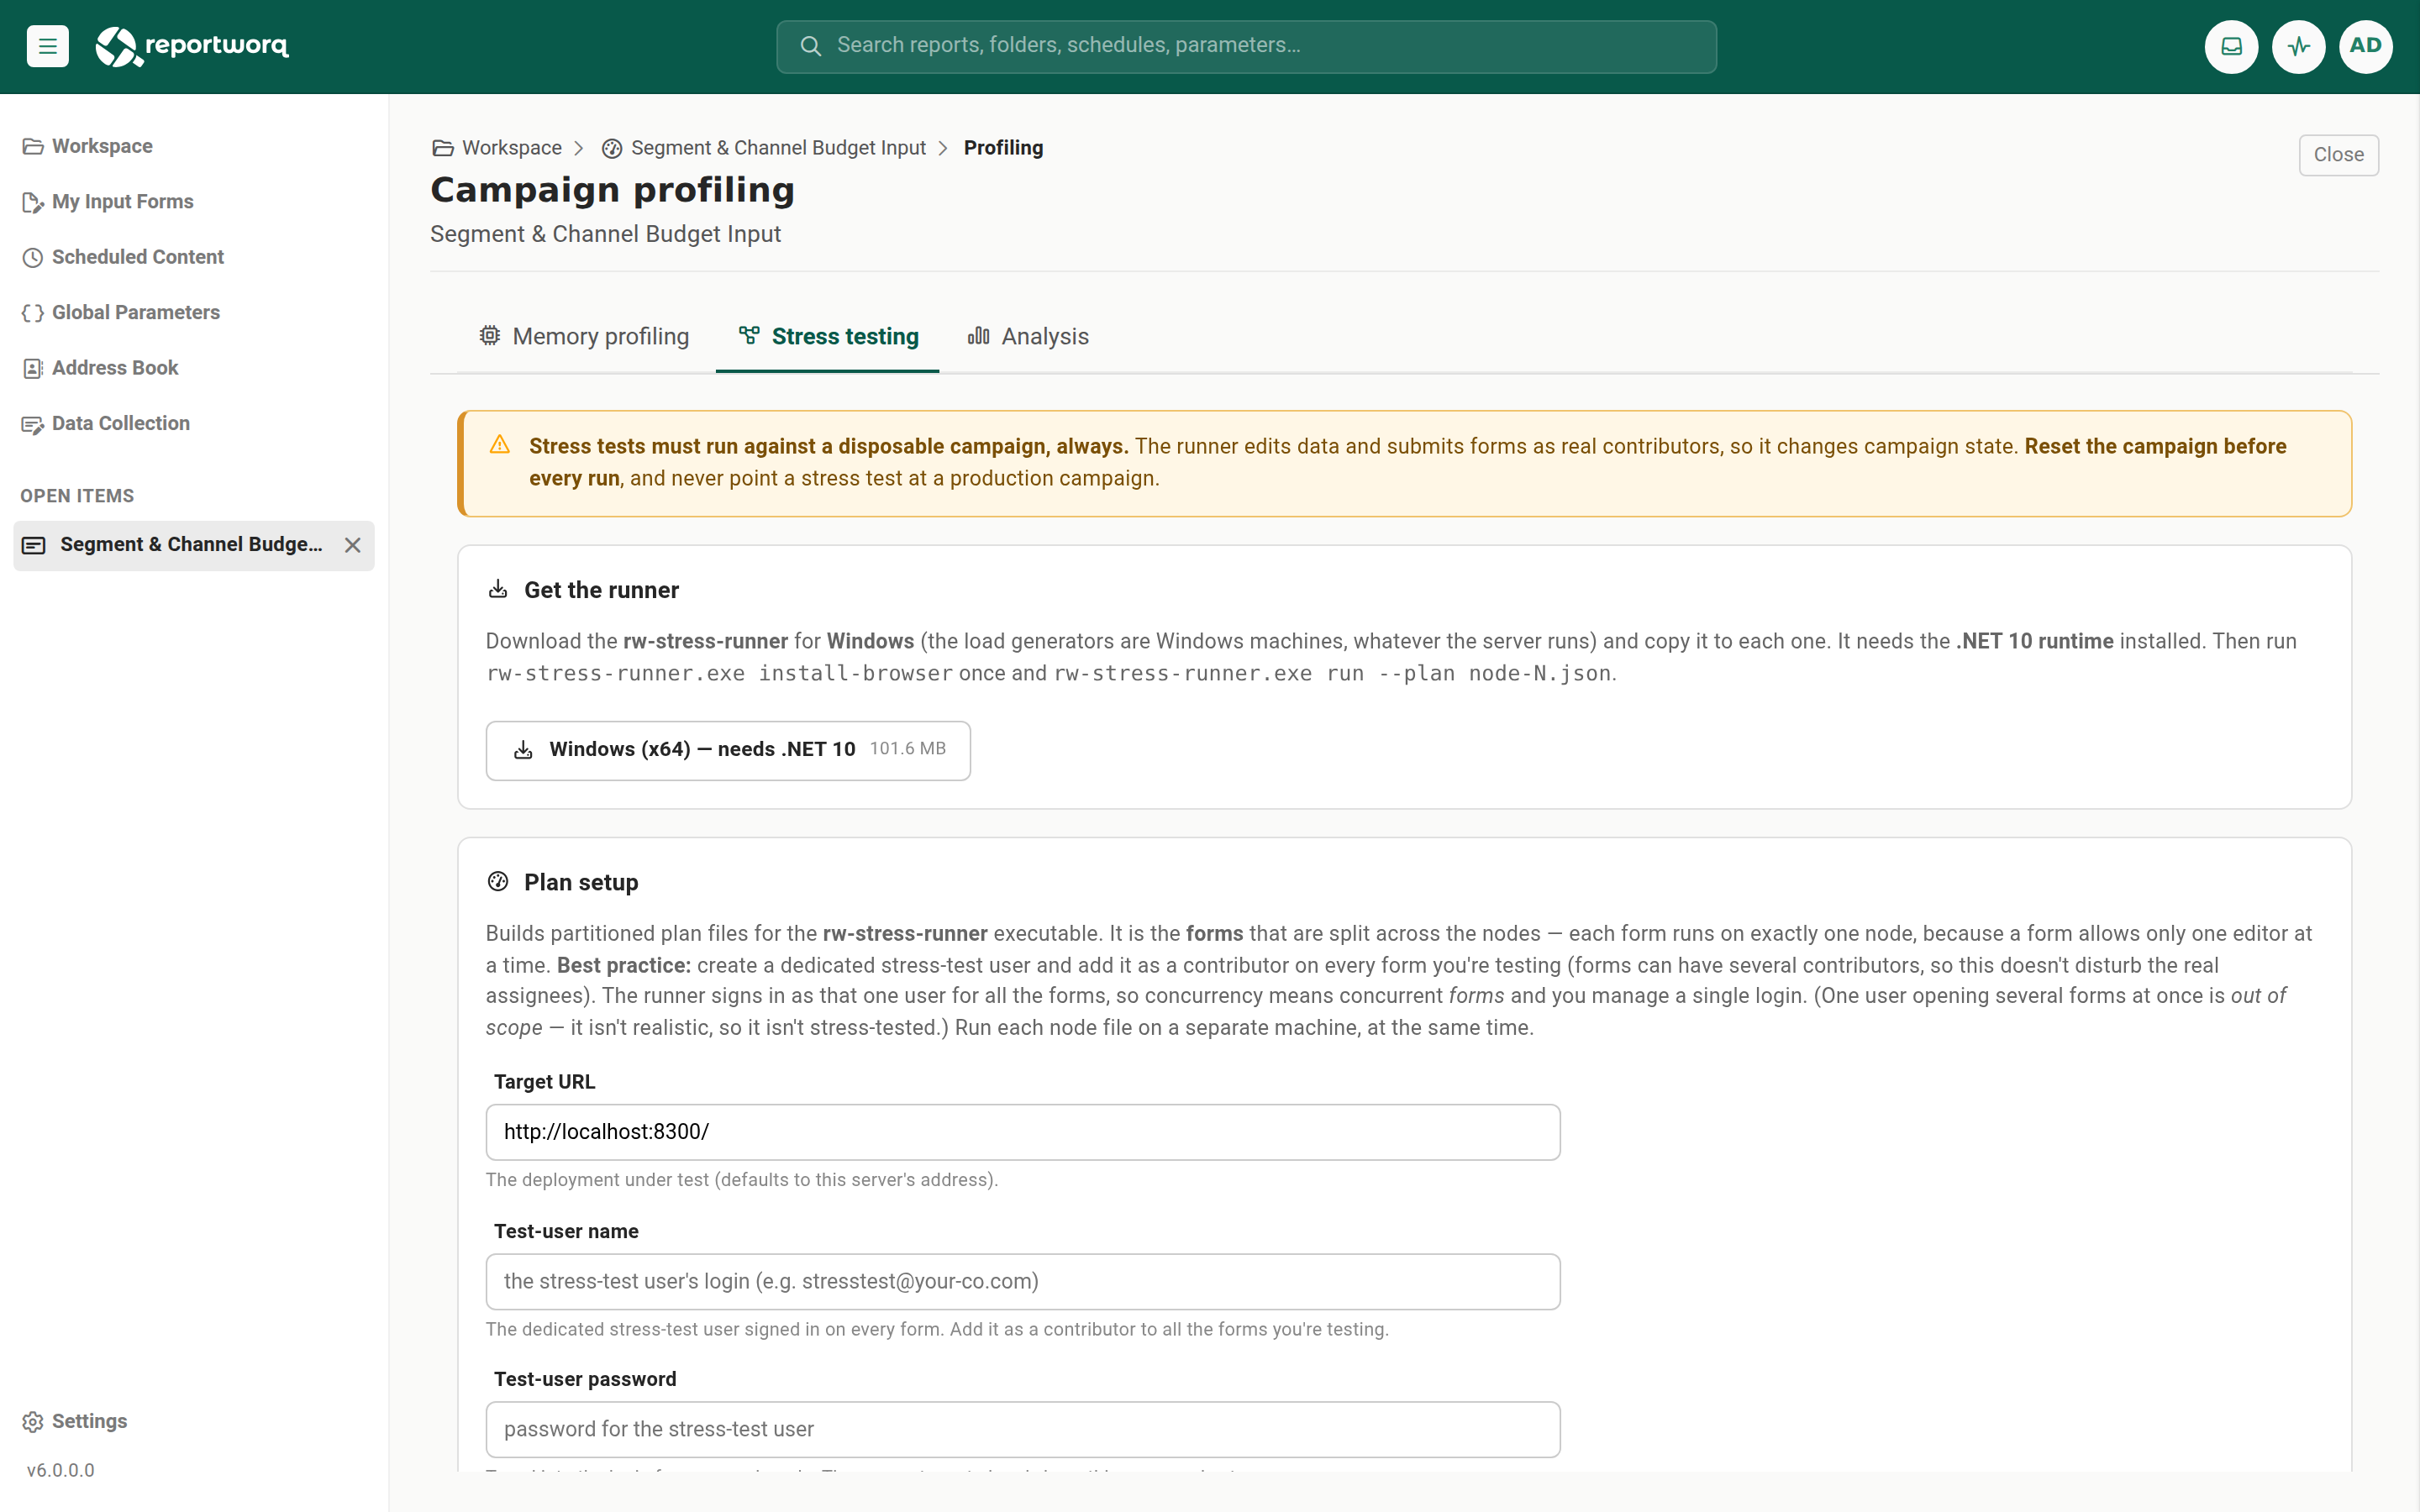
Stress tests change campaign data. The runner edits values and submits forms as real contributors, so it changes campaign state. Always run a stress test against a disposable campaign, reset the campaign before every run, and never point a stress test at a production campaign.
Recommended setup for a stress test#
Prepare these three things before you build a plan:
- A dedicated stress-test user. Create one account and add it as a contributor on every form you want to test. Forms can have several contributors, so this does not disturb the real assignees. The runner signs in as this one user for all forms, so you manage a single login and concurrency means concurrent forms.
- A disposable campaign. Use a throwaway copy, never production content.
- A reset before each run. Because the runner writes data and submits, reset the campaign to a clean state before every run so results are comparable.
Get the runner#
On the Stress testing tab, under Get the runner, download the rw-stress-runner for Windows and copy it to each load-generator machine.
On each machine, confirm the .NET 10 runtime is installed.
Install the browser once per machine:
rw-stress-runner.exe install-browser
If the download links are absent, the runner was not bundled in this build; an administrator can publish it from the Reportworq.Contribution.StressRunner project and place the kits where the app serves them.
Build the plan files#
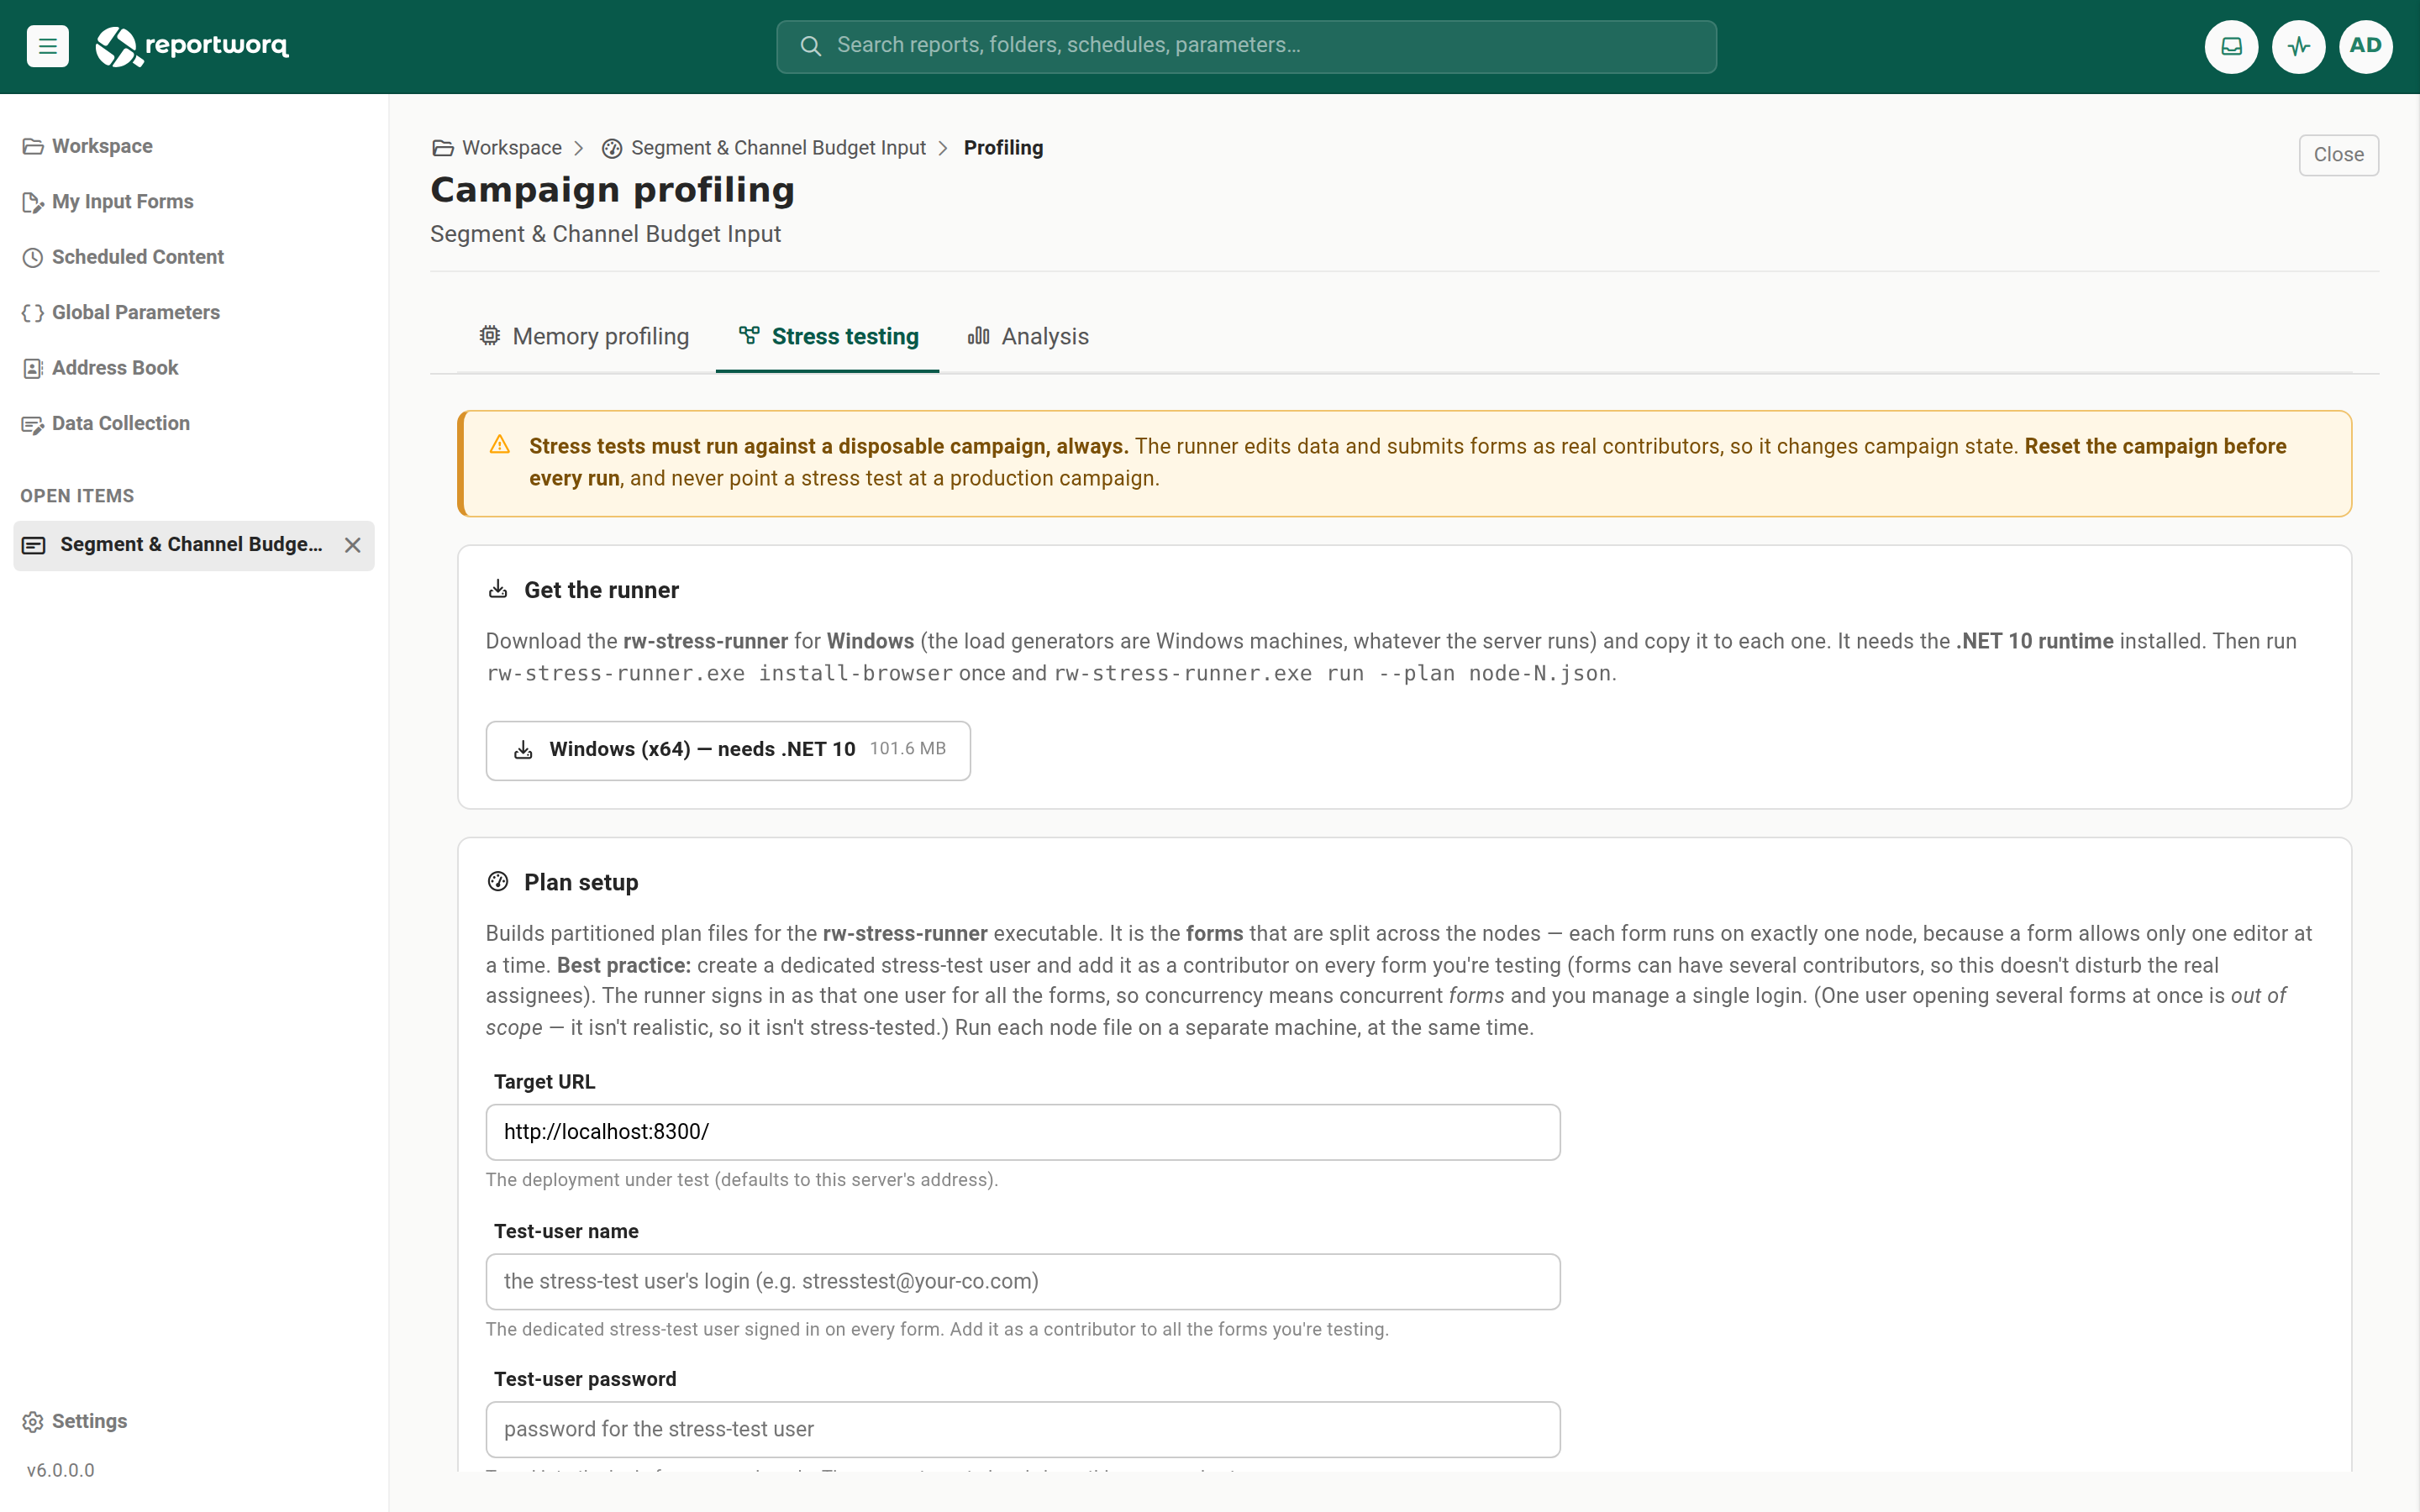
- Fill in Plan setup:
- Target URL is the deployment under test. It defaults to this server's address.
- Test-user name and Test-user password are the dedicated stress-test user's login. The runner types these into the login form on each node.
- Nodes (machines) is required. One plan file is produced per node. The forms are partitioned across the nodes; each form runs on exactly one node, because a form allows only one editor at a time.
- Concurrent forms / node sets how many forms a single machine opens at once (default 10).
- Set the Editor pace slider. It scales every human pause and the ramp-up together, so the same plan can finish in minutes (toward Fast) or run for an hour or more (toward Slow & deliberate). The Estimated run time updates live as you slide.
- Optionally open Advanced settings. The defaults are tuned for a realistic run:
- Cells to fill (%) is the share of each form's input cells a user fills, as a range (default 50 to 75).
- Submitters (%) is the share of users who submit rather than close (default 25, applies when Submit form is on).
- The switches turn individual behaviors on or off: Fill in cells, Spread (bulk), Add comments, Recalculate, Change sheets, and Submit form.
- Select Compute sizing & build plans. Reportworq measures each form and partitions the work into node plans.
- Review the Nodes and Form sizing tables, then select Download N plan file(s). The download is a
.zipof onenode-N.jsonper machine, plus aREADME.txtwith the run steps.
Run the stress test#
On each load-generator machine:
Copy the runner and that machine's single plan file to it.
Run the node plan:
rw-stress-runner.exe run --plan node-1.jsonLaunch every node at about the same time.
Each node writes node-N.result.json, .csv, and .md. Keep the node-*.result.json files; you upload them to the Analysis tab.
When you launch a run from a terminal, the runner asks two questions it does not read from the plan: whether to open the browsers so you can watch them (default is headless, which is best for a real run), and, for single sign-on, it opens a browser for you to sign in once. For a stress test that uses SSO/OIDC instead of a password, turn on the plan's SSO option and leave the passwords blank; each node prompts you to sign in when the run starts.
Analysis#
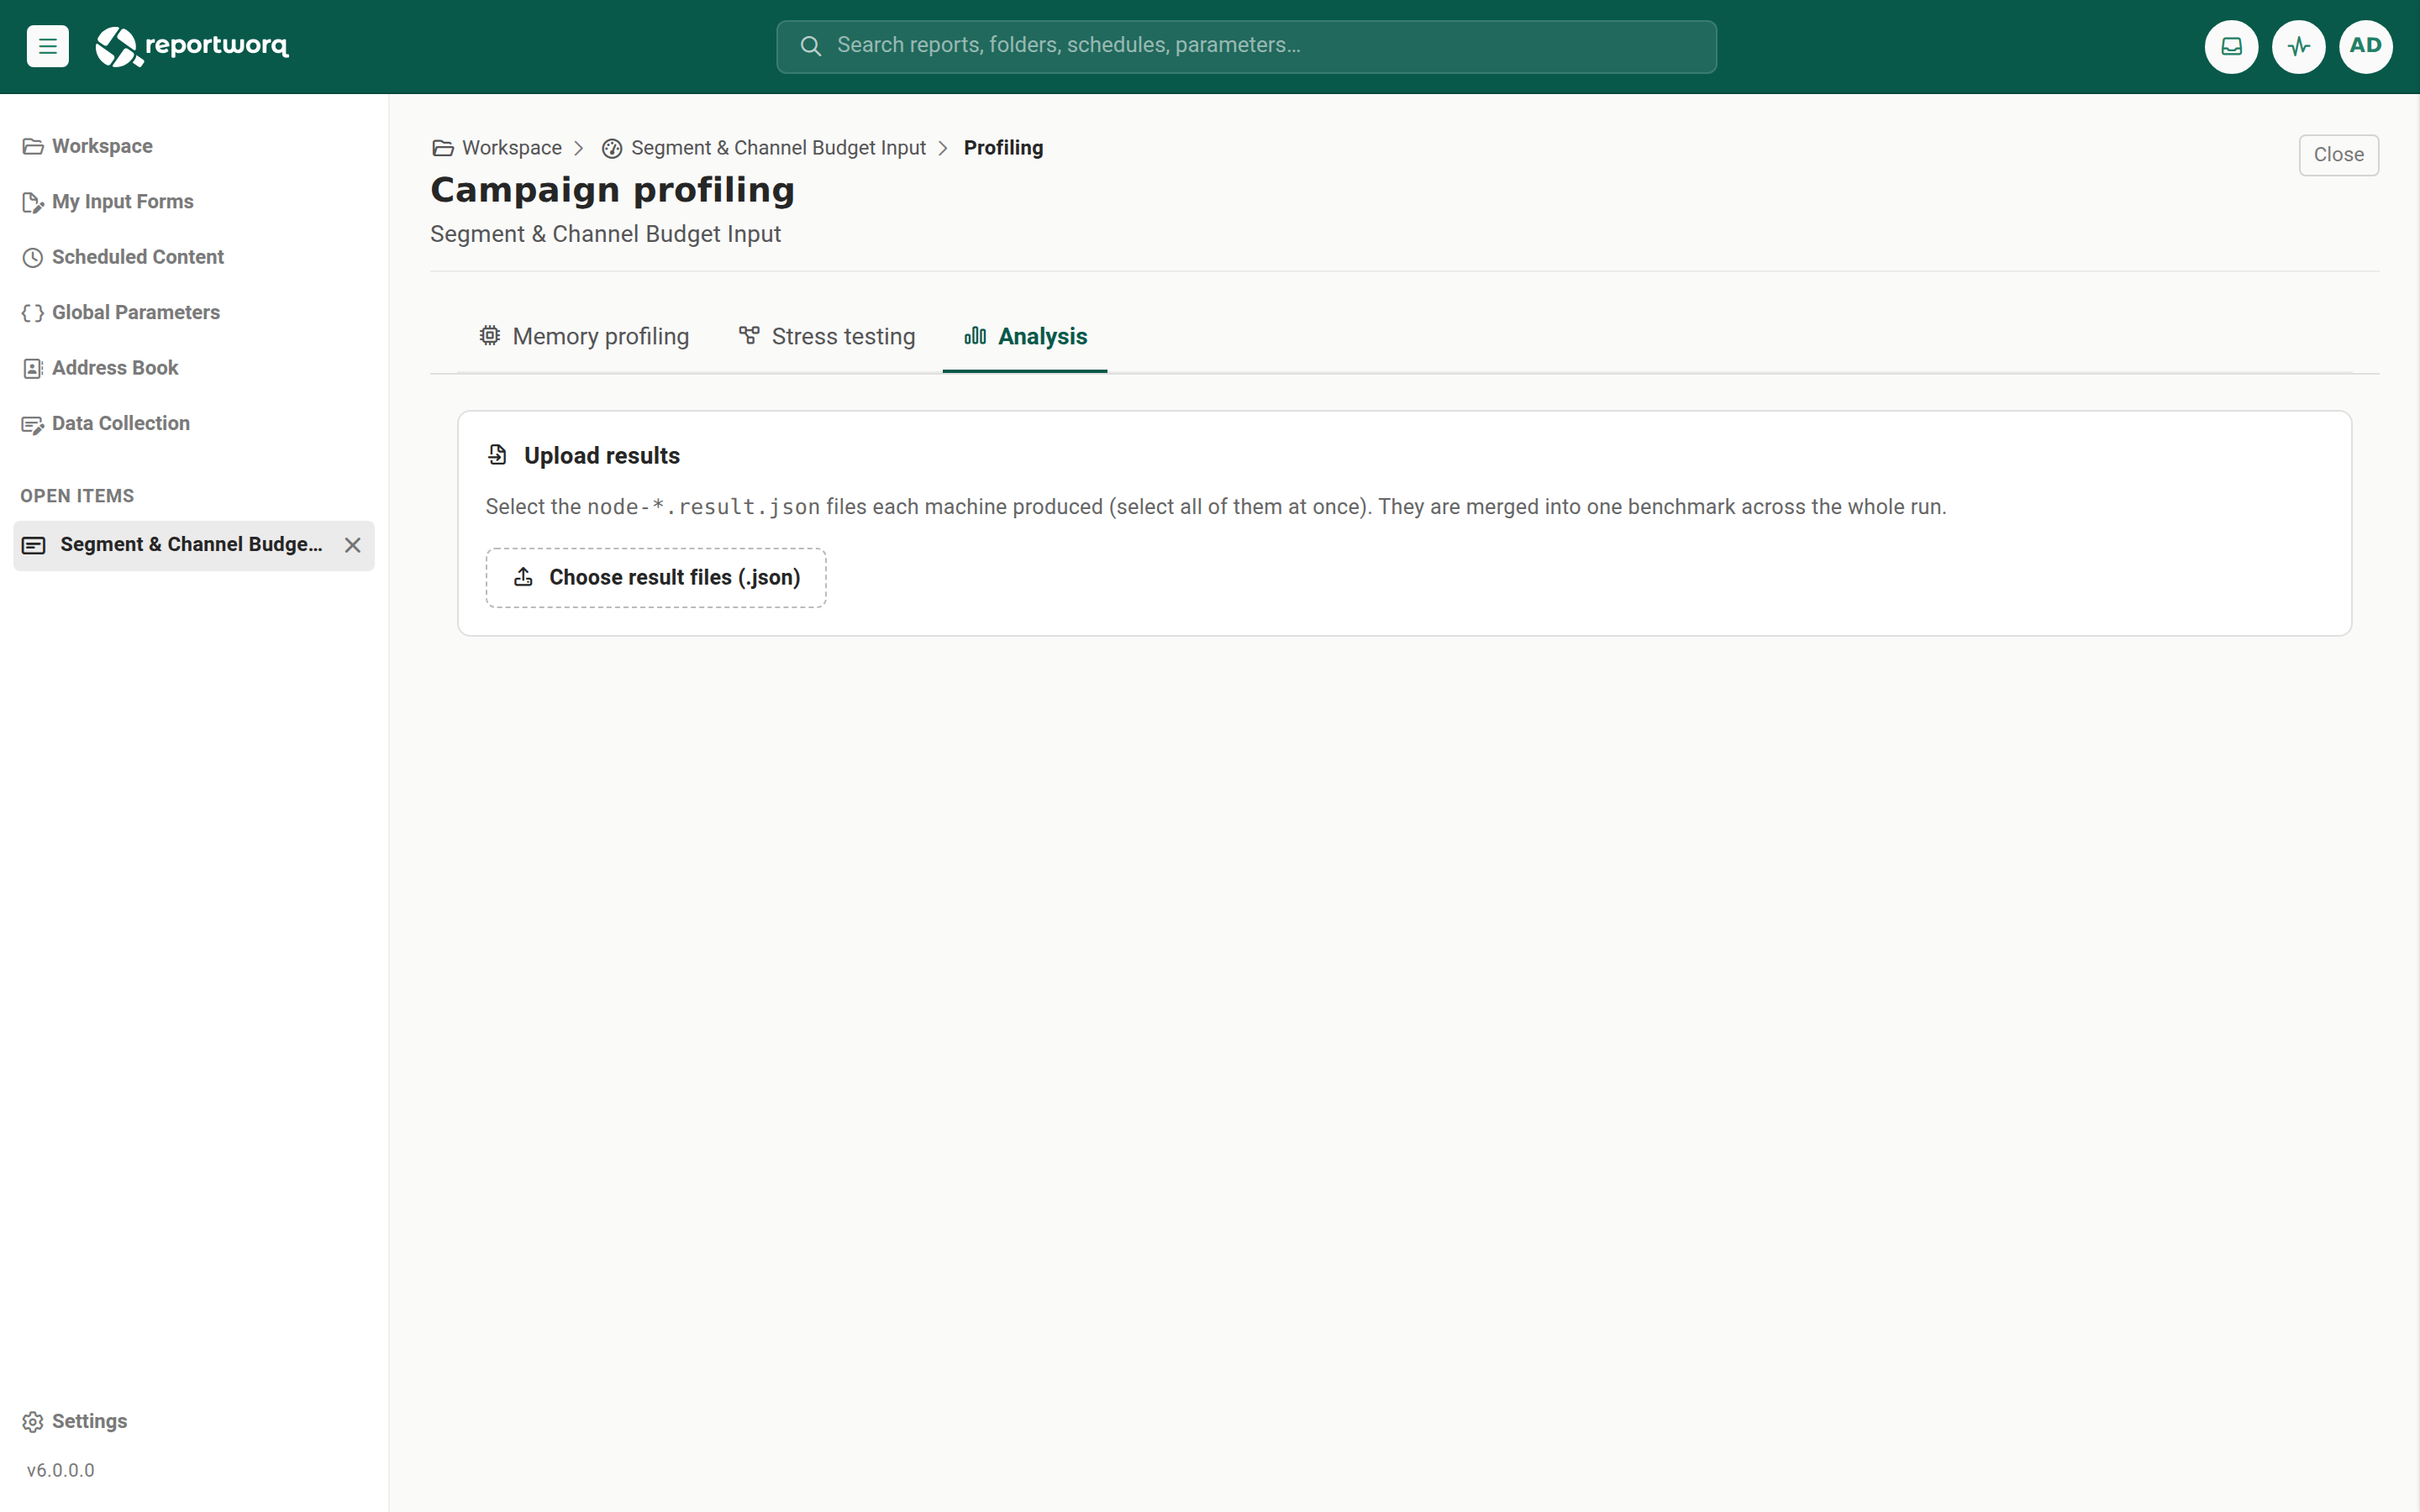
The Analysis tab turns the node result files into one consolidated benchmark and describes, in plain language and in seconds, what contributors experienced.
Load the results#
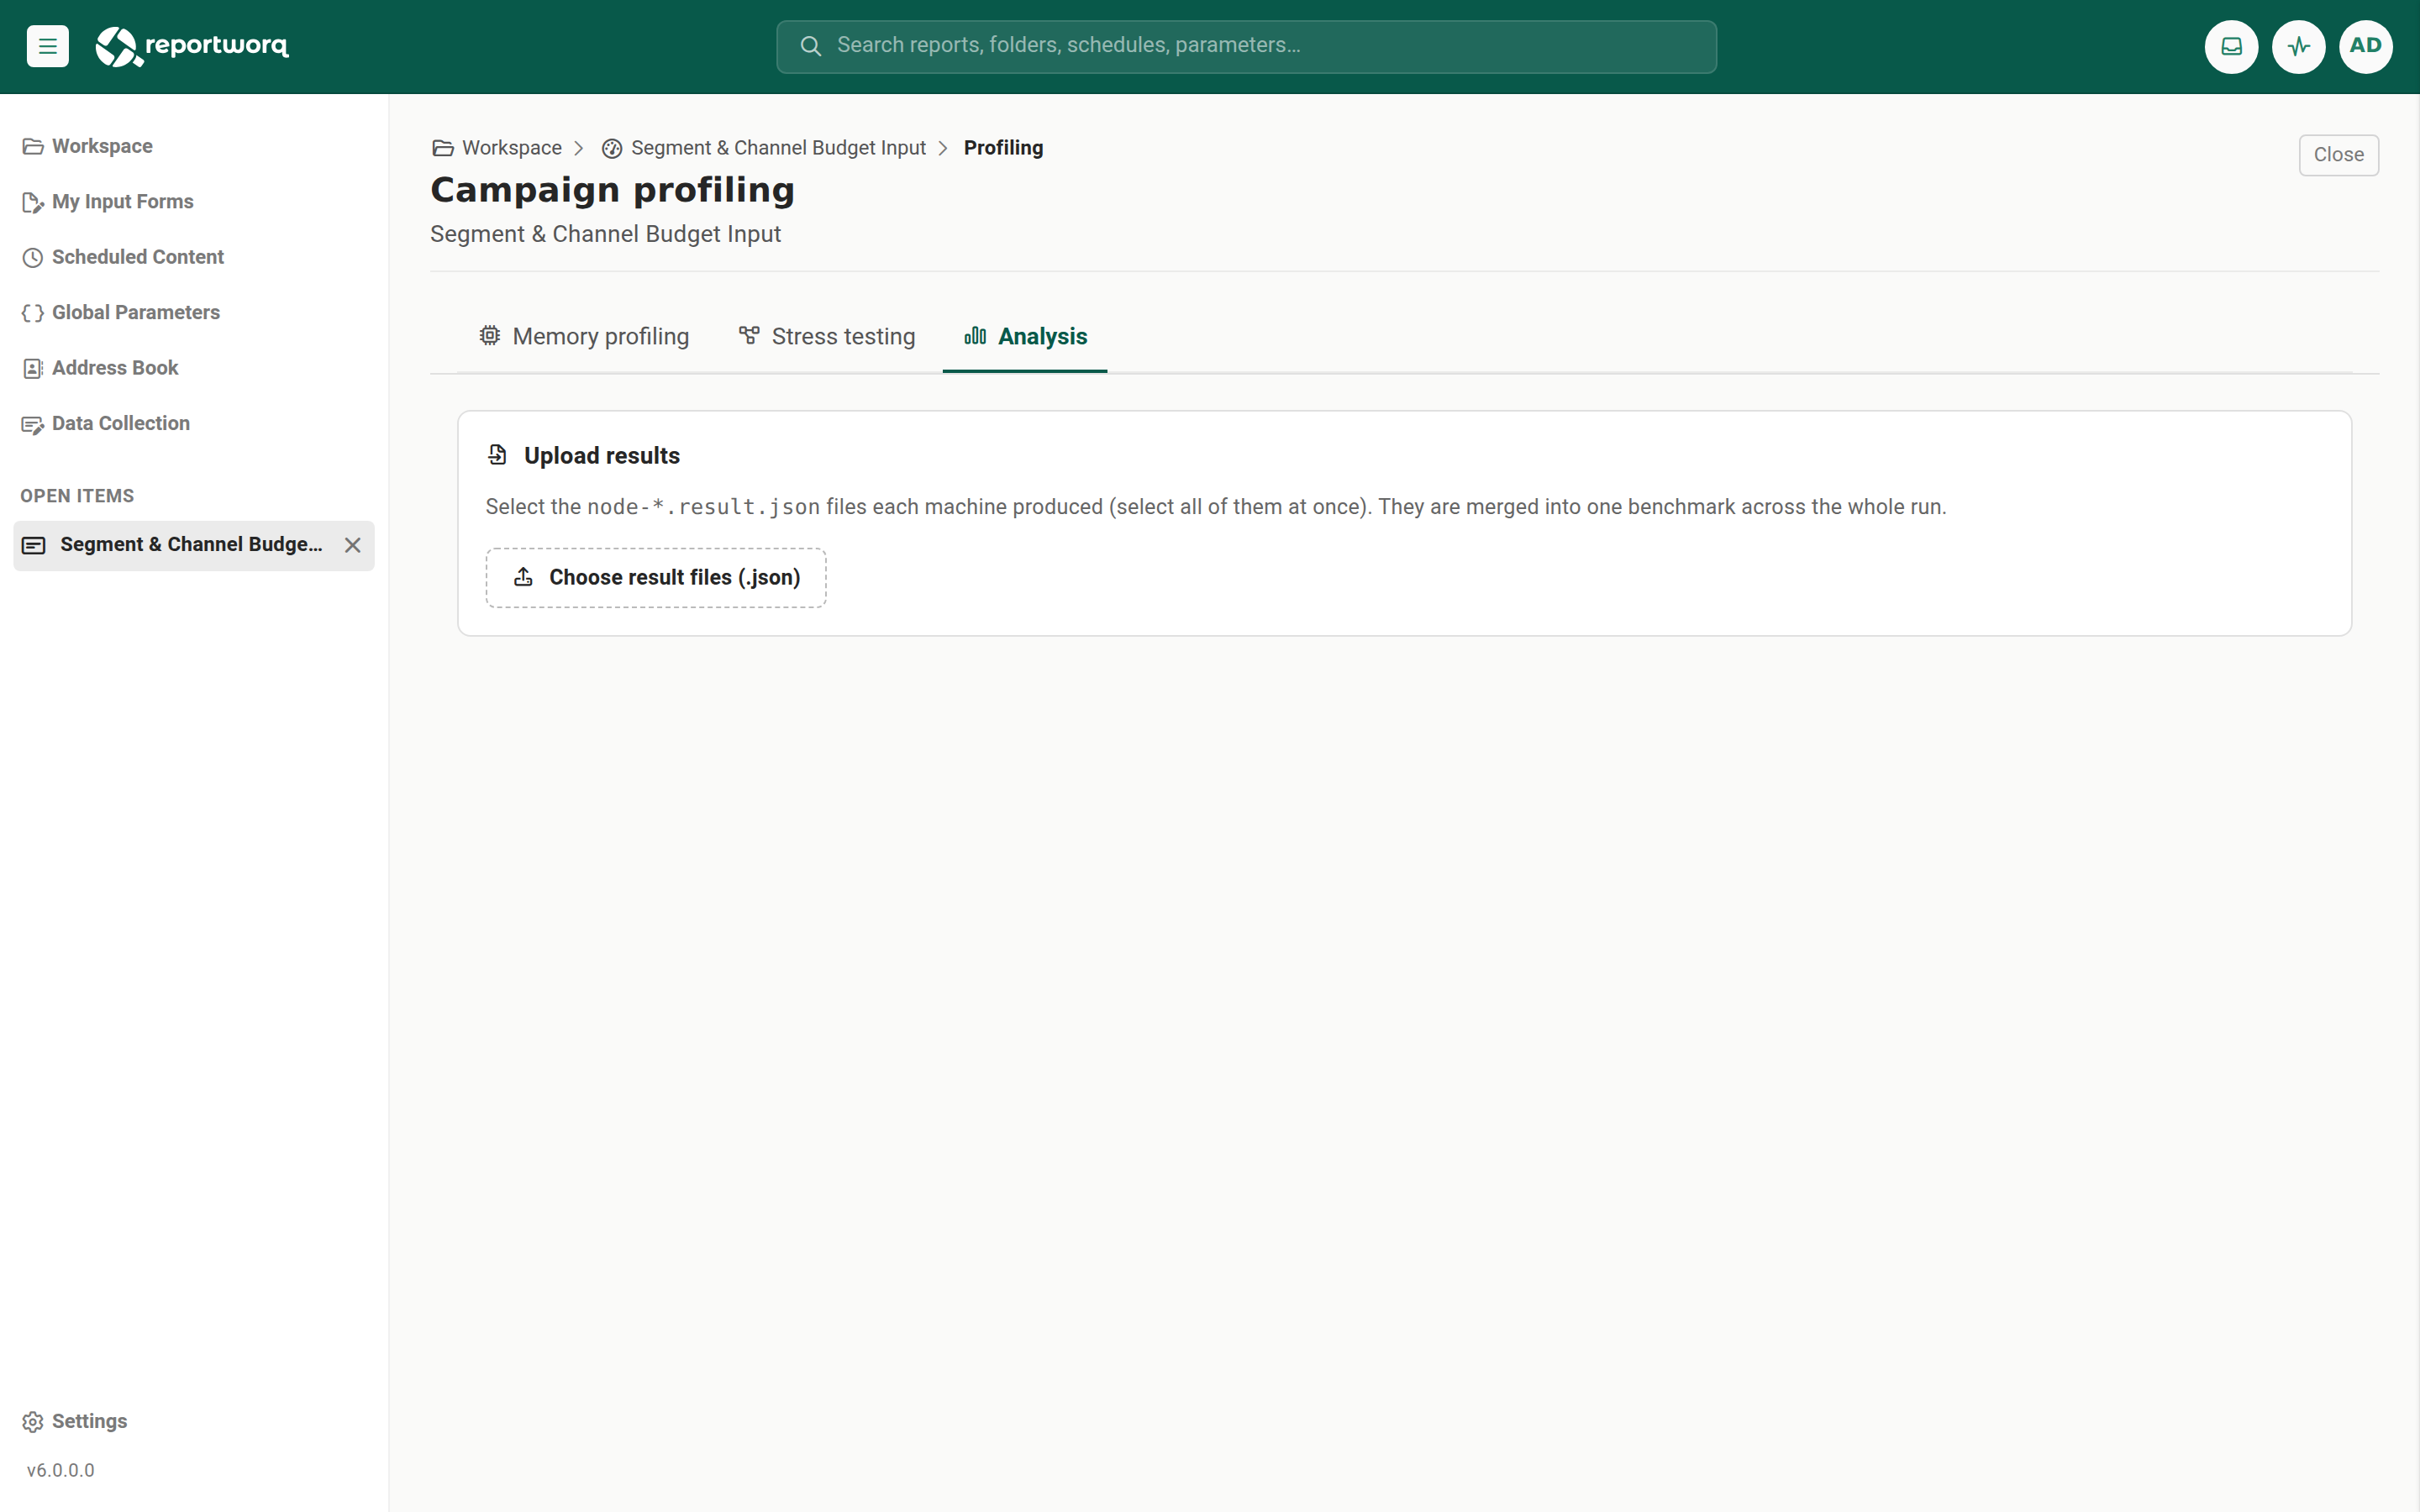
- On the Analysis tab, select Choose result files (.json).
- Select every
node-*.result.jsonfile the run produced, from all machines, at once. They are merged into a single benchmark. Files that are not readable node results are skipped and counted.
Read the report#
Run summary gives the headline scale: Peak concurrent forms (with the average and node count), the number of Forms and users, total Actions and errors, and the Duration with the machines that ran. If the run used more than one login, a note reminds you that best practice is a single dedicated test user, because concurrency is measured per form, not per person.
Findings flags concerns automatically. A slow tail means most users were fine but the slowest few waited much longer; a slowdown means an action got slower as the run went on.
What users experienced is the plain-language read. A short paragraph summarizes the run, and the table reports each action in seconds across three columns:
- Typical is what half of users saw.
- Most users is what 9 in 10 saw.
- Slowest seen is the worst single measurement.
The rows cover the contributor actions: open the form, enter a value, spread, add a comment, recalculate, change worksheet, and submit. These are what a contributor's browser actually experienced end-to-end.
At a glance charts the typical and near-worst time for each action so slow actions stand out. Per-form breaks the key timings down by form, next to each form's size.
For the full percentile breakdown and every raw measurement, select Download details (Excel). The workbook has separate sheets for the summary, the full timings (min, mean, p50, p90, p95, p99, max), the per-form numbers, the findings, and every raw sample. Download JSON exports the consolidated benchmark.
Notes and limits#
- Memory profiling is read-only and never changes campaign state. Stress testing changes campaign state and must run against a disposable campaign.
- Memory profiling and stress plans read a form's generated workbook. A form whose workbook has not been generated is skipped with a reason.
- The memory concurrency estimate reflects the profiling machine, not necessarily production hardware. Use it as a relative guide.
- The rw-stress-runner download is Windows (x64); the load generators are Windows even when the server runs on another operating system.
Related topics#
- Scale and size a contribution campaign
- Author a contribution campaign
- Fill in and submit a form
- Contribution (write-back) overview
Feedback on this page
Comments, questions, requests, or something missing or unclear? Email us - the page you are on is filled in for you.
Email feedback on this pageOr write to support@reportworq.com directly.