
PowerPoint reporting#
Reportworq turns a PowerPoint template into a delivered deck on every run, and, if you want, a PDF companion alongside it. The slide design stays yours. Reportworq refreshes the data-bound content each time the job runs.
The template is not a report source. Your Excel workbooks are the sources, on the Reports step, because they hold the data. The .pptx is chosen on the Distribution step, as part of the PowerPoint output format, because it describes how that data is presented.
A template on its own is only a shell. It becomes a data-driven deck when each slide shape is linked to an object in the underlying Excel report: a cell range, a named range, a chart, or a text box. At run time Reportworq replaces each linked shape's contents with fresh data.
When to use it. Reach for PowerPoint output when your audience needs a formatted presentation, a board deck, an executive review, or a regional pack, rather than a spreadsheet or a PDF report. For tabular or pivot-heavy detail, an Excel or PDF report is the better fit.
Before you start#
- Build the job in Reportworq first. A shape link points at a report object inside a specific job, so the job must already exist and be saved before a template can be linked to it. Work in the order below: sources, then output format and template, then save, then link the slides.
- A
.pptxtemplate reachable through a report provider, typically a network-folder provider. PowerPoint output cannot be generated without a template. - The Excel report or reports whose data the slides will show. These are added as sources on the Reports step.
- The report objects the slides will show, meaning the charts, named ranges, text boxes, and cell ranges, must already exist in those Excel reports. The add-in lists what is there; it does not create objects for you.
- The Reportworq add-in installed in PowerPoint, HTTPS on the Reportworq server, and a signed-in licensed account. See The Office add-ins.
- Sign-in in the same workspace as the job. A job in another workspace does not appear in the add-in's job picker.
Add the Excel sources#
On the Reports step, add the Excel report or reports whose data the slides will show. These are the job's sources. See Choose the source workbook and worksheets.
Do not add the .pptx here. You select it in the next step.
Select PowerPoint as an output format and pick the template#
- Go to the Distribution step.
- Select the PowerPoint output format. Its options sidebar opens.
- Set the Template File with Select a PowerPoint File. This browses your report providers, filtered to PowerPoint files, so you pick the
.pptxdirectly from where it lives. - Adjust the options you need:
- Image Format and PowerPoint Image PPI control how rendered picture shapes are produced and how large the file is. PPI defaults to 200.
- Fit to Width and Fit to Height set the deck-wide default for how an imported picture is sized against the template object it replaces. Fit to Width is on by default. Set one of the two, not both; see Size a picture below for what each one does.
- Sort slides to match worksheet order reorders replicated slides to follow the worksheets they link to.
- Output PowerPoint as PDF also renders the deck to PDF. The shared PDF options (table of contents, page numbers, low-quality mode) then apply.
- Save the job.
Output formats are additive, so a single run can produce the deck, a PDF, and other formats together. See Output formats.
Link the slides to report data#
Links are authored in the Reportworq add-in, which loads a task pane in PowerPoint as well as in Excel. You link a shape in the pane's shape-link editor, and the link is saved on the shape itself.
Connect the deck to its job#
Do this first. A shape link points at a report object inside a specific job, so the add-in has to know which job this deck belongs to before any link can be made. The job must already exist in Reportworq, saved, with its Excel reports added as sources. If you have not built it yet, do that before opening the template.
- Open the template in PowerPoint and open the Reportworq task pane.
- Sign in, if you are not already.
- Select the job this deck reports on. It must be a job in the workspace you are signed in to.
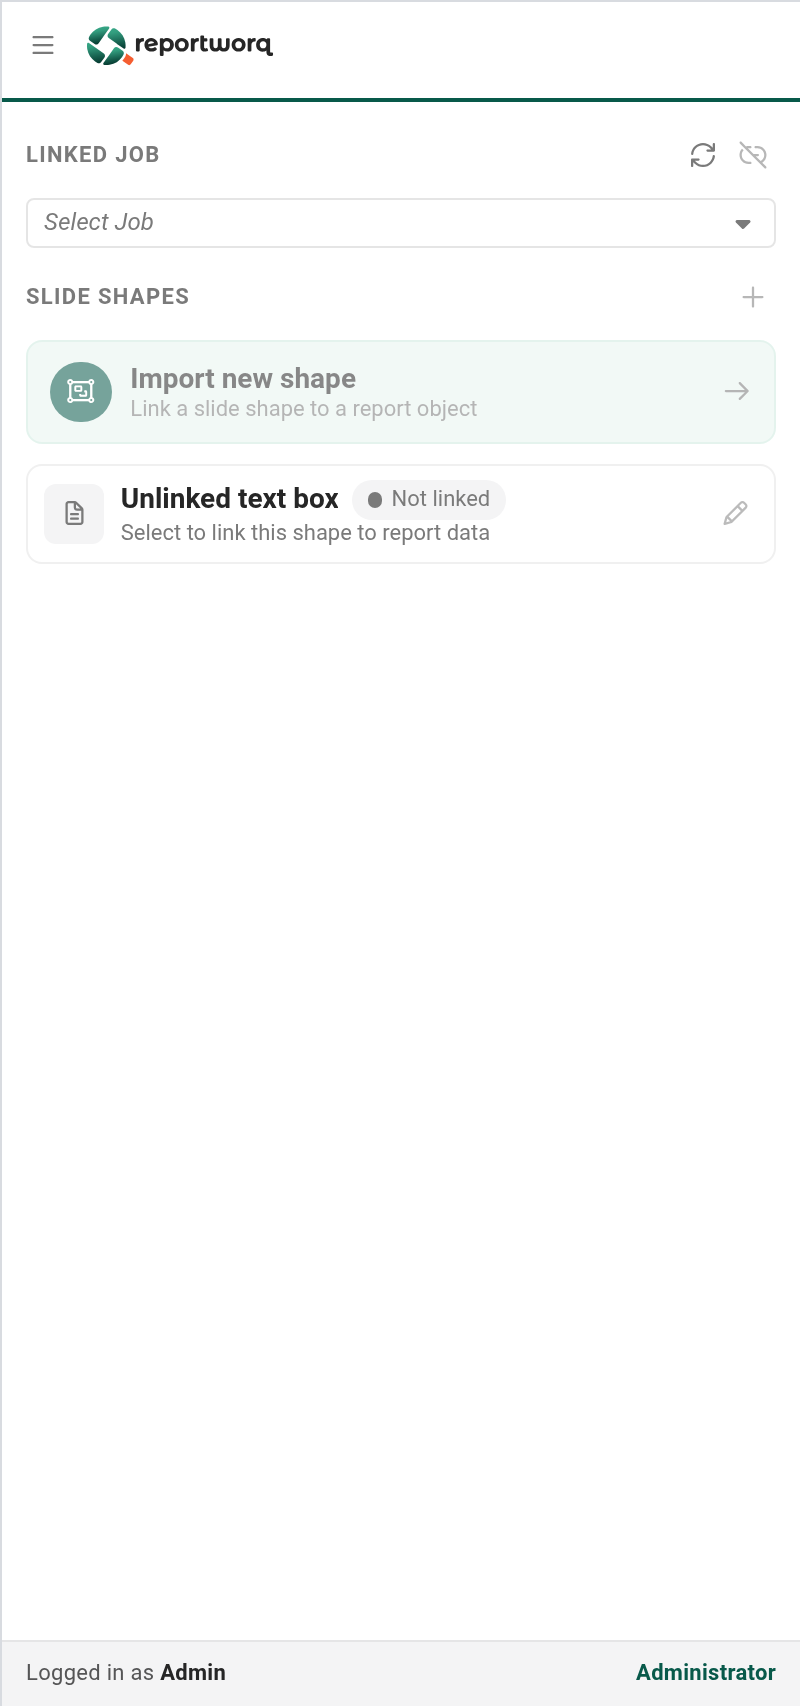
Everything below assumes the deck is connected. If the job picker is empty, check that you are signed in to the right workspace and that the job has been saved.
Link a shape#
The task pane's home view is Manage shapes: the connected job at the top, then a Slide shapes list where each shape carries a Linked or Not linked status chip.
- On the slide, select the shape you want to fill, or choose the Import new shape card under Slide shapes. The editor header reads Import linked shape for a new or unlinked shape, or Edit shape link for one that is already linked.
- Set the Data link. Choose Set the data link to open the picker, then drill through Report › Sheet › Object:
- Report - choose the Excel report.
- Sheet - choose the worksheet.
- Object - choose what to link: Whole worksheet (for an inline text box), a chart, a named range, a text box, or Custom cell range. Choosing Custom cell range reveals a box for an address such as
A1:C10.
- Choose the Shape type, which is how the data lands on the slide: Picture, Data table, Inline text box, or Linked text box. The available types depend on the object you chose. A chart can only be a Picture; a cell range or named range can be a Picture or a Data table; a text box becomes a Linked text box; the whole worksheet becomes an Inline text box. When only one type fits, the pane shows it as a single confirmed choice rather than a chooser.
- Set the Options, each a switch. Which ones appear depends on the shape type:
- Fit to width and Fit to height appear for a cell-range or named-range Picture. See Size a picture below.
- Transparent background appears for any Picture, including a chart.
- Copy source format appears for a Data table or an Inline text box, and carries the source cell's bold and font color onto the slide.
- Choose Import shape.
- Repeat for the other shapes on the slide.
To link a shape you already placed, select it and set its data link the same way. This retrofits an existing corporate template in place rather than rebuilding it.
Tip. Use Refresh Report List (in the shape editor) or Refresh Job List (on the shape list) to reload the worksheet and object lists after you edit the Excel reports. Close the Excel reports first, so the refreshed lists reflect saved content.
Opening an older deck. Decks built before the add-in encode their links in each shape's Alternative Text. Reportworq still reads that format, so those decks keep working. Do not author new links that way; use the add-in.
Size a picture#
A picture shape is rendered from the Excel range or chart it links to, then sized against the template object it replaces. Fit to width and Fit to height decide how.
Set one of the two, not both:
| Setting | The shape on the slide | The picture inside it | Aspect ratio |
|---|---|---|---|
| Fit to width only | Keeps its width, and its height is recalculated to suit the picture. | Sized to the shape's width. | Preserved |
| Fit to height only | Keeps its height, and its width is recalculated to suit the picture. | Sized to the shape's height. | Preserved |
| Both | Does not resize at all. The shape stays exactly the size you drew it. | Stretched to fill the shape's exact width and height. | Not preserved. The picture can look distorted. |
| Neither | Same as Fit to width only. | The job's deck-wide Fit to Width and Fit to Height defaults apply, and if the job sets neither, the picture is fitted to width. | Preserved |
So the choice is which dimension you want to control, and whether you are willing to let the shape move. Pick Fit to width when the shape's width has to line up with the rest of the slide, and accept that its height will change. Pick Fit to height when the shape sits in a fixed-height band and its width can vary.
Turning both on is a different kind of choice, and it is the one that surprises people. It is the only setting that leaves your shape exactly where and as you drew it, which sounds like what you want, but it gets there by stretching the picture to fit rather than by resizing the shape to suit the picture. Use it only when the layout genuinely cannot move and a little distortion is acceptable. If a slide looks squashed or stretched, this is the first setting to check.
Shape settings override the job's defaults, so a deck can fit to width everywhere except the one wide table that needs to fit to height.
Show a value inside a sentence#
An Inline text box links to the worksheet as a whole. Choose Whole worksheet on the Object step of the data link, and mix literal text with variables in curly braces, for example Revenue grew to {Revenue_Total} in {Region}. At run time each variable is replaced with its cell or named-range value. With Copy source format on, the substituted figure also takes the source cell's bold and font color. Use Toggle variables to switch between the tokens and the substituted values while authoring.
If a variable names a range that does not exist, the slide shows RANGE '<name>' NOT FOUND instead of a value.
Test a slide before you save#
While authoring the source template, the pane gives you per-slide and per-shape actions:
- Refresh slide repopulates every linked shape on the active slide from the report.
- Clear slide replaces linked data with placeholders, which is useful for finding which shapes are live.
- Refresh data and Clear data do the same for a single shape, in its Actions section.
- Reset shape reverts a picture to its original size.
How slides replicate when you burst#
When a parameter fans a source worksheet into several copies, each slide linked to that worksheet replicates into one slide per item, carrying that item's data. Adjacent slides that share the same replicating worksheet replicate together as a group, repeated in sequence, so each recipient gets their block of slides.
A single slide may draw from more than one worksheet, but only one of those worksheets may be the replicating one. If a slide links two replicating worksheets, generation fails rather than producing an ambiguous deck.
A PowerPoint report bursts and distributes through the same pipeline as an Excel report: one deck per burst slice, to the configured destinations. See Replicate output from your source system.
Let recipients refresh or run the deck (optional)#
Refreshing or re-running a delivered deck happens in the PowerPoint add-in and requires a signed-in Reportworq account. A plain recipient who only receives the deck needs nothing. Two permission gates in the PowerPoint options control what is possible:
- Allow PowerPoint user to refresh presentation output lets a recipient pick a job-history version and refresh the deck from it.
- Allow PowerPoint user to run Job governs the on-demand run affordance. It is available only when Allow ... refresh is also on, and it clears automatically if you turn refresh off.
The two options do different things, and the difference is worth being clear about:
- Refresh rebuilds the deck from a run that already happened. The recipient picks a version from the job's history and the slides are repopulated from that run's output. Nothing is re-queried.
- Run Job starts the Reportworq job. The job goes and gets fresh data the way any run does, and the recipient then sees the output of that new run. Run is offered only to an Author or an Administrator. A recipient holding a User license never sees it, even when the job option is on.
So a recipient never reaches into your data source from PowerPoint. They either re-render a stored run or, if they are an Author or Administrator, ask Reportworq to run the job.
In the add-in, someone opening a delivered deck can:
- Select Job History and pick which generated version to refresh from.
- Refresh slide or Refresh presentation to repopulate from that version.
- Download the deck as Reportworq generated it, without their own local edits.
What appears in that history list is governed by the same permissions as the rest of Reportworq: a person sees history only for a job they are allowed to view, and only the output variations their secured lists allow.
Refreshing always loads from a job-history version, never the live data source in real time. To see current data, someone must run the job to produce a new history record. Each run emits a PowerPoint Datasource.xlsx companion file alongside the deck, and that file is what powers the refresh actions.
Notes and limits#
- A template is required. There is no headless PowerPoint output without one.
- One replicating worksheet per slide. A slide may source several worksheets, but only one may be the fanned-out (replicating) one, or generation fails.
- Refresh is always from job history, not live data. Both author-side and recipient-side refresh read a saved version.
- Deleting a job-history entry removes its refresh data. If a history version, or its PowerPoint Datasource.xlsx, no longer exists, the refresh actions for it disappear.
- Inline text boxes are re-evaluated only on a full run, or through Toggle variables. Refresh slide and Clear slide do not touch them.
- Fit to width and Fit to height apply to pictures built from a cell range or a named range. A chart picture offers only Transparent background.
- The Report Viewer presents PowerPoint output through a Slides thumbnail rail rather than an inline document view. See View and download results.
Going deeper. A script stage runs after the deck is generated and before it is delivered, with the whole presentation available to it. Use it to stamp footers and slide numbers, remove draft slides, or replace text tokens on the slides. See The Script Runner.
Related topics#
- Choose the source workbook and worksheets
- Output formats
- The Office add-ins
- The Script Runner
- Replicate output from your source system
- View and download results
Feedback on this page
Comments, questions, requests, or something missing or unclear? Email us - the page you are on is filled in for you.
Email feedback on this pageOr write to support@reportworq.com directly.