
Excel: build and refresh reports#
The Reportworq add-in puts a task pane on the right of the Excel grid, the companion pane. This page covers the reporting side of it: getting governed data onto a worksheet and keeping it current.
When to use it. Reach for the add-in when you want source-system data in a layout you control and refresh on demand, rather than authoring a full template-based job on the web.
Before you start#
- The shared prerequisites in The Office add-ins.
- A data model with at least one published view, or a direct-query-enabled model, that you are permitted to see.
Reports are built against a data model, not a raw connection#
This surprises people, so it is worth stating plainly: the add-in cannot connect to a raw datasource. There is no "pick a database and write SQL" path in the pane. Everything you report on in Excel comes from a data model.
A data model is a governed, curated layer an administrator or author builds over a connection: it selects the tables or cubes worth exposing, renames technical columns into business field names, applies filters, and publishes one or more views over the result. A view is a named, ready-to-use field set.
That indirection is the point:
- Field names make sense. A report author picks Cost Center and Actual Amount, not
dim_cc.cc_codeandf_gl.amt_base. - The curation is done once. Everyone reporting against that model gets the same definitions, so two reports cannot quietly disagree about what a field means.
- Permissions are governed centrally. You only see the models and views you are allowed to see, and the model owner controls what is exposed at all.
- The underlying source can change without every workbook breaking, because the model absorbs it.
So the first question when someone cannot find their data in the add-in is not "is the database connected" but "is there a published model view for it, and can this user see it". To create or publish one, see Data models.
Find your way around the pane#
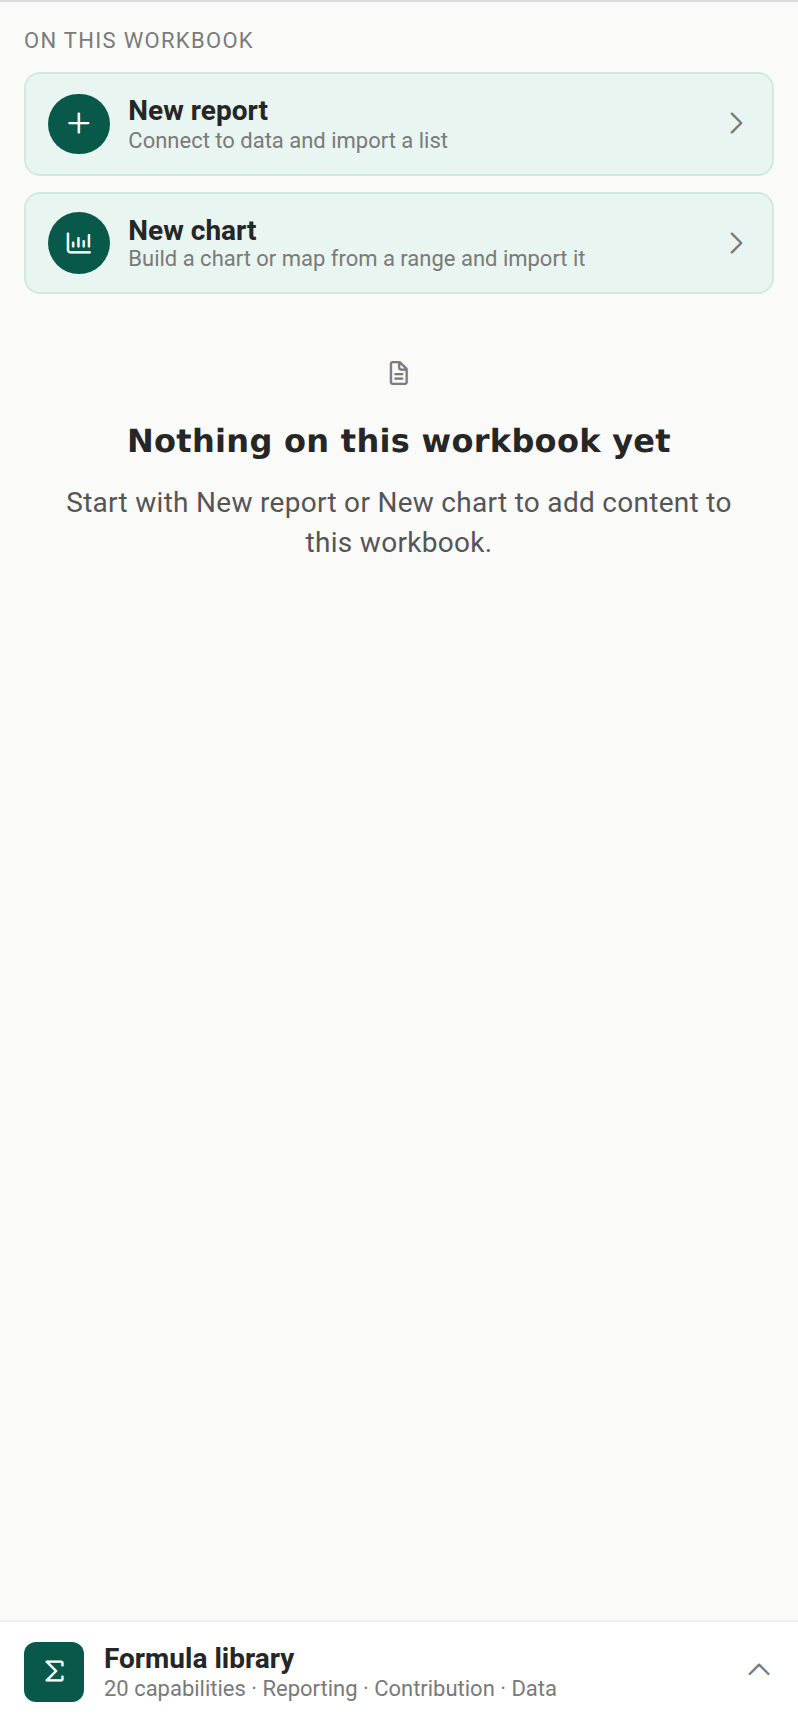
- Home lists the reports stored on the active workbook, grouped by worksheet, each with a refresh control. Per-report actions are Edit, Refresh, Clear Data, Move Report, and Delete, plus workbook-level Refresh all data and Clear all data.
- New report launches the import stepper.
- New chart launches the chart and map builder, see Excel: charts and maps.
- The Formula Library dock is pinned at the foot of the pane, see Excel: find and insert functions.
Editing a report saves continuously as you move between screens; there is no Save button. Refresh is the one explicit action that writes data into the worksheet.
Import a published data-model view#
- On Home, choose New report to open the Connect > Fields > Place stepper.
- Connect. Browse Workspace > Folder > Data Model > View and pick a view (a predefined field set) or a model (which adds a Query step for an ad-hoc query). Only models and views you are permitted to see appear.
- Fields. Select which fields become columns. Switch to Arrange to reorder, rename, hide, and configure them.
- Place. Set the target cell or range (type an address or use Select Range), and optionally import as an Excel Table, choose an Insert Behavior, auto-resize columns, or update a named range.
- Choose Import to {cell}. Reportworq runs the model, writes the result, returns you to Home, and adds the report to the list.
Three placement rules are worth knowing before they bite:
- A named range you point at with Update named range must already exist. Reportworq does not create it.
- That named-range update takes effect when the report runs as a job, not on an in-Excel refresh.
- Max Preview Rows caps only the in-Excel preview. It does not limit what the job renders.
Shape the list report#
Within the Fields step, open any column to configure it in the field editor.
| Control | What it does |
|---|---|
| Display mode | Normal, Group (collapse repeated values down the column), or Section (a section break with its own sorting and layout). Only one field may be a Section at a time. |
| Sort | A sort mode, plus a priority when more than one field sorts. |
| Aggregate | Sum and Average on numeric columns; Min and Max on numeric or date columns; Count and Count Distinct on any type. |
| Filter | An operator and a value: a numeric literal such as >=5, single-quoted text such as 'North', or a variable such as {{Region}}. Combine rows with AND/OR. |
| Formatting | Header, Data, and Subtotals, each with its own format mode. |
Two habits pay off. A hidden field (the eye toggle) still filters and sorts without appearing in the output, which is how you filter on something the reader should not see. And selecting only the fields you need reduces the work the datasource does, which is the cheapest performance win available here.
Filters that follow a parameter#
The {{Variable}} filter form is what connects an add-in report to the rest of Reportworq. Filter a column on {{Region}}, and when the report runs as part of a job the value comes from the job's parameter, so the same workbook produces a different slice per region. See Parameterize a report.
Refresh a report#
- The first refresh of a report must be from source, which runs the query.
- From cached re-renders from the last query result. Fewer queries, faster, and the right choice while you are adjusting layout.
- Clear all data removes a report's column data but keeps its headers, which come back on the next refresh.
Notes and limits#
- The pane is a narrow single-column surface, not a full-page editor. It does not replace the web Job Editor for bursting, distribution, or scheduling.
- A data model is required. There is no connect-to-raw-datasource path in the add-in.
Going deeper. An imported list report is one of two ways to put source data on a sheet. The other is a Reportworq worksheet function written straight into a cell. For how the two compare and the full function catalog, see Functions overview. To find and insert a function without leaving Excel, see Excel: find and insert functions.
Feedback on this page
Comments, questions, requests, or something missing or unclear? Email us - the page you are on is filled in for you.
Email feedback on this pageOr write to support@reportworq.com directly.