
Build a view with the designer#
On a SQL datasource, a data model view is built on the Design tab. You pick the table the view is about, tick the columns you want as fields, and follow a column's link to add a related table, for example the sales rep and product behind each invoice line. Reportworq writes the joins for you and keeps the view's fields in step as you work. When a view needs something the designer cannot express, you write it as SQL instead.
This page applies to SQL datasources: SQL Server, OLE DB, ODBC, SQLite, Excel, the Reportworq content store, and the CData-based sources such as QuickBooks Online and Salesforce. Other connectors, such as Planning Analytics, keep their own Connection tab; see the page for your connector.
The examples use the Timberline Harvest Co. demo database, where sales_journal holds one row per invoice line and links to dim_employee, dim_product, dim_market, and dim_channel.
Before you begin#
- A data model bound to a SQL datasource. See Data models.
- Optional: any relationships your database does not declare, added to the model. See Table relationships.
Start the view#
Open the data model and select Add View. The new view opens on its Design tab with an empty canvas.
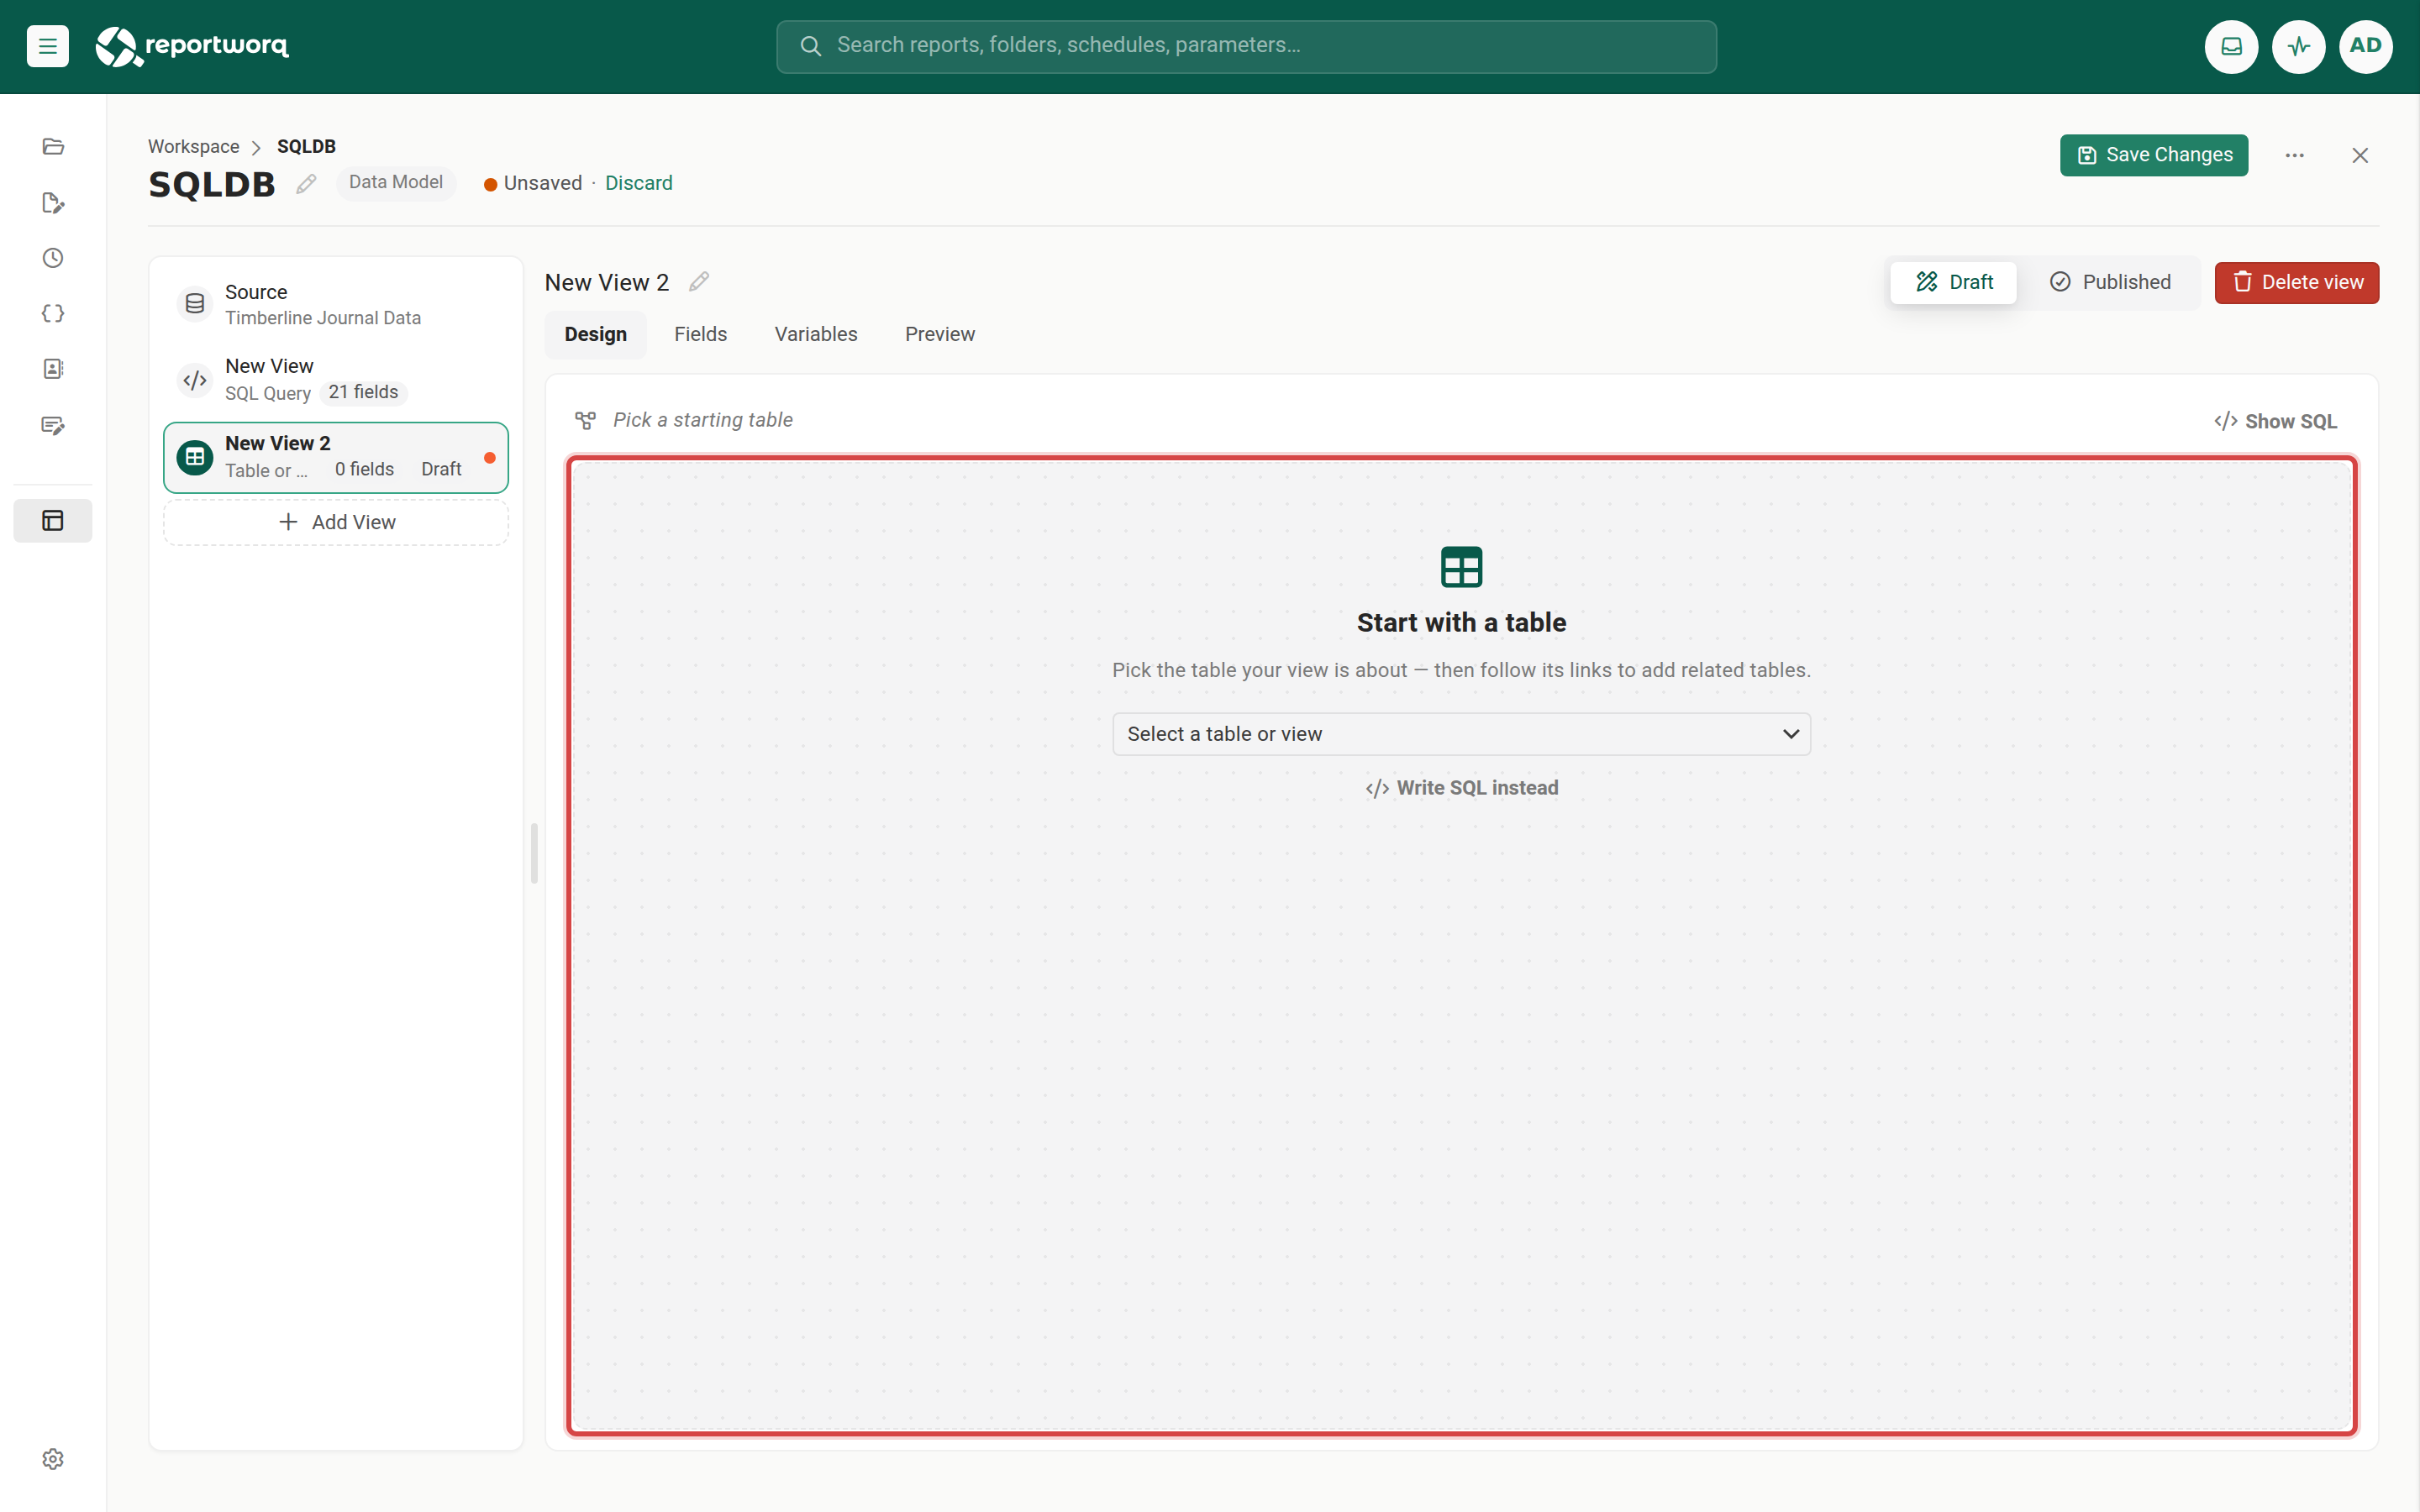
A new view's Design tab showing Start with a table, a table picker, and Write SQL insteadTap or click the image to view it full screen Under Start with a table, select the table the view is about, for example
sales_journal. Choose the table whose rows you want one report row for: the view keeps one row per row of this table.
In the rail the new view reads Table or View, with 0 fields and Draft beside it until you tick columns; once the canvas holds more than one table the rail reads Joined view and the table count, for example Joined view · 4 tables.
The table appears on the canvas as a card labeled Starting table, with every column ticked. A new view takes the table's name; rename it with the pencil beside the view name.
Choose the fields#
Each ticked column is a field of the view. Fields are added and removed as you tick, so the Fields tab and the field count in the rail are always current.
- To start from a short list, clear the checkbox in the card's header row, which clears every column, then tick the columns you want.
- To find a column in a wide table, type in the Search columns box at the top of the card.
- The order you tick columns in is the order of the fields.
Unticking a column that a saved view already used does not delete its field. The field stays on the Fields tab, marked unmapped and left out of the view, so you can point it at another column or delete it yourself.
Add a related table#
A column that holds another table's key shows that table's name, with an arrow, in the Related table column of the card.
- Select the related table's name, for example dim_employee beside
sales_rep_id. The table opens as a new card to the right, joined to the starting table. - Tick the columns you want from it. Reportworq ticks the related table's name column for you when it can tell which one that is, for example the rep's name; clear it if you do not need it.
- Optional: follow a link from the new card to go further, for example from
dim_employee'sterritorytodim_marketto add the rep's region.
Fields from a related table are named after the link, so name from the sales rep becomes sales_rep_name, and region reached through the rep's territory becomes sales_rep_territory_region. Rename them as you like; see the next section.
How the designer joins tables:
- Every row of the starting table stays in the view. A related table is added with a left join, so an invoice line with no matching rep still appears, with the rep's fields empty.
- Links are followed from a key to the table it identifies. Each invoice line has one rep, so adding the rep never repeats an invoice line. The designer does not offer the other direction, such as every invoice line for a rep; use a SQL view for that.
- A table is only joined when you use it. A card you open but take no fields from is not part of the query.
- Some links are blocked. A table already on the path back to the starting table cannot be added again, a path is at most four tables long, and a view can join at most 20 tables. A blocked link shows a no-entry icon; hover over it to see why.
To remove a related table, and every table opened from it, select its name in the Related table column again or select the close button on its card. Start over clears the whole canvas, including the fields it created, so you can pick a different starting table.
A column that can point to more than one table, such as the Name_Id column of a QuickBooks Online report, which can hold the id of a customer, a vendor, or an employee, shows a list instead of a single name. Open each table you need from the list.
Shape each field on the canvas#
A ticked row is the view's field, and you can shape it without leaving the canvas. The controls appear when you hover over the row, and a control that is in effect stays visible.
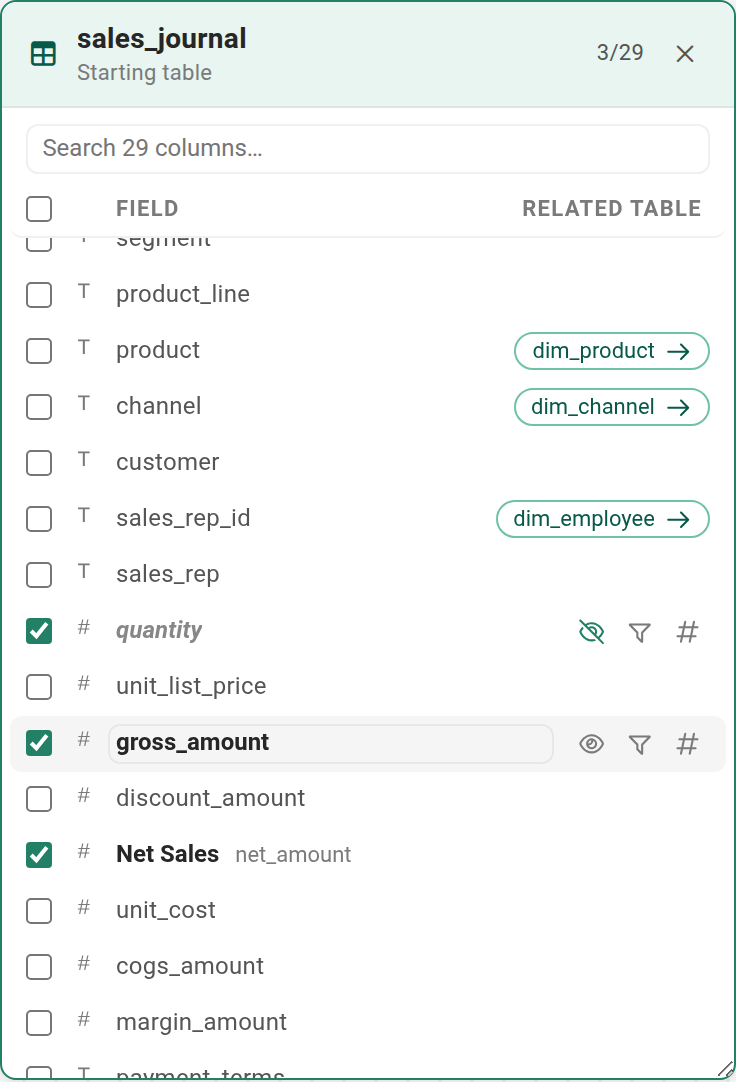
- Rename. Select the field's name, type the new name, and press Enter. The source column's name stays visible beside it. Field names must be unique within the view.
- Hide from reports. Select the eye. A hidden field is still queried, so it can drive a filter, but report authors do not see it.
- Filter. Select the funnel to add a condition to the field. The funnel turns solid while a condition is set.
- Type and format. Select # to set the field's type and display format.
These are the same settings as the Fields tab, which also lets you reorder, add, and delete fields.
Check the SQL#
Select Show SQL to see the query the designer generates. The panel is read-only and follows the canvas as you change it.
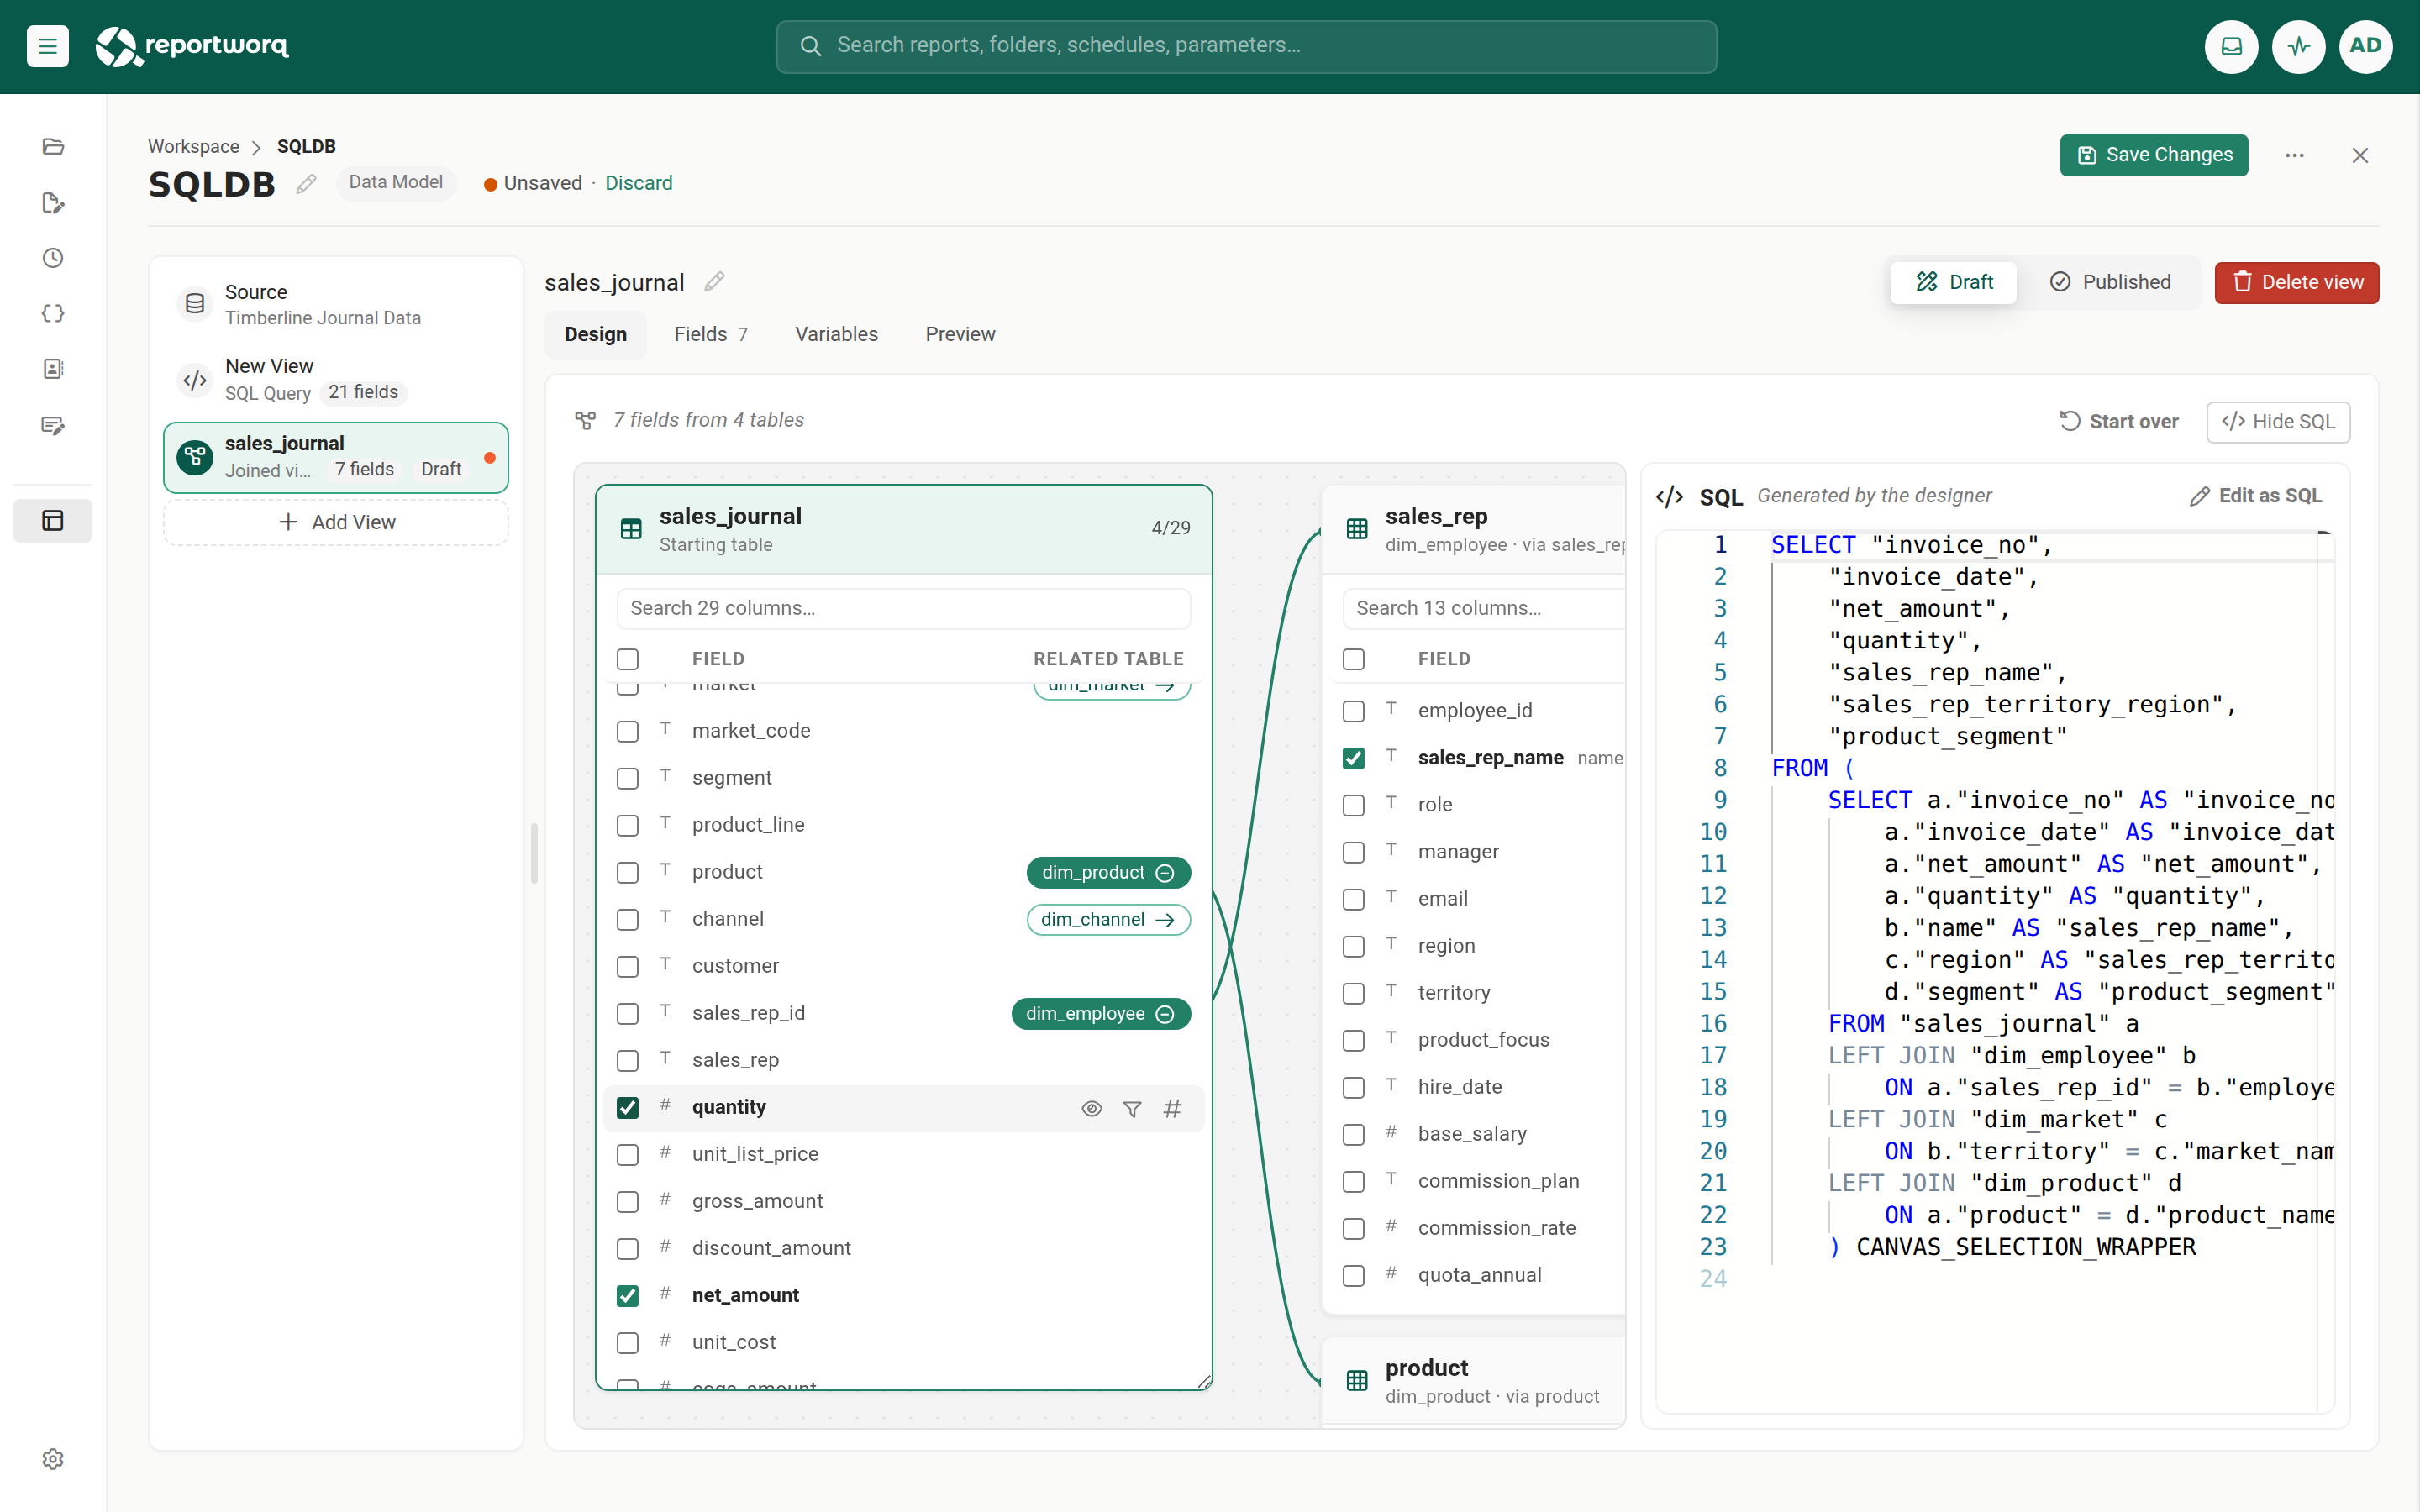
To take the query further by hand, select Edit as SQL. The view becomes a SQL-only view that starts from the generated query.
Warning: Edit as SQL cannot be undone. The designer does not read SQL back, so a view converted to SQL stays a SQL-only view. Keep building on the canvas for as long as the designer can express what you need, and convert only when you must.
Write the view as SQL instead#
Write a view as SQL when it needs something the designer does not do, such as totals, a union of tables, an inner join, or every child row of a parent.
Select Add View.
On the empty canvas, select Write SQL instead.
Enter the query in the SQL editor. Use Format to tidy it.
To let reports supply a value at run time, put a
{{variable}}in the query. A text value that lands in a SQL string needs its own quotes, for exampleWHERE market = '{{market}}'.If the query has variables, enter a sample value for each under Connection values. Reportworq needs a value to run the query and work out the view's fields.
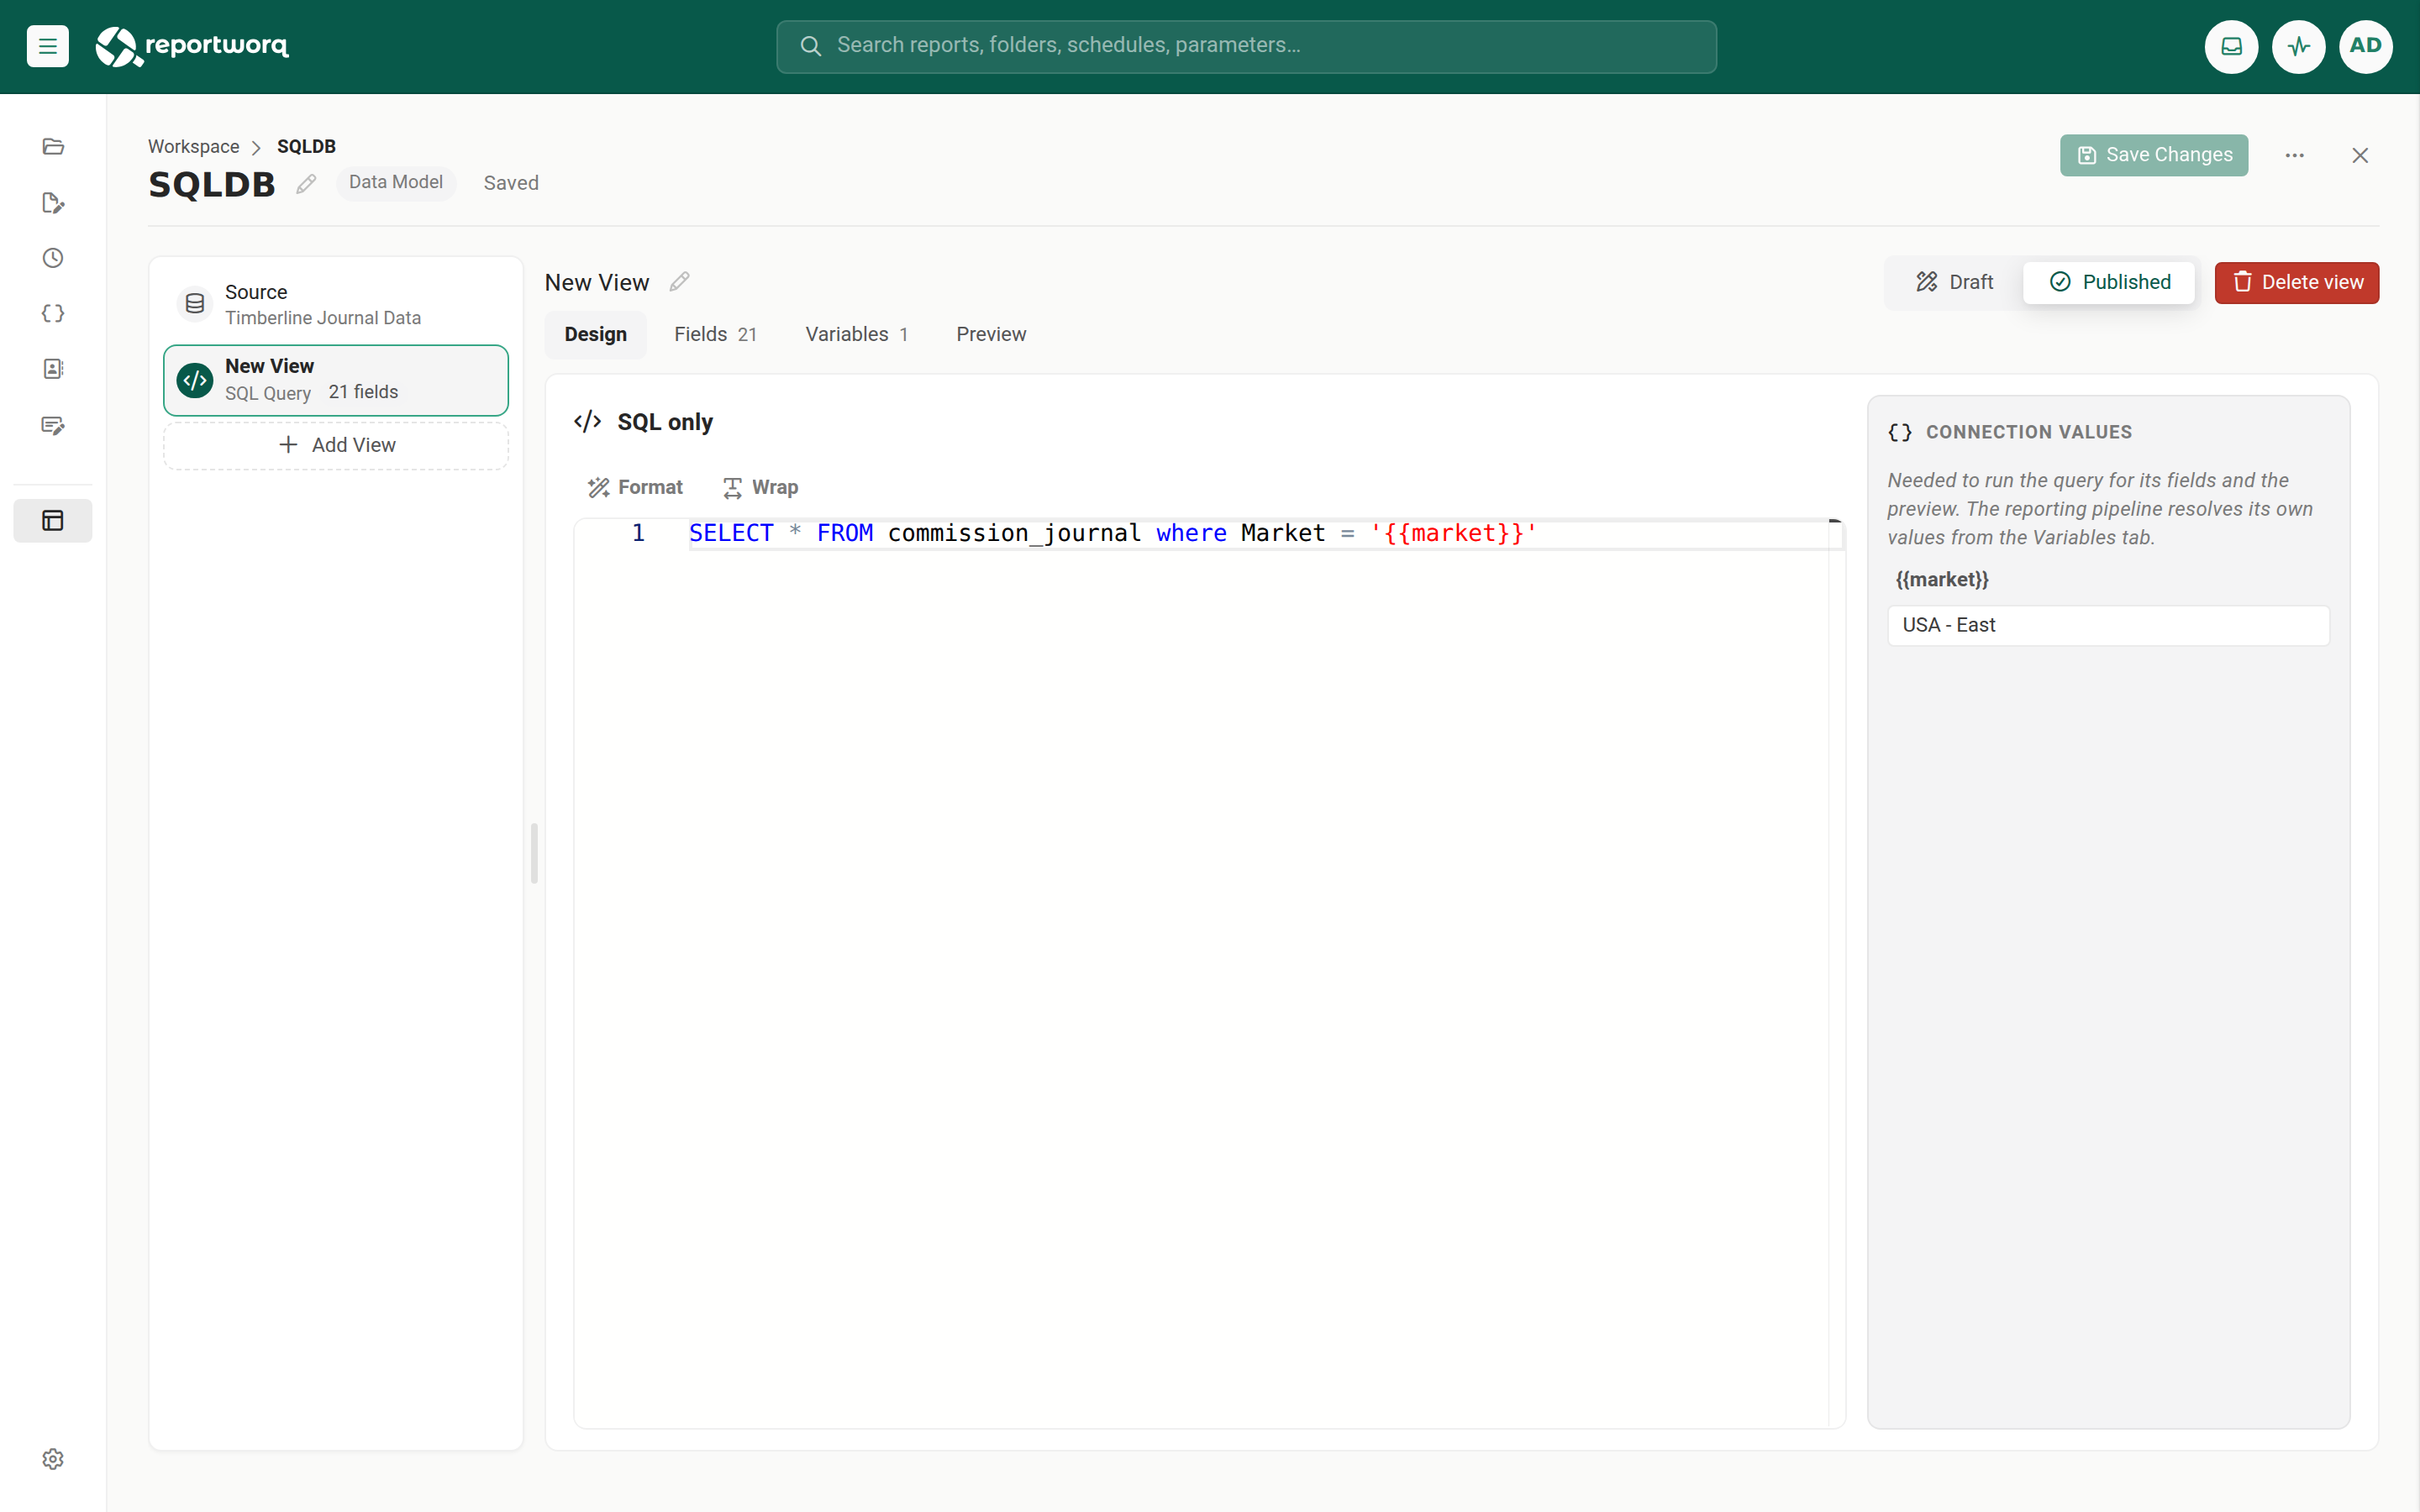
A SQL-only view on its Design tab, with the Connection values sidebar holding a sample value for marketTap or click the image to view it full screen Select the Fields tab. Reportworq runs the query and builds the field list from its columns.
The Design tab of a SQL-only view is labeled SQL only, and the rail reads SQL Query for it. Each time you change the query and leave the tab, or save, the fields are brought up to date; a new column becomes a new field, and a field whose column has gone is marked unmapped.
Preview the view#
- Select the Preview tab.
- Choose how many rows to fetch: 10 rows, 100 rows, 1,000 rows, or All rows. The default is 100.
- If the view has variables, the Variable values pane is open on the right. Enter values for this preview; they do not change the view's defaults, and Reset to defaults puts the defaults back.
- Select Run preview. After the first run the button reads Refresh.
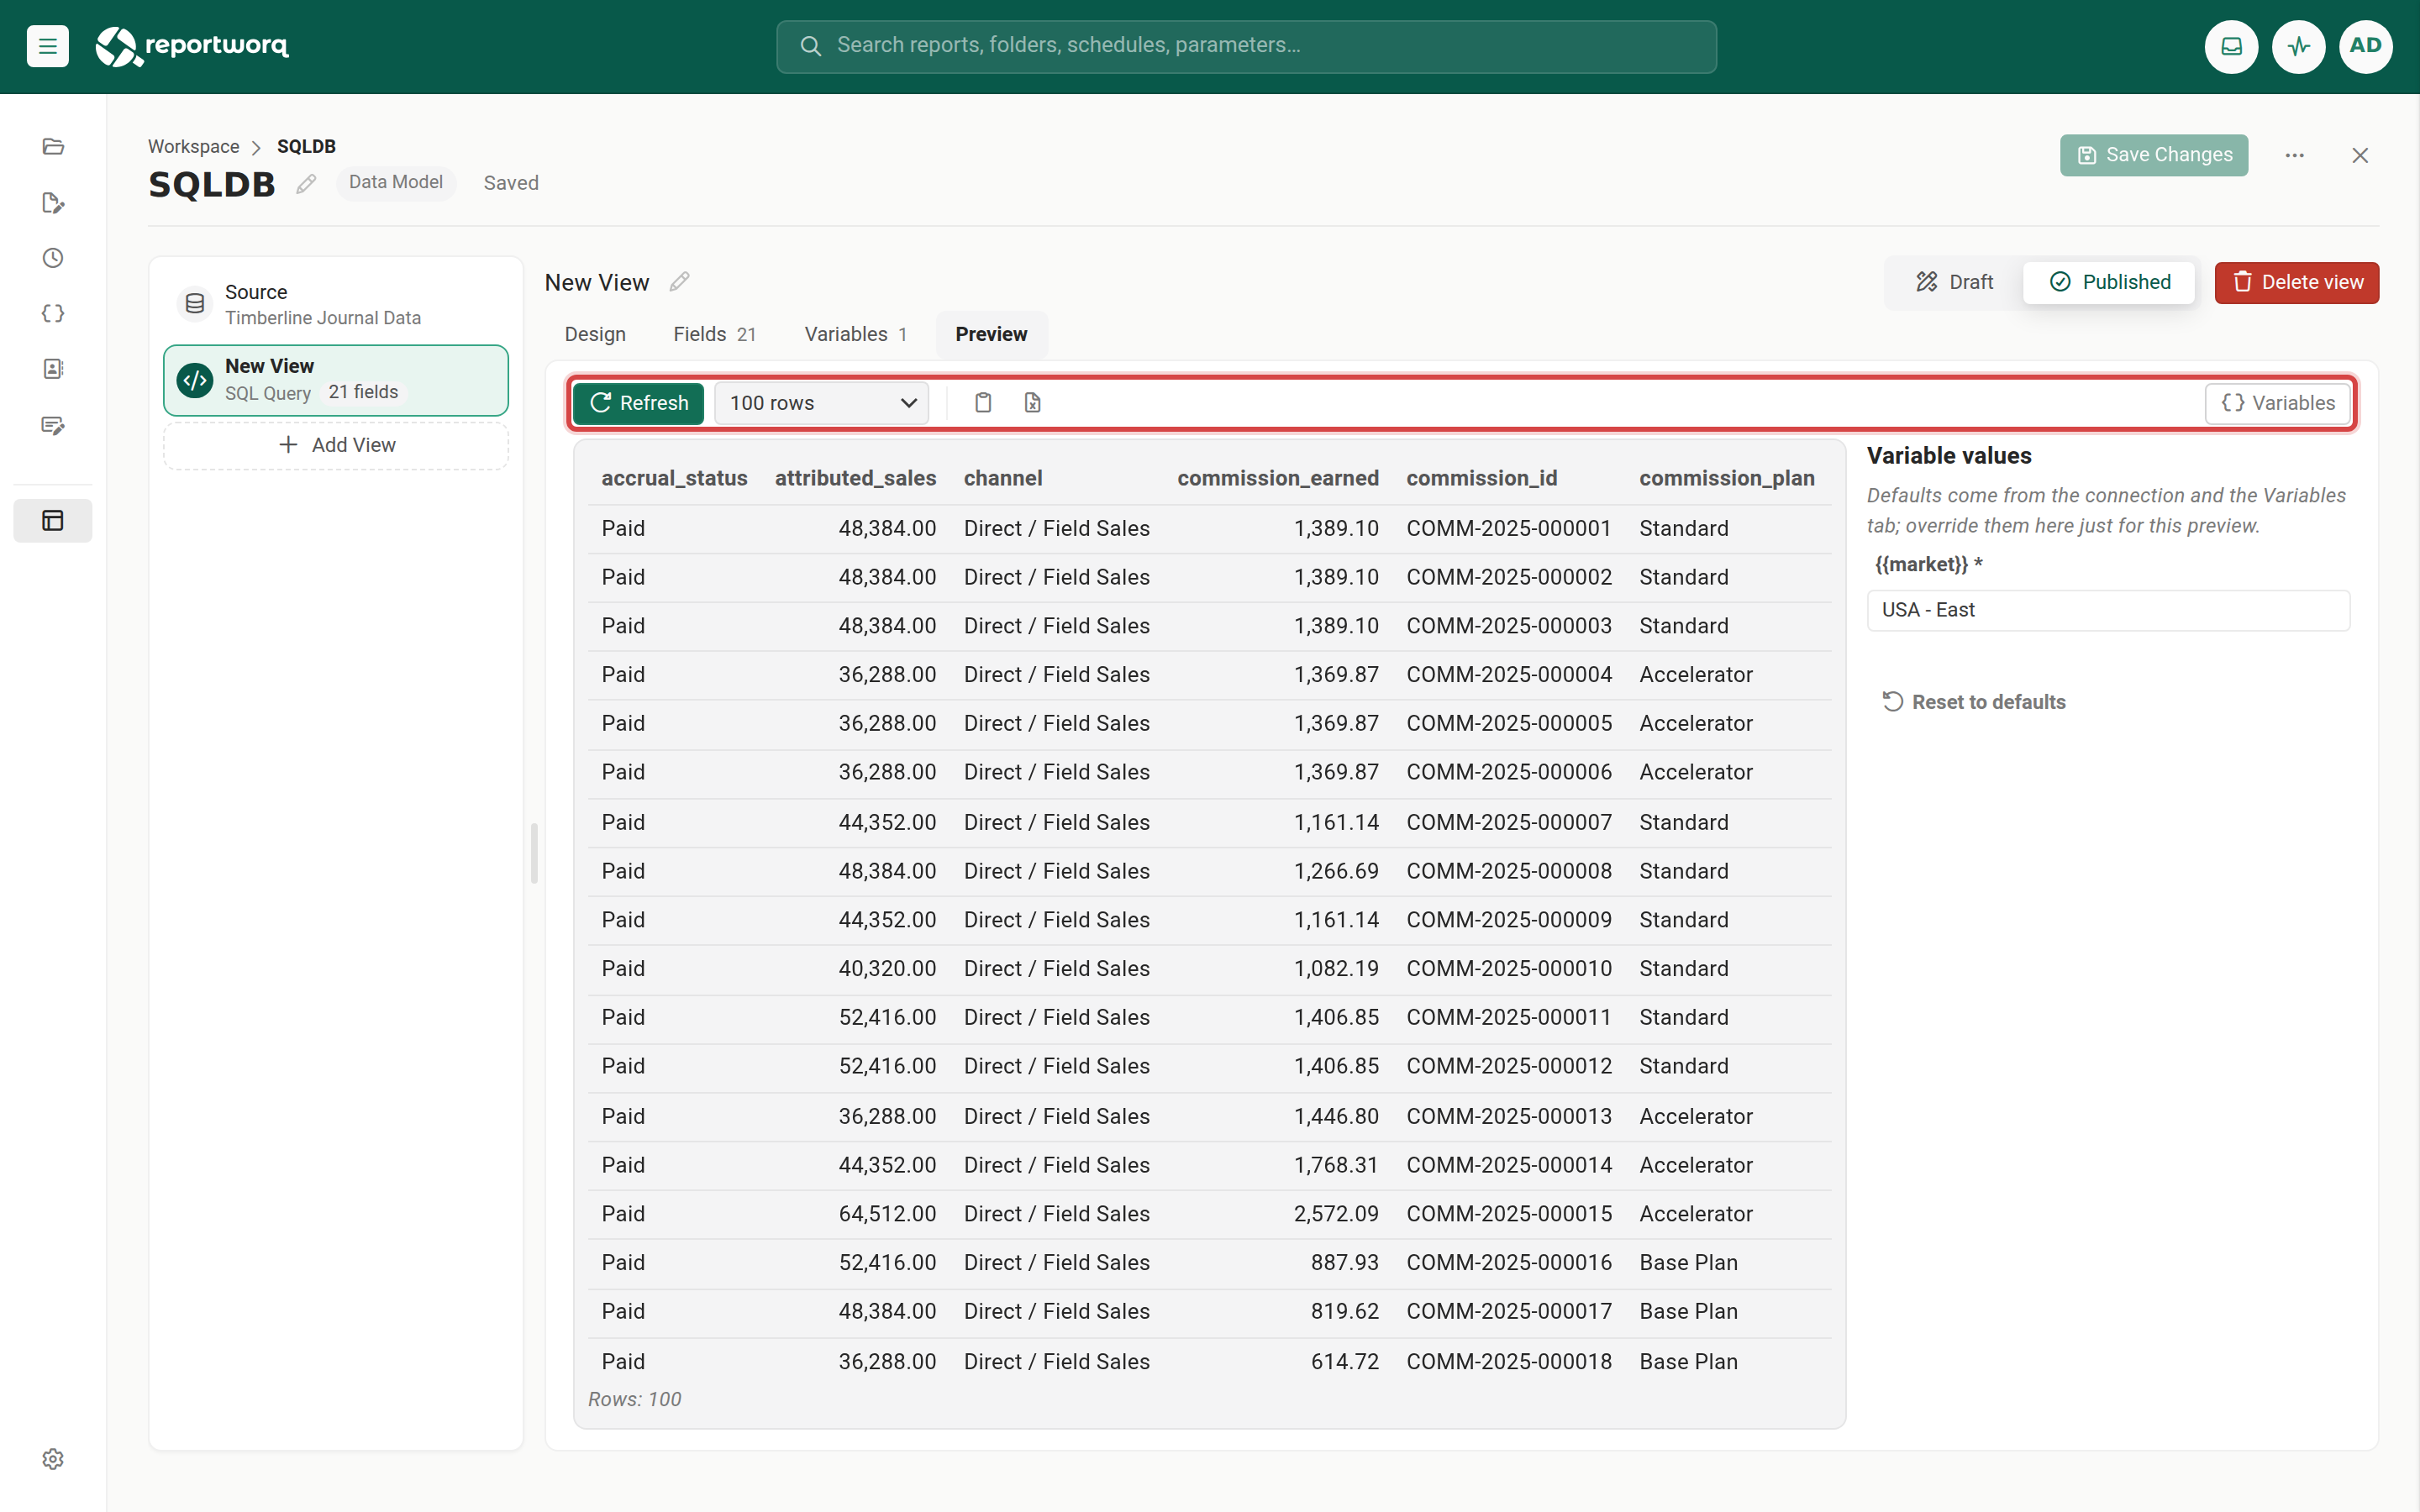
From the toolbar you can copy the rows with a header row, ready to paste into Excel, or download them as an Excel workbook. The Variables button shows or hides the pane; it is unavailable when the view has no variables. The grid shows up to 5,000 rows; a copy or a download includes every row fetched.
A preview keeps its last result while you work, so you can switch to Design, adjust the view, and come back to compare before you select Refresh.
Save the view#
Select Save Changes to save the model, including every view and any relationships you added. A new view starts as Draft; switch it to Published when report authors should see it. See Publish a view.
Troubleshooting#
| Symptom | Cause and fix |
|---|---|
| The view reads "Fields may not match the query yet" | The query could not run when you left the tab or saved. Read the warning that appeared, fix the query or enter the missing sample value under Connection values, then change tab or save again. |
| A column has no related-table link you expected | The database does not declare that link. Add it as a manual relationship on the model's Source screen. See Table relationships. |
| A related-table link shows a no-entry icon | The link would loop back to a table already on the path, go deeper than four tables, or pass 20 tables. Hover over it for the reason. |
| Preview warns "No value for required variable(s)" | Enter a value in the Variable values pane, or set the variable's default on the Variables tab. |
| An older view opens as SQL only with an empty editor | It was built with the earlier query composer in a way the designer cannot show, for example with an inner join. Select Use the designer to see why. The view still runs as saved. |
Related topics#
Feedback on this page
Comments, questions, requests, or something missing or unclear? Email us - the page you are on is filled in for you.
Email feedback on this pageOr write to support@reportworq.com directly.