
Bring several sources into one model#
Early release. This feature is in early release, so its screens and behavior may change. Tell us what you think with Send feedback. See Early release features and Send feedback.
A data model can read any number of sources at once. A source is either a connection from Integrations (a SQL database, IBM Planning Analytics, a SaaS system) or a workspace file (an Excel workbook or SQLite database that lives in the same workspace as the model). You can mix both kinds, so actuals from a database, a forecast from a planning cube and a lookup workbook can feed one model, and report authors see them as one list of views.
When to use it. Put sources in one model when people will report on them together or pick from them in the same place. At Timberline Harvest Co., the Sales Journals model reads the TransactionDetails workbook. Add the Timberline Journal Data database and the TM1 connection to the same model, and a joined view can set invoiced sales beside a planning forecast. If two sources have nothing to do with each other, two models are tidier: each model has its own folder permissions, its own variables and its own list of views.
Before you start#
- You can author data models in the workspace. Open a model with Edit from its row in the workspace, or create one with New > New Data Model.
- For a connection: an administrator has added it in Integrations, it is enabled, and it is available to this workspace. See Connect a data source.
- For a workspace file: an Excel workbook (
.xlsx,.xlsm) or SQLite database (.db,.sqlite,.sqlite3) that you can see in the workspace. See Build a data model from a workspace file.
Add a second source#
- Open the data model and select Source at the top of the rail on the left. The Source screen opens.
- Select the Sources tab. It lists every source the model reads, with the kind of source and how many views read it, for example
Connection · SQLite · 1 view. - Add the source:
- Connection. Select Add connection and choose a connection from the list. The list shows only enabled connections that the model does not already read. If every connection is already a source, the list reads No more connections configured.
- Workspace file. Select Add workspace file…. In the Select a workspace file dialog, pick a workbook or SQLite database and confirm. If you pick a file the model already reads, Reportworq says
'<path>' is already a source of this data model.
- Select Save Changes.
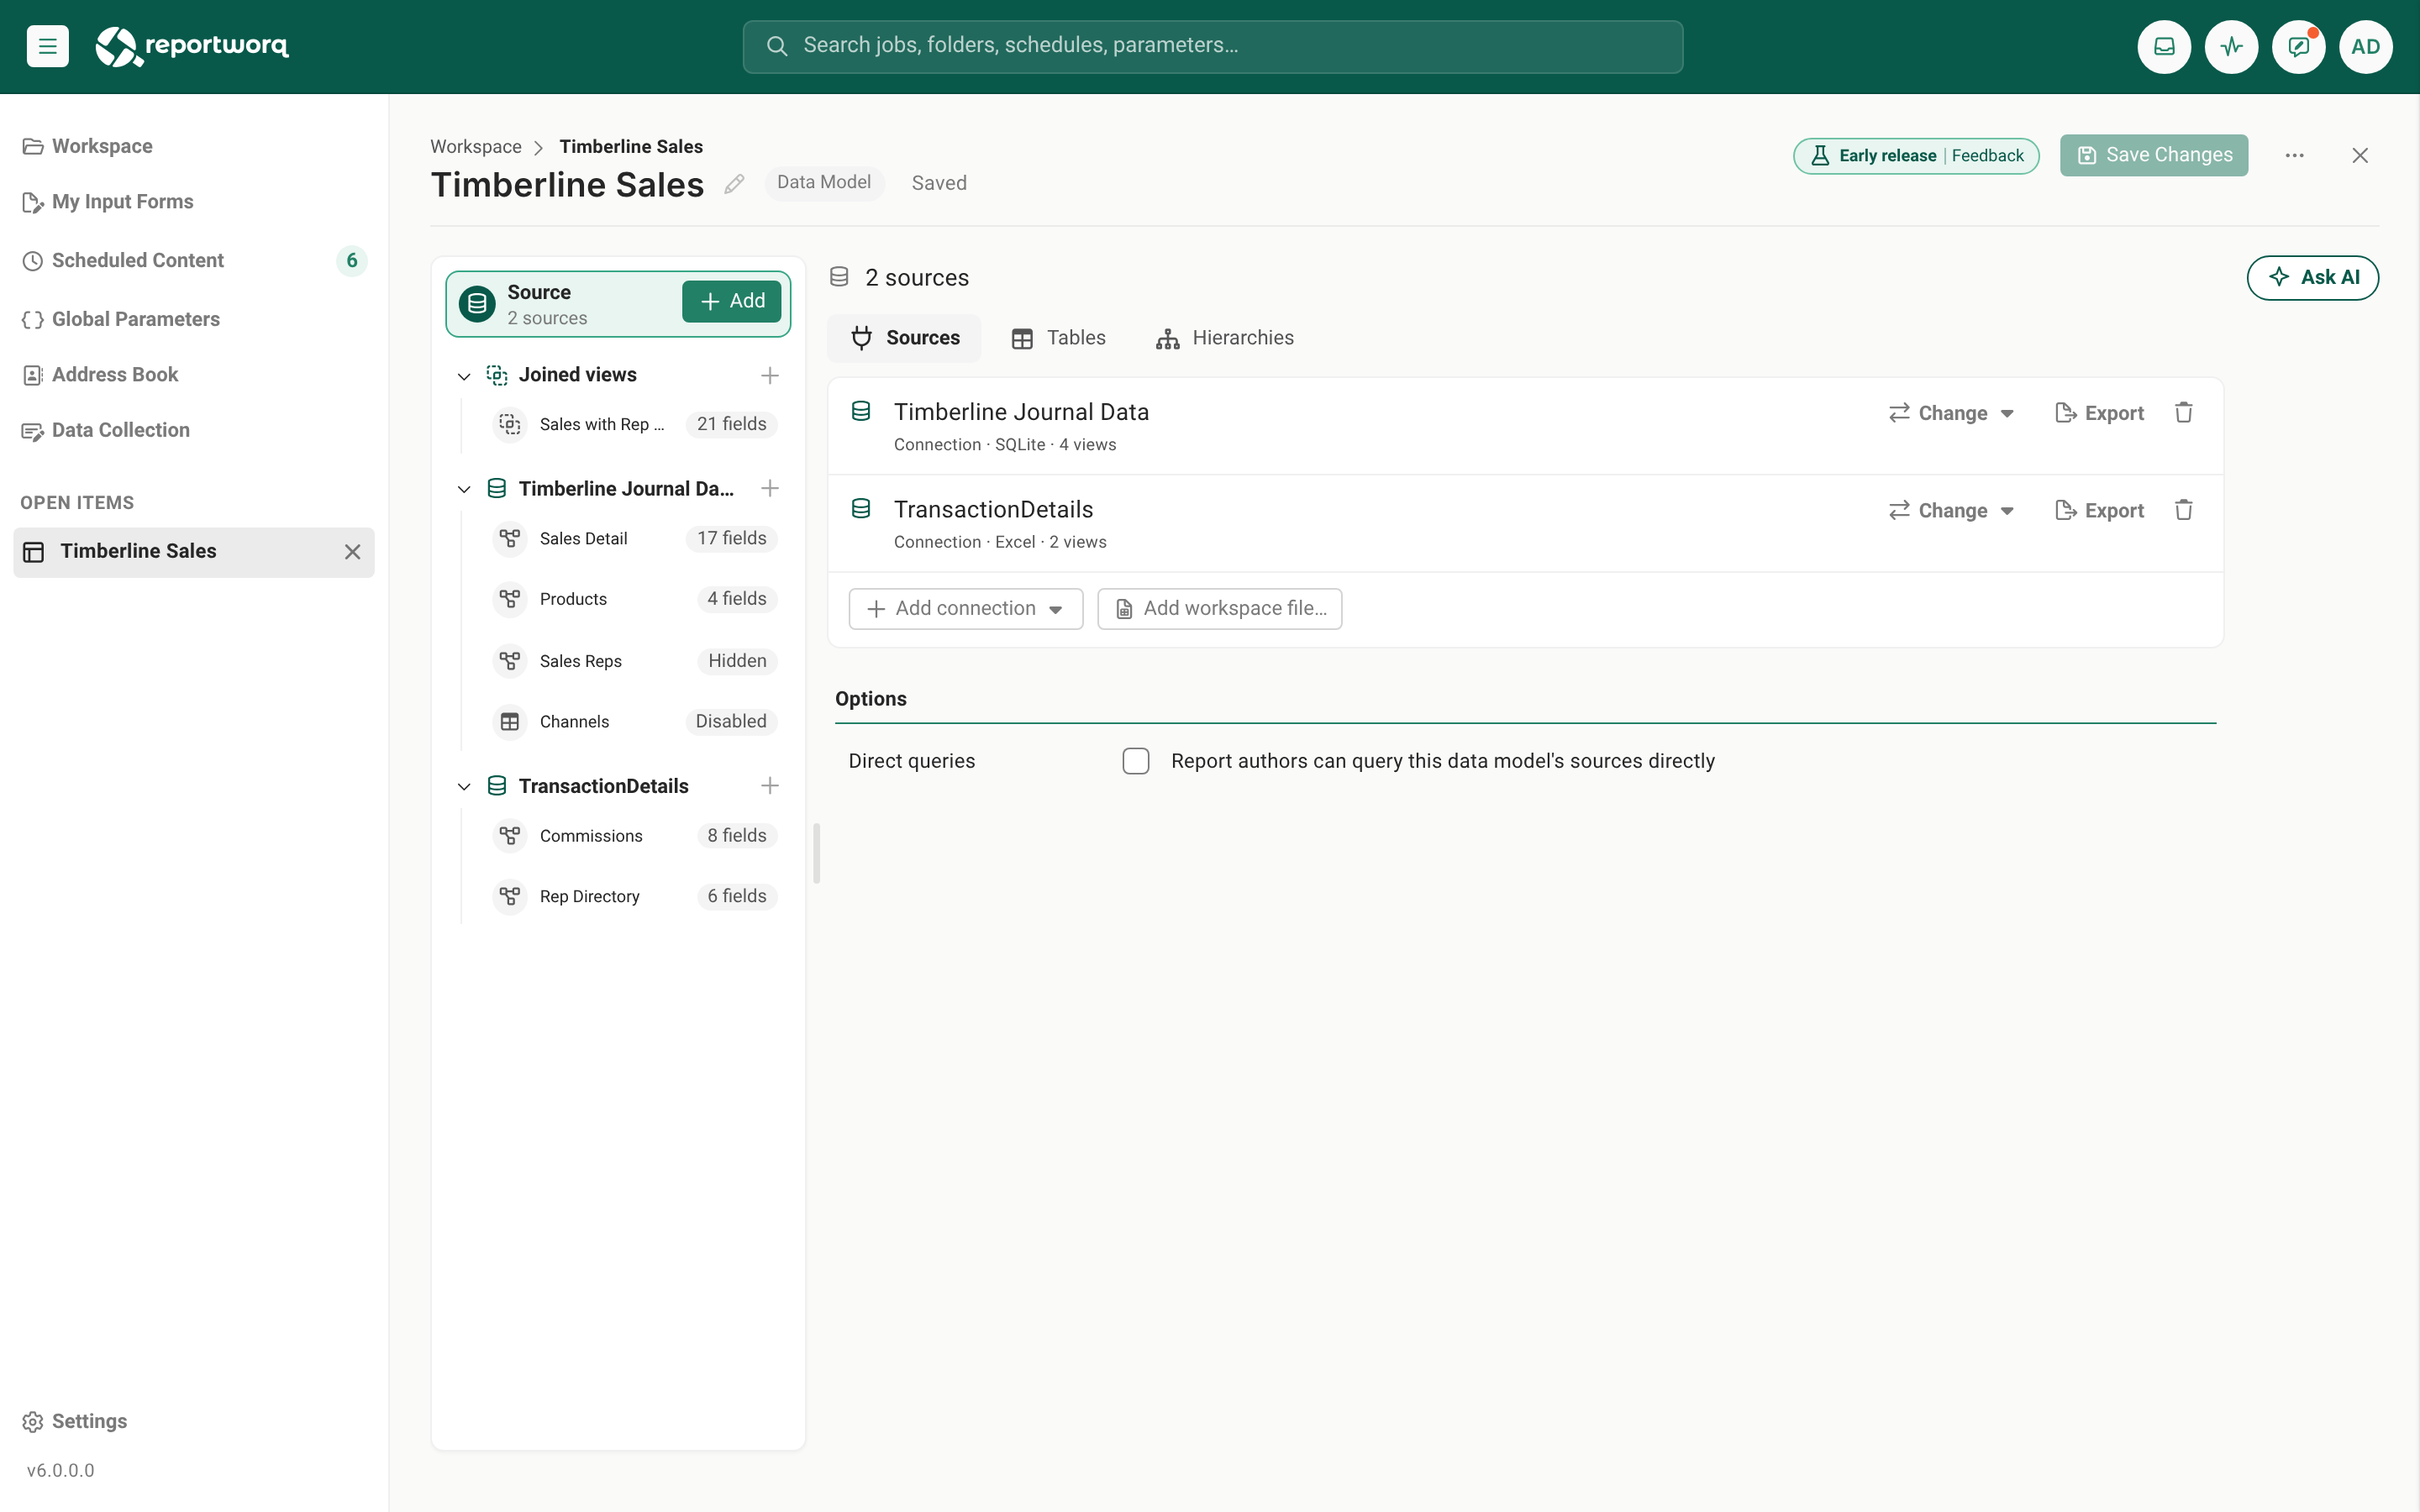
The model's first source also takes you straight to the Tables tab so you can look at what it holds. A second source does not: select the Tables tab yourself to browse it. When a model has several SQL sources, the Tables tab groups the tables under a folder for each source.
How each source is named#
You do not name a source in the model. Reportworq shows the name it already has:
| Kind | Shown as | To rename it |
|---|---|---|
| Connection | The connection's name from Integrations | Rename the connection in Integrations. Every model that reads it shows the new name. |
| Workspace file | The file's path in the workspace, for example Data/Sales.xlsx |
Rename or move the file, then use Change… on the source's row to point the model at it again. |
Where the names appear:
- Rail. Beside Source, the second line names the source, or reads 3 sources (for example) when the model reads several. Point to it to see every source in the tooltip. Under it, each source has a folder named for the source, holding the views that read it, and a plus sign on the folder adds a view of that source.
- Source screen. The head row names the source, or reads N sources.
- Pickers. In the joined-view editor and the relationship editor, views are grouped under the name of the source they read. The hierarchy editor shows the source in brackets after a view's name, for example
Sales Details (TransactionDetails).
View names are shared across the whole model. Two views can read different sources, but they cannot have the same name: the Excel add-in and every report binding find a view by its name within the model. If you rename a view to a name already taken, the rename is refused with A view named “<name>” already exists. View names must be unique. Use the source in the name when it helps, such as Actuals and Forecast.
Add a view of a source#
Each view reads exactly one source, and that source decides the editor you get: the table designer for a SQL database or a workspace file, the cube view editor for Planning Analytics, and each connector's own query settings otherwise.
- Select + Add beside Source in the rail. The Add a view of… list has one entry per source, then Joined view.
- Choose a source. The new view opens on its Design (or Connection) tab, named New View (or New View 2, and so on).
- Build the view and set its visibility. A new view starts Hidden. See Build a view with the designer and View visibility.
If the model has no source yet, + Add offers Add a source first…, which opens the Sources tab.
When each source is used#
Reportworq reads a source only when something needs one of its views.
- A report, job or preview of one view reads that view's source and no other.
- A joined view runs each input view on its own source, then matches the rows in Reportworq's memory. It needs every source its inputs read, so if one is down the joined view fails. See Join views across sources.
- A hierarchy belongs to one source. Its Levels version reads a view of that source each time a report uses it. See Hierarchies.
- A table relationship links tables of one source only. To relate data across sources, join views instead. See Table relationships.
- Direct queries are a model-level option, but a report author starts a direct query against one source at a time. See Direct queries.
From several sources to a joined view#
Several sources become one result in a joined view, a view whose inputs are other views of the model. The usual path:
- Add each source and build a view on each (a
Sales Detailsview of the workbook and aForecastview of the planning cube, for example). - Select + Add > Joined view, pick one view to start from and add the related view.
- Relate them on a field they share, check the match with Test match and save.
The joined view is the one you set to Public for report authors. The input views can stay Hidden. The whole walkthrough is in Join views across sources.
Change or remove a source#
- Change (a connection) or Change… (a workspace file) points a source at another connection or file. Every view of the source moves with it and its query is kept. Use it to swap a test database for the production one, or to repoint a file after you moved it. Joined views are not tied to one source, so they are unaffected.
- Remove (the trash button on the row) asks first, naming up to five views that read the source. Those views move to a No source folder in the rail and keep their design. Open one and pick a source again to make it work. Table relationships on the removed source are dropped.
- A source that went missing is flagged when you open the model. If a connection was deleted from Integrations or disabled, or a workspace file was moved, renamed or deleted, an exclamation mark appears on the source's folder in the rail and the row on the Sources tab explains how to fix it. This check only confirms the connection or file is still there. It does not sign in, so a wrong password shows when a view runs.
Notes and limits#
- A connection can be a source only once in a model, and so can a workspace file. To read two databases of the same kind, add two connections in Integrations.
- A workspace file source must live in the model's own workspace. A model exported to another workspace finds its files by their path, so the same folder layout must exist there. See Build a data model from a workspace file.
- Everything about the model is shared by its sources: the folder permissions on the model, the Direct queries checkbox, and the variables you define on views. Put sources that need different access in different models.
- Planning Analytics, Analysis Services, Adaptive and Pigment are read as tables, so a view of a cube is rows and columns. Details are in Data models.
Going deeper. To combine views of different sources, see Join views across sources. To start from a single file, see Build a data model from a workspace file. For everything the model editor does, see Data models.
Feedback on this page
Comments, questions, requests, or something missing or unclear? Email us - the page you are on is filled in for you.
Email feedback on this pageOr write to support@reportworq.com directly.