
Crosstabs#
Early release. This feature is in early release, so its screens and behavior may change. Tell us what you think with Send feedback. See Early release features and Send feedback.
A crosstab adds up a measure across row groupings and column groupings, like a PivotTable that stays connected to your data model. You choose which fields go down the side, which go across the top, and which number to add up. Reportworq draws the grid into your sheet and refreshes it from the view.
When to use it. You want a summary. For example, net_amount from the Timberline Sales Details view by product_line down the side and region across the top, with a grand total row and column. If you need the individual invoice lines behind a number, use a list report, or drill into the crosstab cell.
You build a crosstab the same way in Excel and in the web report studio, because both host the same Reportworq pane. See The Excel add-in and the studio.
Before you start#
- You are signed in as an author or a system administrator.
- A data model with a Public view you can see, or, for a crosstab on a cube, a saved connection to TM1, Adaptive, Vena or Pigment. A Hidden view is not listed and a Disabled view never runs. See View visibility.
- In Excel, a version that supports the Reportworq pane. In the studio, a web report open in Editing mode. See The web report studio.
Start a crosstab#
- Click the cell where the crosstab's top-left corner should go.
- Start it:
- In Excel: on the Reportworq tab, in the New report group, select Crosstab. Or open the pane and, on Home, use the crosstab quick button on a view in the model list, or Crosstab under Or start from a report type.
- In the studio: on the Reportworq tab, in the New group, select Crosstab. The Insert tab has the same button.
- On the Connection page, choose a view and select Done (or double-click it). Selecting a view does not connect it until you do.
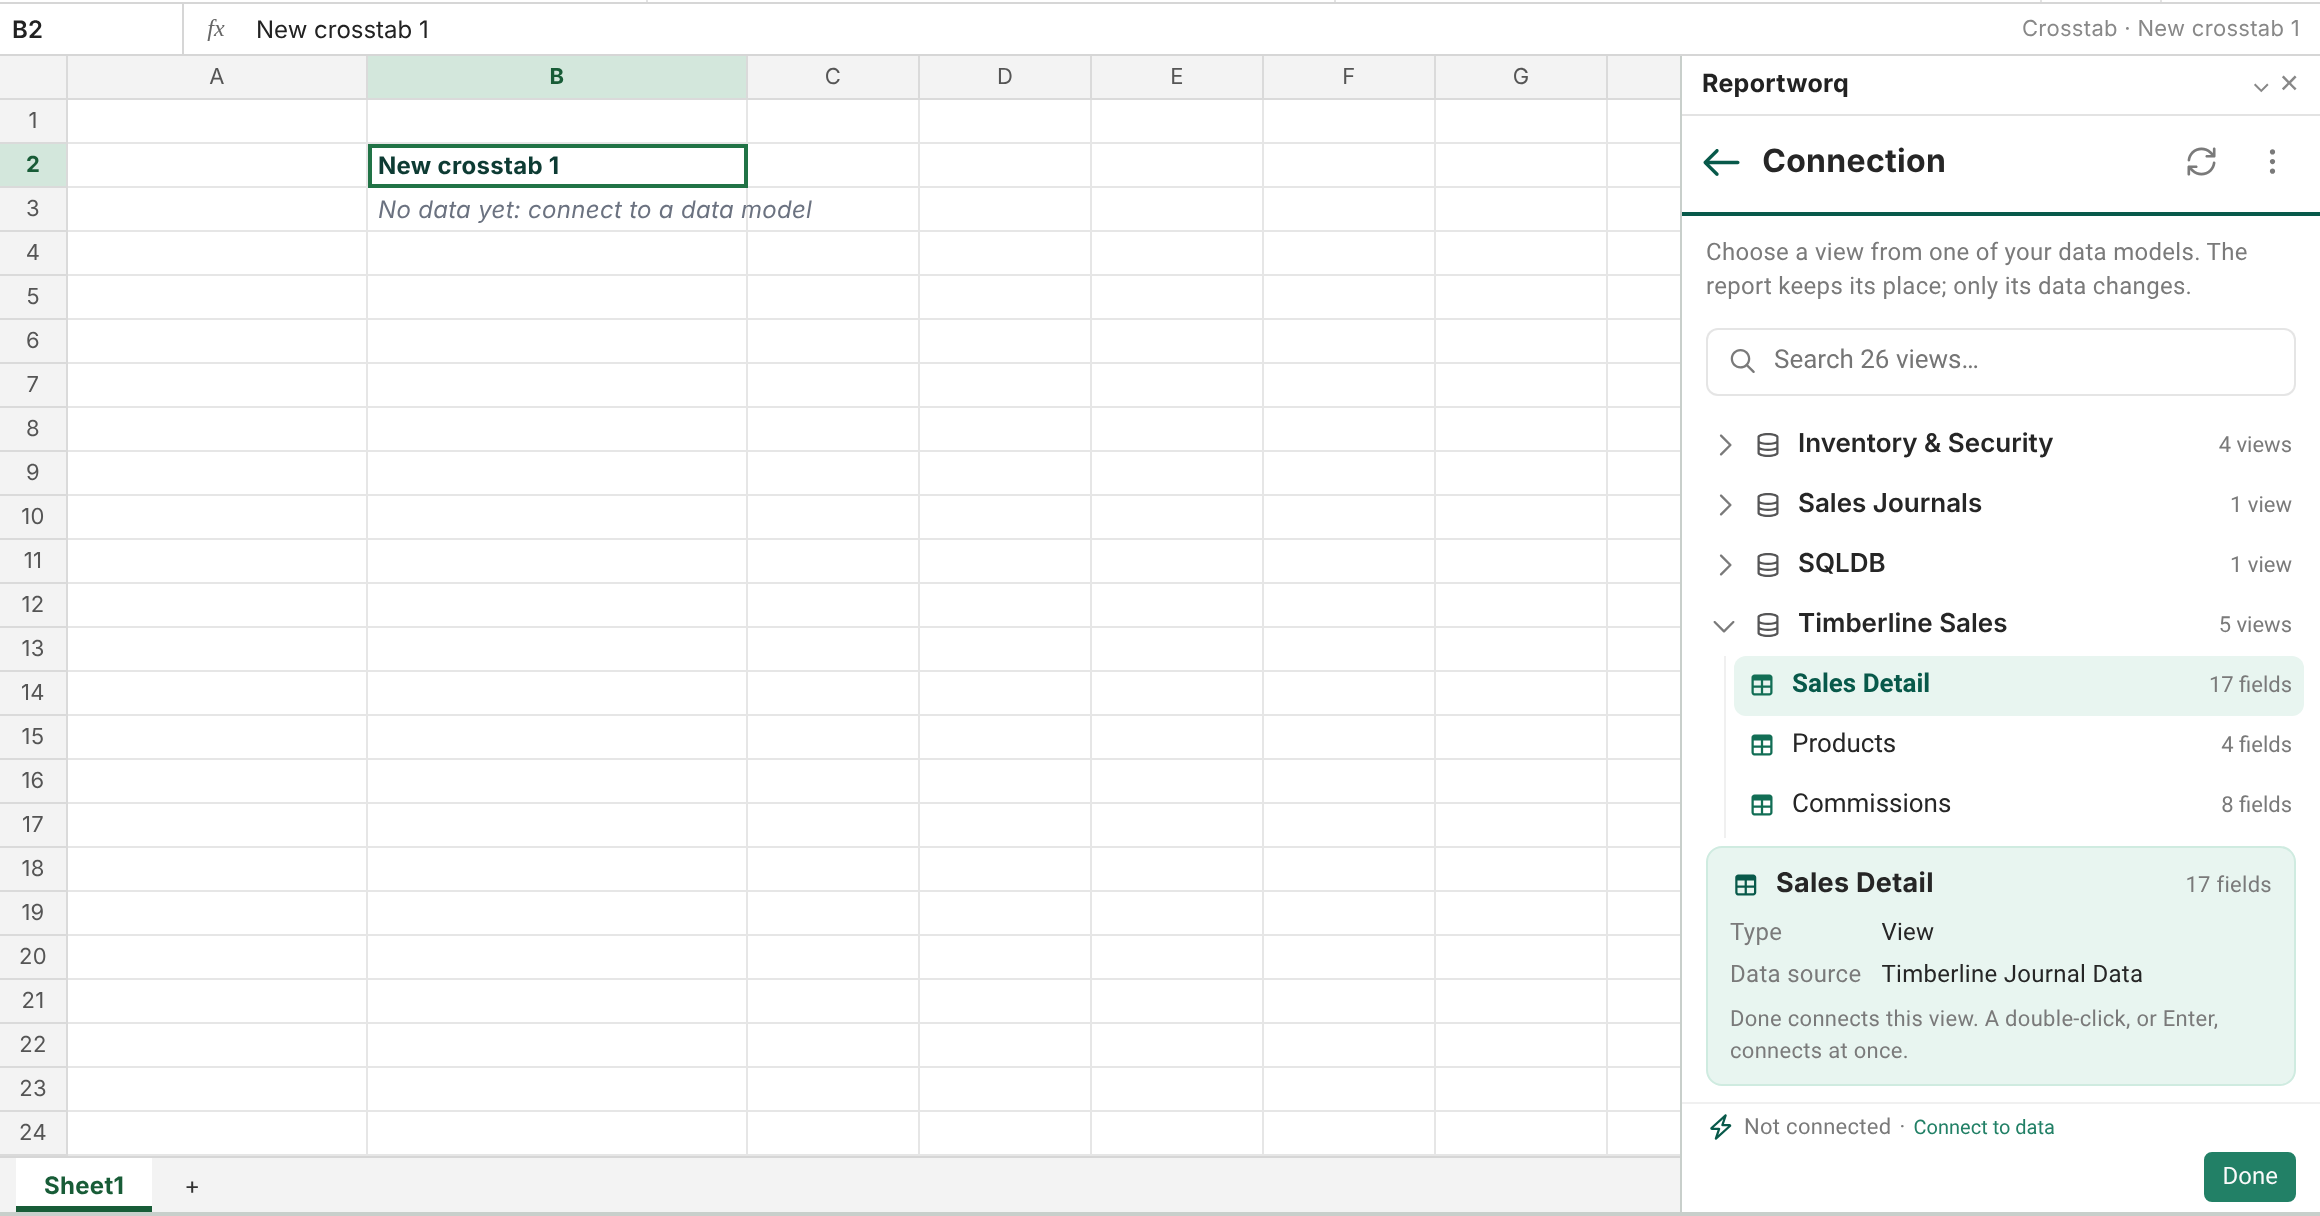
A new crosstab starts with one empty row grouping and says "Add a value (e.g. Revenue) to see data" on the sheet until it has a value.
Arrange the crosstab#
The crosstab's main page has four zones: Columns, Rows, Filters and Values.
- Under Values, select the + and choose a number field, for example net_amount.
- Under Rows, select the + (tooltip "Add a row field") and choose a field, for example product_line.
- Under Columns, select the + ("Add a column field") and choose a field, for example region. The Rows and Columns pickers offer text fields; a number such as year is offered under Values instead.
- Optional: under Filters, select the + ("Add a filter") and choose a field to filter by. See "Filter a crosstab" below.
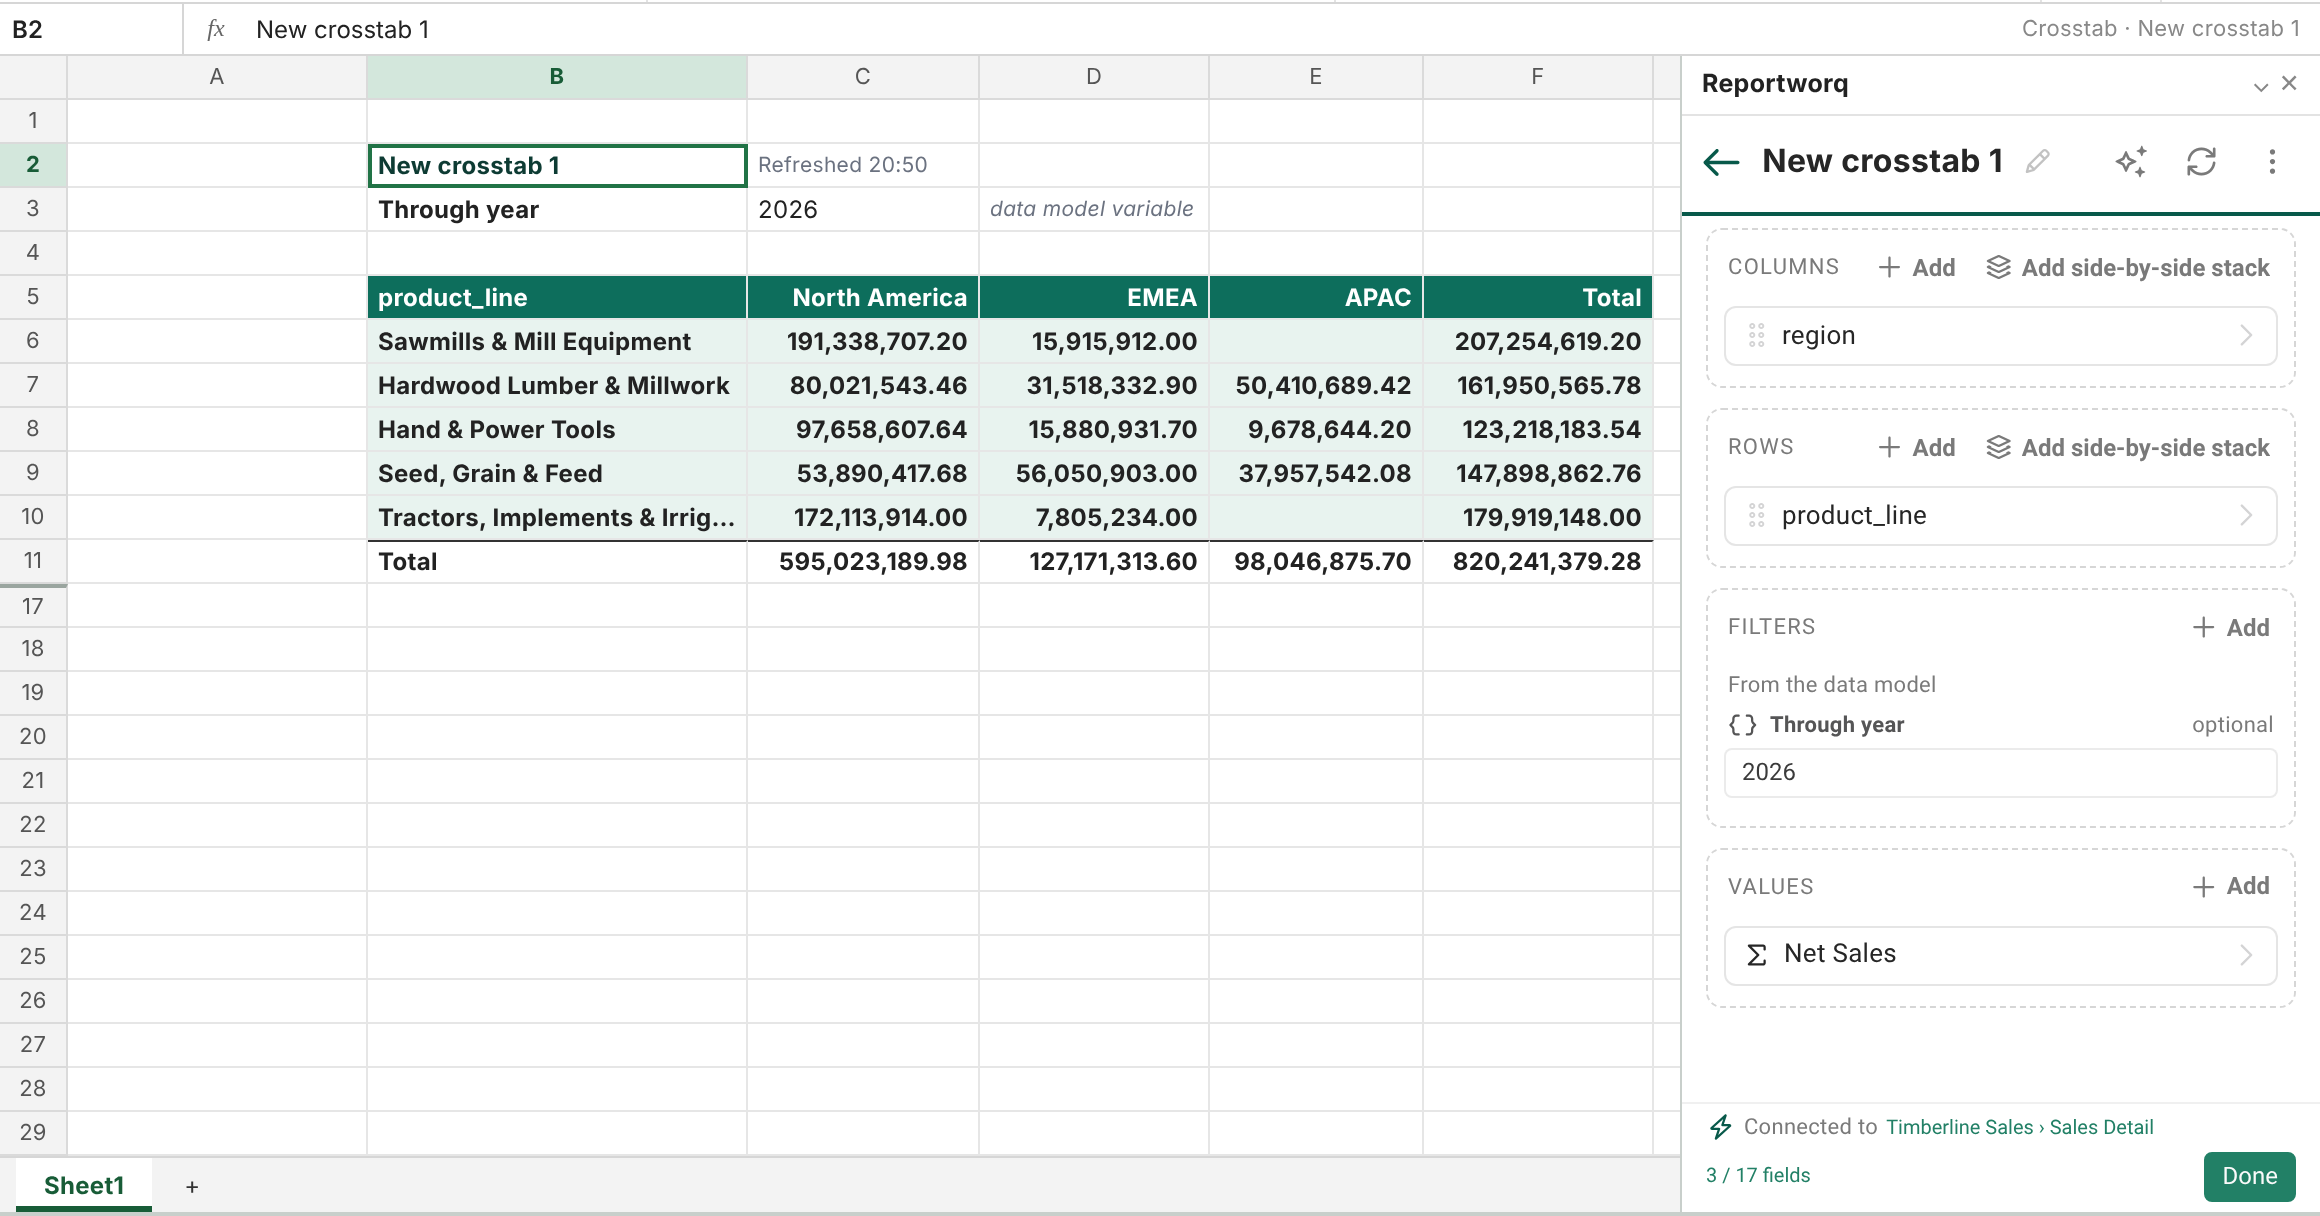
The grid renders live as you add fields. Add more than one field to Rows or Columns to nest them; the first is the outer level. Rows render expanded to level 2, with expand and collapse glyphs in the cells. Select a glyph on the sheet to open or fold a row.
A value is always added up with Sum. Add several values and they sit side by side under each column. A value's page offers Move up, Move down and Remove value.
To put two independent sets of rows or columns next to each other over the same other axis, select Add side-by-side stack on Rows or Columns. To nest more fields inside a stack, use that stack's own +. Drag a stack by its grip to reorder stacks.
Set up a row or column field#
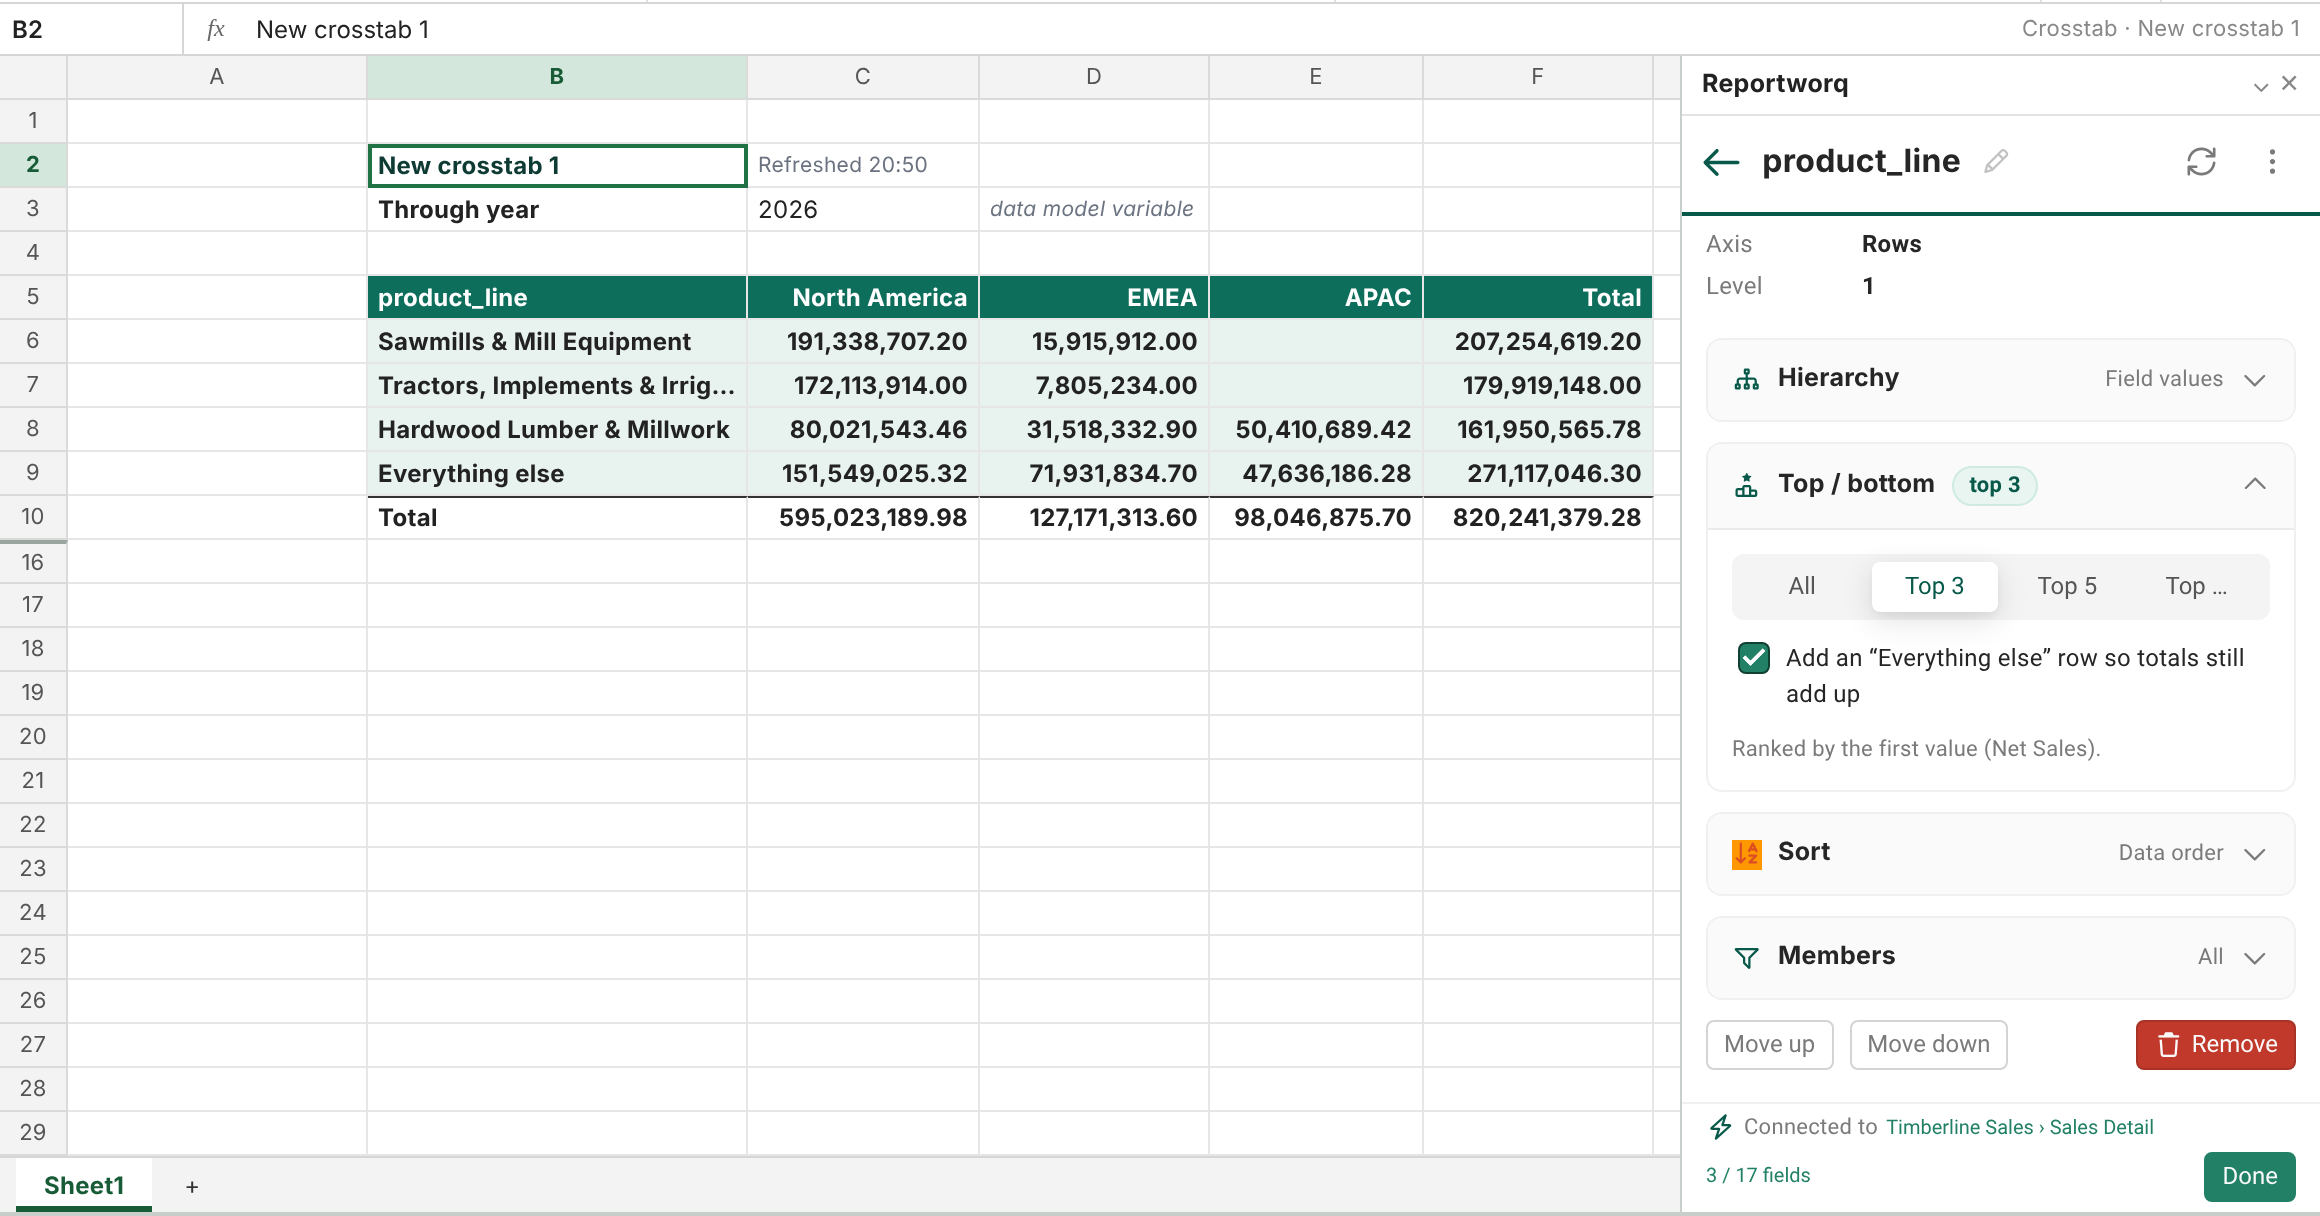
Select a field under Rows or Columns to open its page. It has these sections:
| Section | What it does |
|---|---|
| Hierarchy | Show as the field's own values (None (field values)) or through a hierarchy defined for the model, and Expand to level. For a cube field the hierarchy is the cube's own. See Hierarchies. |
| Top / bottom | All, Top 3, Top 5 or Top 10 of this field, ranked by the first value. Tick Add an "Everything else" row so totals still add up to keep the grand total correct. |
| Sort | A → Z or Z → A. Not available on a cube field, which keeps the cube's order. |
| Members | A checklist of the field's members. It narrows the field to the members you tick. |
| Move up, Move down, Remove | Reorders the field within its stack, or takes it out. |
The Members summary reads "All" until you narrow it. With a member filter on a row or column field, the field also shows in the Filters zone, marked "on rows" or "on columns", and the filter shows above the crosstab on the sheet.
Filter a crosstab#
There are three kinds of filter, and all of them narrow every total, Top N, "Everything else" row and grand total.
- Page filters (the Filters zone). Pick a field and its members on the filter's page: search, Select all, Select none, then OK or Cancel. Select Remove filter to take it away. On the sheet, a page filter is a drop-down above the crosstab that reads (All), one member, or (Multiple items). Pick from the drop-down to re-render. A drop-down shows up to 200 items. In Excel, a list longer than 255 characters in all, or with an item that contains a comma, gets no drop-down; the cell is plain text.
- Member filters on a row or column field, from its Members section.
- Report filters, from the Report filters button on the Crosstab tab or the crosstab's menu. Select Add report filter, pick a Field, then either a value under Equals or a variable under Or variable. These apply before anything else, and each shows as a line above the crosstab. A crosstab on a cube does not use report filters; use a dimension as a page filter instead.
To clear a filter, pick (All) in its drop-down. To clear an optional variable, pick (Any). Pressing Delete does not clear either.
If the view has data model variables, they show in the Filters zone under From the data model, and as drop-downs on the sheet. A required variable with no value shows as not set. See Data model variables and Cell-driven variables.
Text matches ignore case and leading and trailing spaces: "East", "East " and "EAST" are one row or column.
Totals#
Open the Totals page (the Totals button on the Crosstab tab) and tick Grand total row and column. The crosstab then adds a total across each row and down each column.
Place the crosstab and limit what it reads#
Place sets the anchor cell and what happens when the crosstab grows: Insert rows (default), Insert cells (only the report's columns move) or Overwrite (scratch sheets). Import as an Excel table is also there.
A crosstab has no Limit rows. It adds up every row it reads, so a limit applies to the source. Under Rows read from the source choose Default (1,000,000), 1,000, 10,000 or All rows (up to 1,000,000), or type a number. If you pick a number below the source's size, the crosstab adds up only those rows and says "first N rows" and that its totals cover only them.
Work with the numbers#
- Drill. Select a cell and use Drill to transactions to see the rows behind it, or Drill to crosstab to start a new crosstab on a new sheet filtered to that cell, with the next level on rows. Put this into a new sheet turns the rows into a live list.
- Swap rows and columns on the Crosstab tab flips the axes.
- To professional report, on the Crosstab tab, converts the crosstab into a professional report where the studio offers it. It refuses a crosstab with report filters, because the professional report cannot carry them. See Professional reports.
Notes and limits#
| Limit | Value | What happens past it |
|---|---|---|
| Rows read from the source | 1,000,000 | A crosstab on a data model needs every row, so above this it is not shown and says why. Nothing is cut. Add a data model variable or a filter on the view, or set Rows read from the source to 1,000,000 or fewer. |
| Cells in one crosstab | 2,000,000 by default (an administrator can set 1 to 5,000,000) | Nothing is written. The status reads Too big for Excel with the cell count and a Limit to N rows button that sets the rows read from the source. |
| Ask before writing | Above 100,000 cells (Excel only; an administrator can change it, 0 never asks) | The card reads "Waiting to write" until you choose Write N cells or Cancel. |
| Cells in one workbook | 5,000,000 over all reports | A report that would pass it writes nothing. |
| Sheet size in the studio | 1,000 rows by 52 columns | A crosstab reads rows to fit the grid and says "first 1,000 rows" beside its refresh time, with its total covering the rows shown. |
| Sheet size in Excel | Excel's last cell, XFD1048576 | A write past it is refused: "Reportworq can't write past the last cell Excel has (XFD1048576)". |
| Drop-down items | 200 per drop-down | Narrow the field with a member filter. |
| Read time | 120 seconds | The crosstab fails with "The source took too long." |
- Cube crosstabs. A cube's views are its cubes; its fields are the dimensions plus one value. Only authors and administrators see cube connections, because the cube is read with the connection's stored account. TM1 is read for self-hosted native or CAM logins only.
- Distribution jobs. A job that refreshes a workbook with a crosstab refreshes it in place and sends a static copy. It ignores the pane's defaults, reads up to 1,000,000 rows, and fails the sheet with a message if the crosstab is too large. See Excel: the analyst pane.
Going deeper. To chart a crosstab, see Charts and maps. To place a list and a crosstab on one page, see Combine report types.
Feedback on this page
Comments, questions, requests, or something missing or unclear? Email us - the page you are on is filled in for you.
Email feedback on this pageOr write to support@reportworq.com directly.