
The web report studio#
Early release. This feature is in early release, so its screens and behavior may change. Tell us what you think with Send feedback. See Early release features and Send feedback.
A web report is a page of live Reportworq reports that you build in the browser. It looks and behaves like an Excel workbook: sheets, cells, formats and pictures. The numbers do not come from formulas in the cells. They come from the lists, crosstabs, charts and other reports you place on the page, and each one reads its data model when you open or refresh the report. The web report studio is the editor where you build it.
Web reports are for authors and administrators. People who only read reports never see them, and a web report is not something you send to a reader. Readers receive the static output of a distribution job instead. To turn a web report into something a job can run, see Convert to Excel.
When to use it. You want a management pack that shows today's numbers without opening Excel or waiting for a run. For example, a title, a crosstab of net sales by product line and year from the Sales Journals data model, and a chart, all on one sheet that fellow authors open from the workspace.
A web report needs no license of its own. Professional reports, which you can place on a web report, are license-gated and not released yet. See Professional reports.
Before you start#
- You are signed in as an author or a system administrator, with permission to create content in the folder you want to use.
- A data model with at least one Public view you can see. A report can only be started from a Public view. See Data models and View visibility.
Create a web report#
- In the workspace, open the folder where the report should live.
- Open the menu on the New distribution job button (its arrow) and select New Web Report.
- In the New Web Report box, type a Name. The box starts with "New web report".
- Confirm. The new report opens in a tab of its own, in Editing mode.
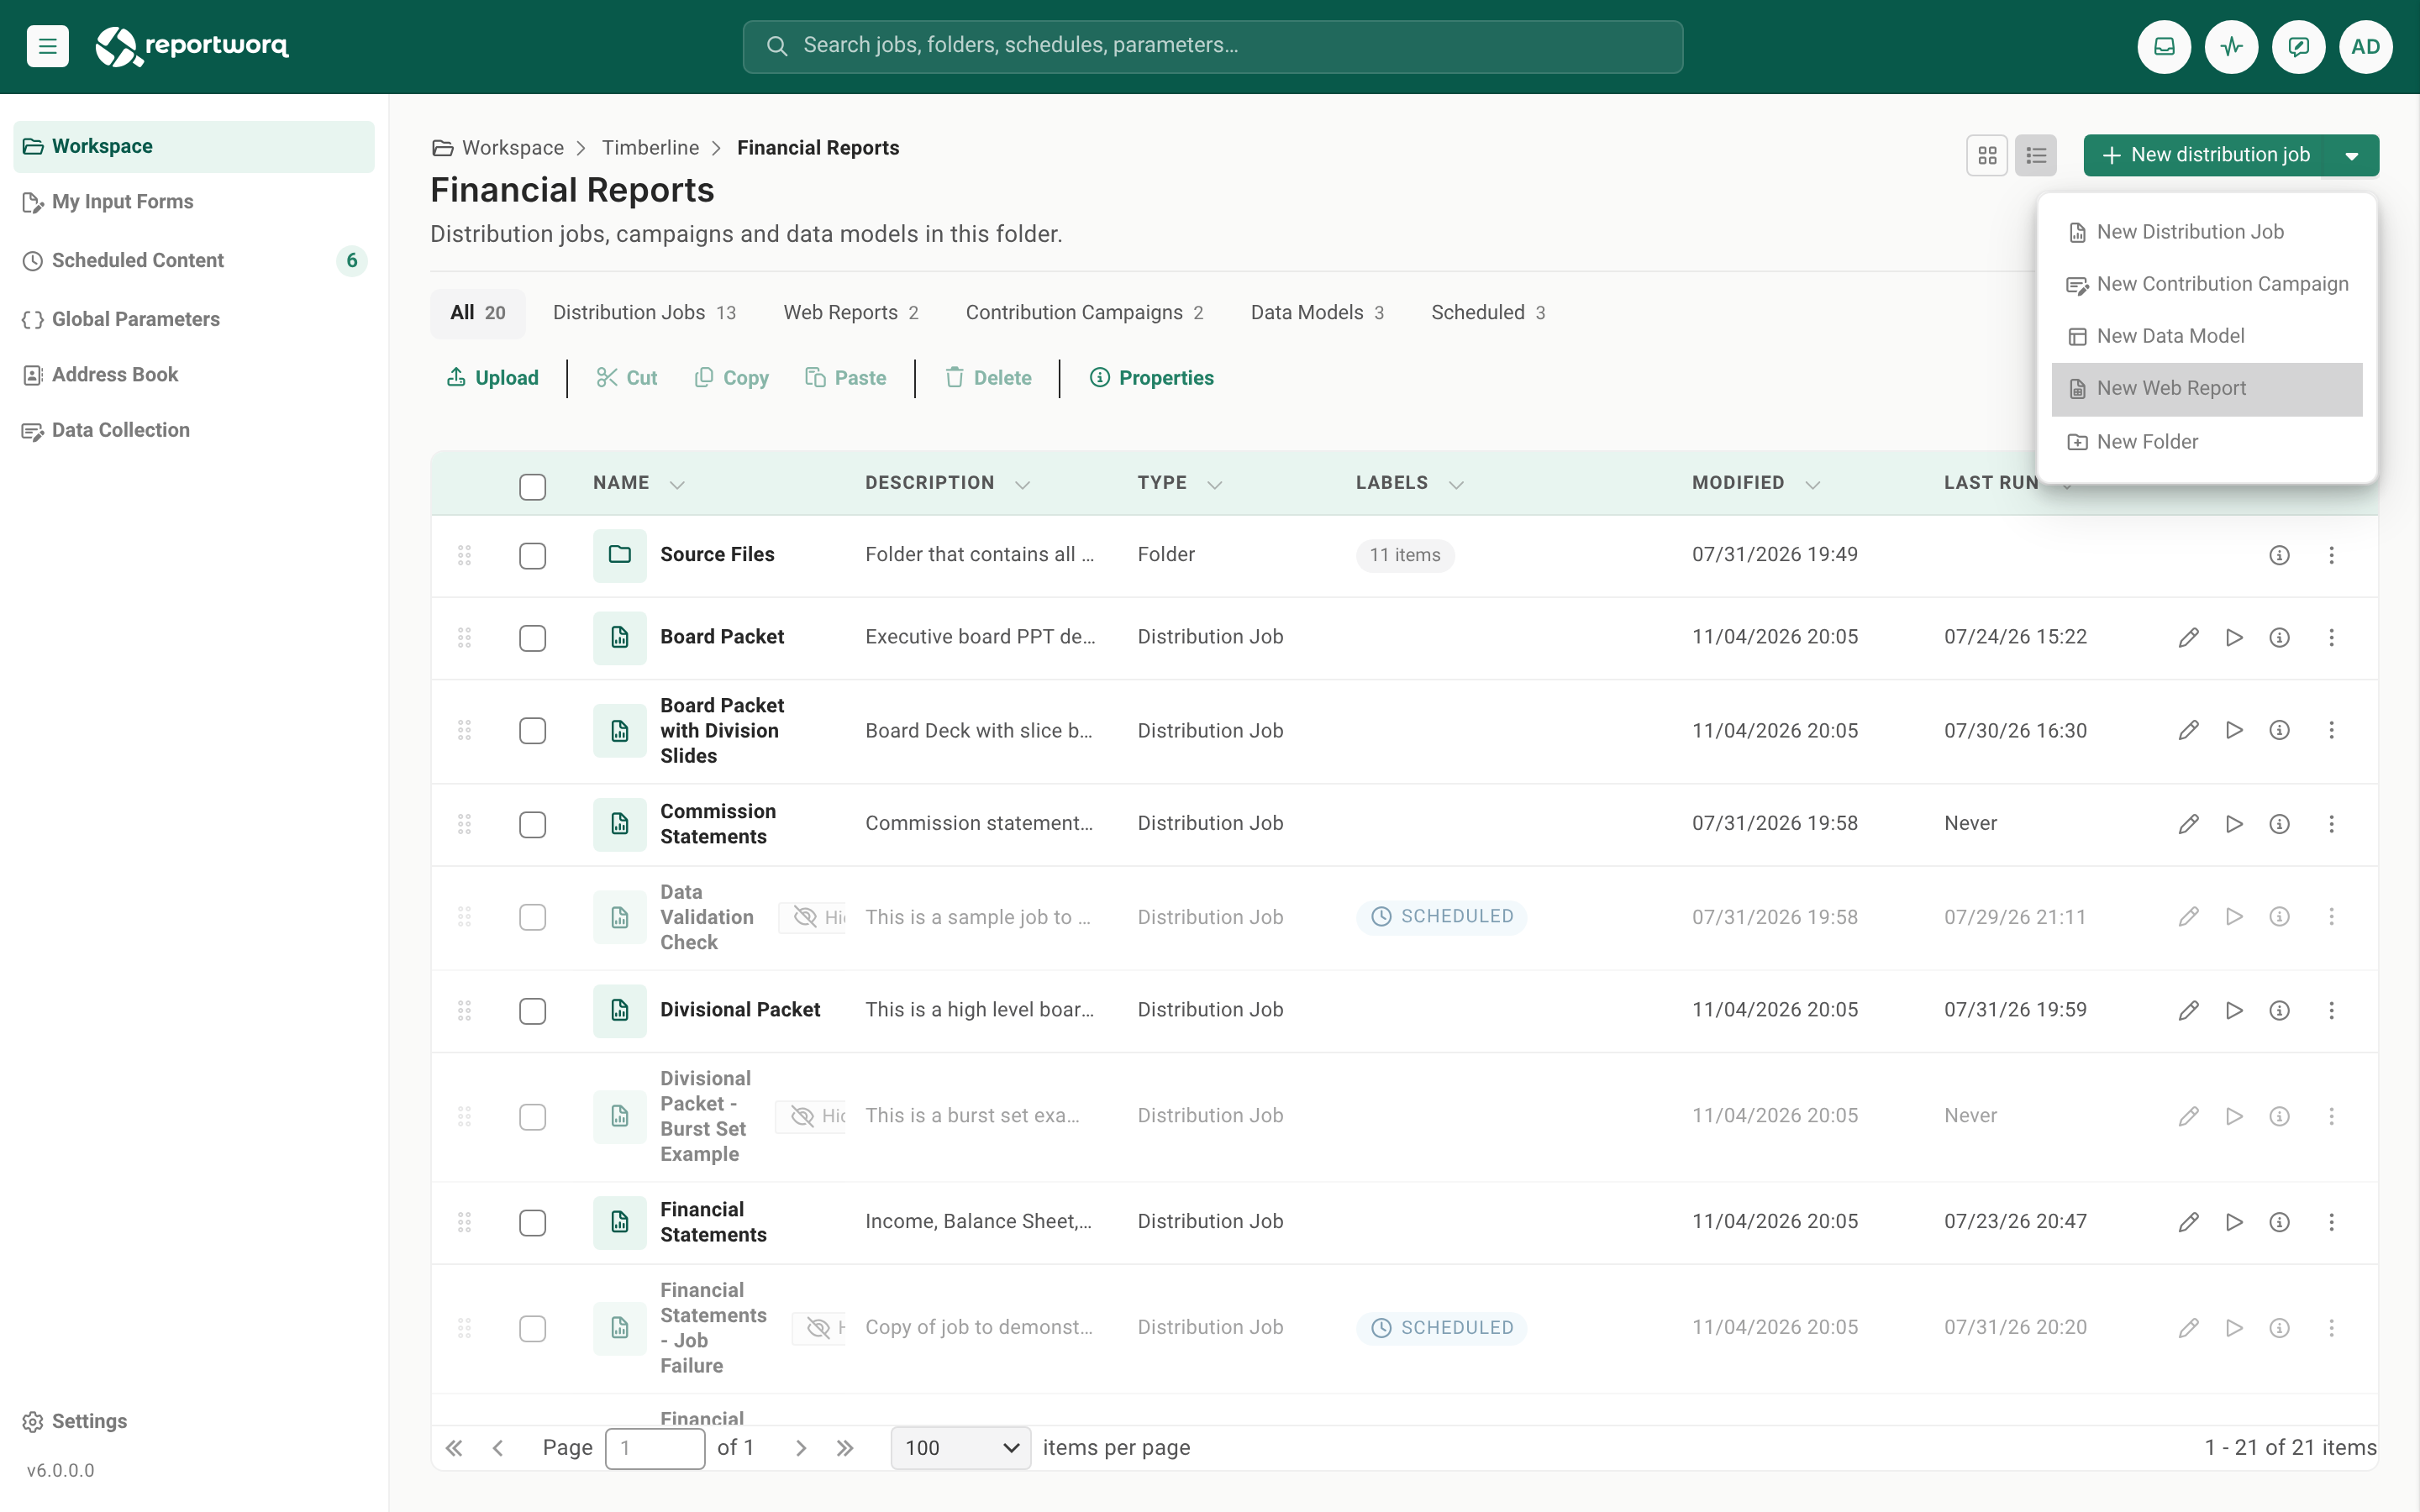
If a report with that name is already in the folder, Reportworq adds a number, for example "Sales pack (1)". A web report is an item like a distribution job: the folder's permissions decide who can see and change it, and you can move, copy, rename, delete, export and import it from the workspace the same way.
Find your way around#
The studio opens with a title bar across the top, then a ribbon, a name box and formula bar, the sheet, a row of sheet tabs, and the Reportworq pane on the right.
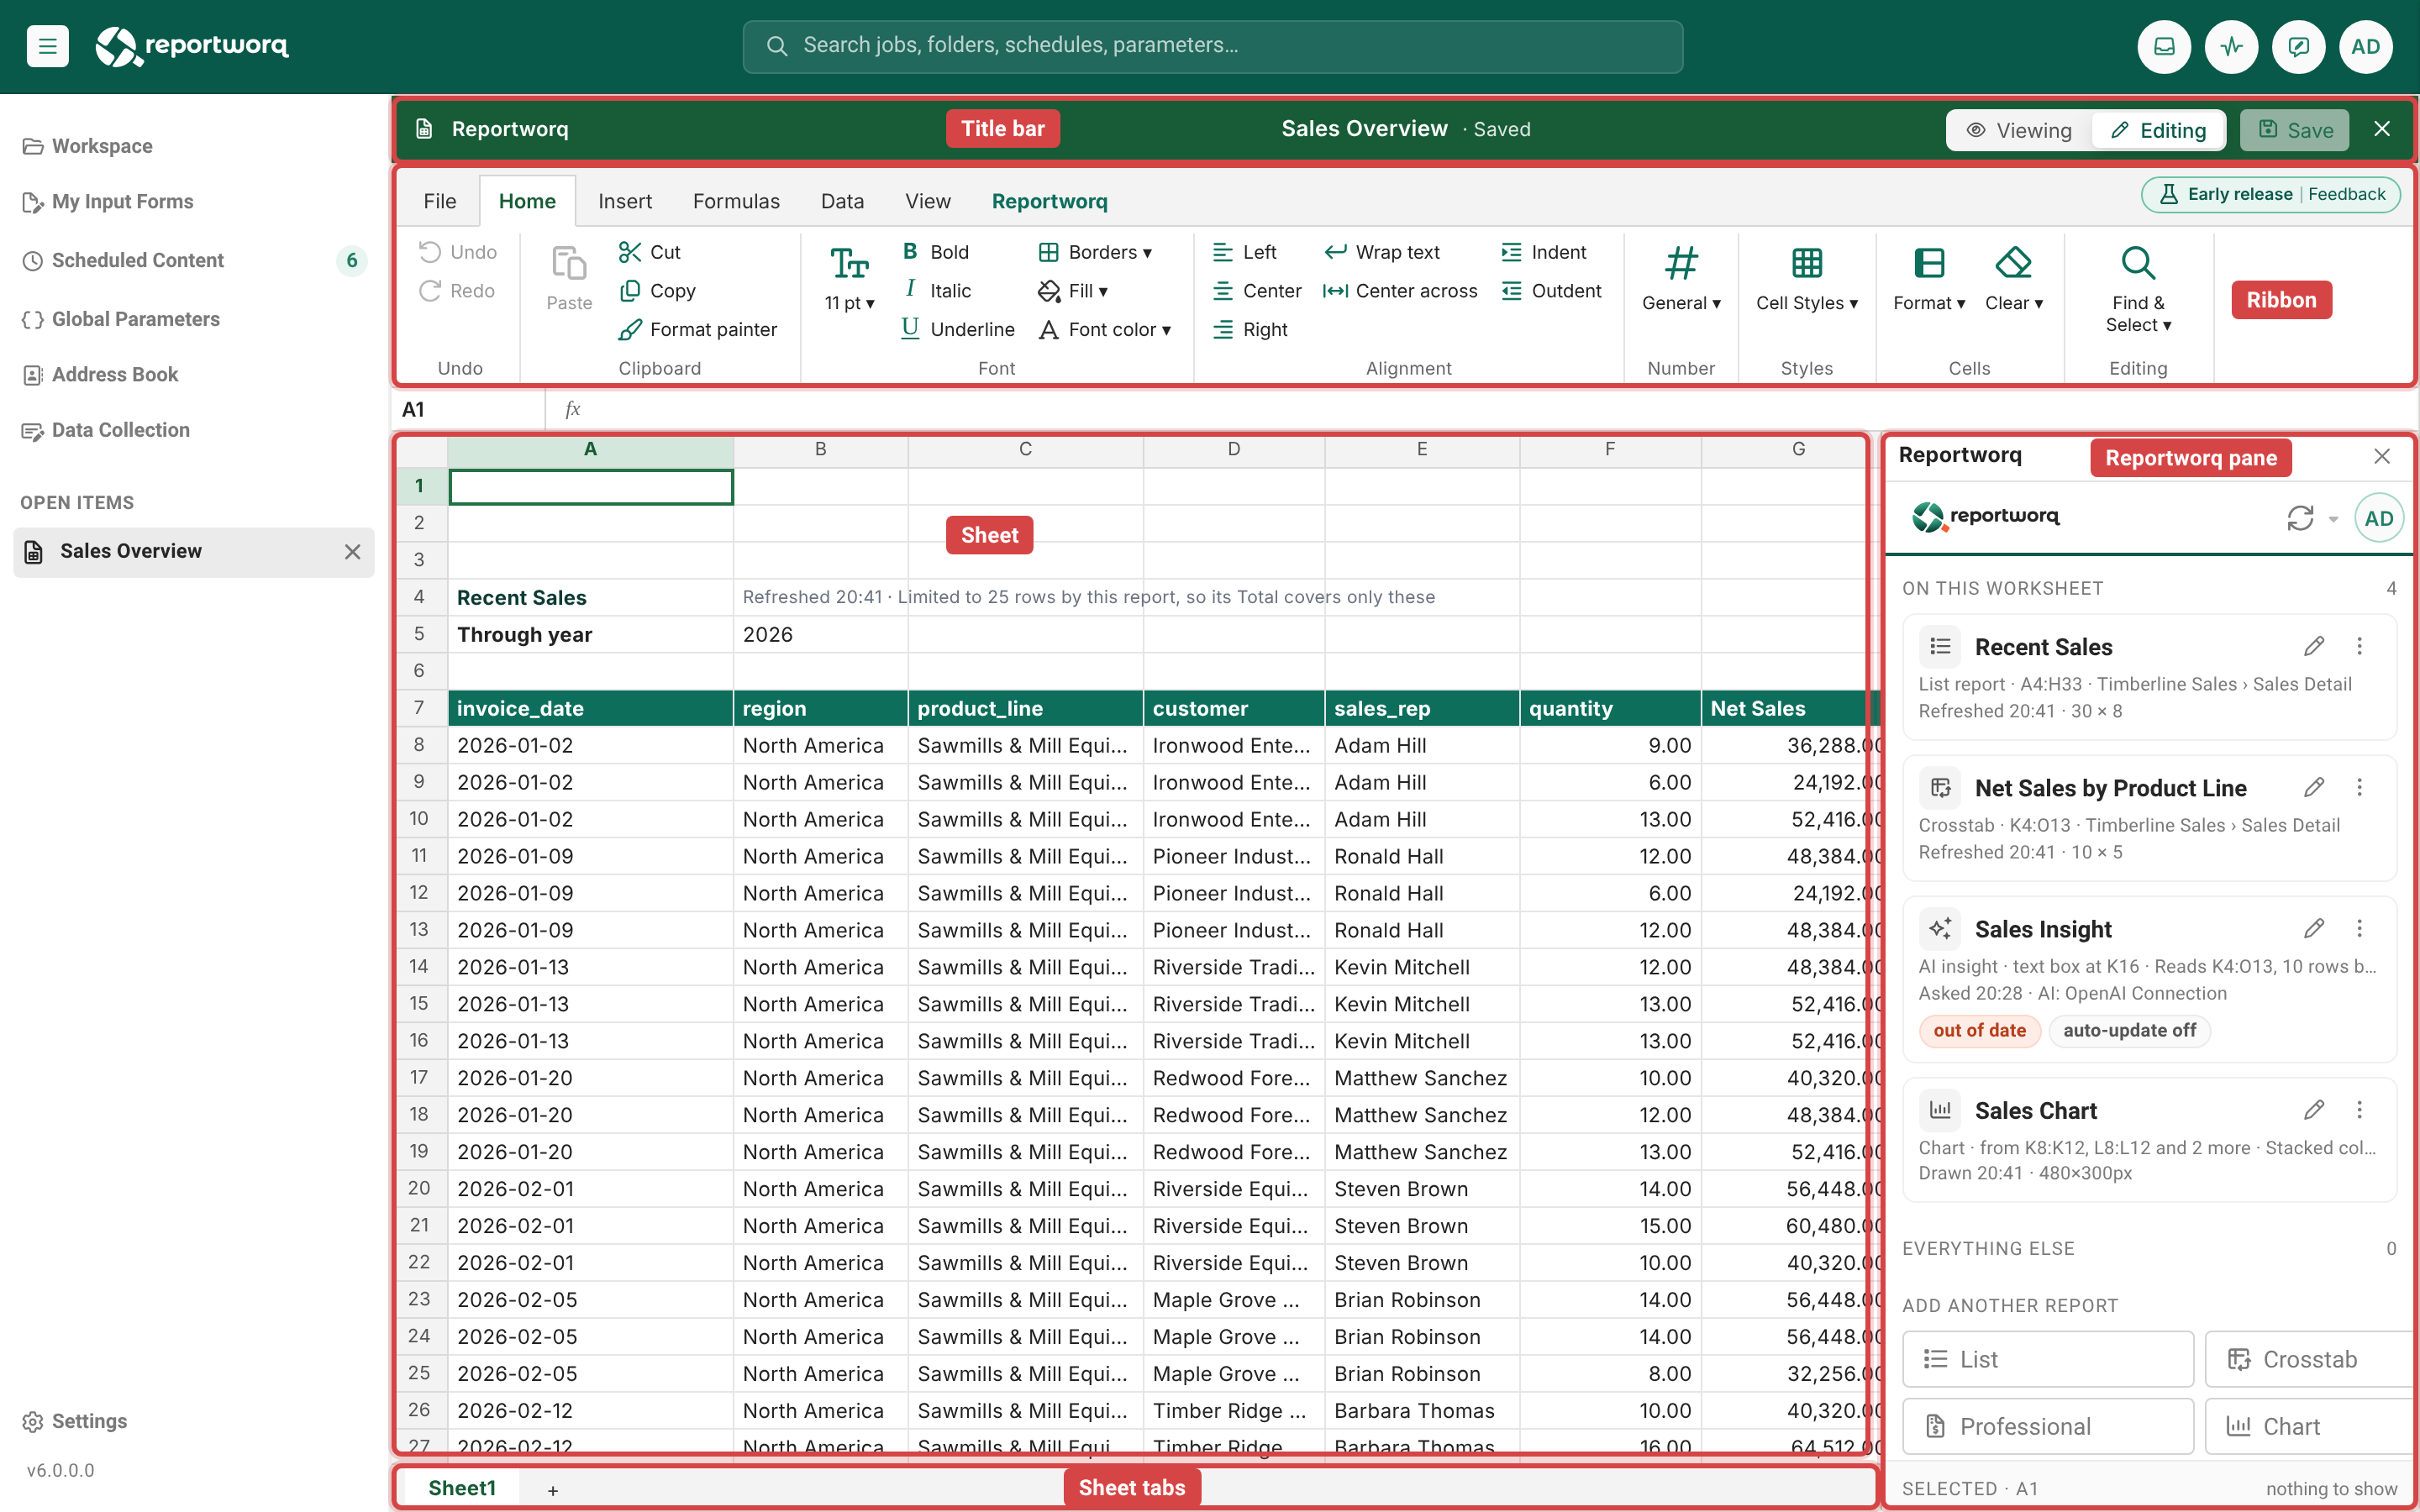
| Part | What it does |
|---|---|
| Title bar | Shows the report name. While you have changes that are not saved it also shows an orange dot, the words Unsaved changes and a Discard link. At the right are the Viewing and Editing switch, Save, and Close (the x). |
| Ribbon | Tabs named File, Home, Insert, Formulas, Data, View and Reportworq. When a report on the page is selected, a tab for that kind of report joins them. |
| Name box and formula bar | Type a cell reference and press Enter to go there; edit the active cell. |
| Sheet | The page you design. See "Sheets" below for its size. |
| Sheet tabs | One tab per sheet, with a + button to add a sheet. |
| Reportworq pane | The same pane that runs in Excel. It lists the reports on the page and is where you connect a report to a view, pick fields and set filters. Show or hide it with Show task pane or Hide task pane on the Reportworq tab. |
The Viewing side of the switch shows the report as a reader of live reports would see it: current data, filters and drilling, but no way to change the page. See The viewer. Going back to Editing puts the report back as it was when Viewing began, so filters or expansions you tried while viewing are never saved by accident.
Put reports on the page#
Click the cell where the report should start, then add it from the Reportworq tab (the New group) or the Insert tab (the Reportworq group). Both offer the same buttons:
| Button | Builds | Read more |
|---|---|---|
| Build with AI | A report from a plain-language request | AI insights |
| List report | Rows from a view | List reports |
| Crosstab | Row and column groupings with a measure | Crosstabs |
| Professional report | A formatted, formula-driven report | Professional reports |
| Chart and Map | A picture drawn from a range on the sheet | Charts and maps |
| AI insight | A short written explanation of a report | AI insights |
A new report appears at the active cell. If that cell is on a report already, the new one goes two rows below the lowest report on the sheet, so it never lands on top of another report. A new list, crosstab or professional report opens the pane on its Connection page so you can choose a view.
A web report can hold many reports of different kinds, on one sheet or several. See Combine report types.
Sheets#
Each sheet is 1,000 rows by 52 columns (columns A to AZ). The studio's page is smaller than a real Excel sheet on purpose. A list that would run past the last row stops at the sheet's end and says so. If you need a report that reaches further, build it in Excel; see The Excel add-in and the studio.
- Add a sheet with the + button at the right of the tabs.
- Rename a sheet by double-clicking its tab, or right-click the tab and choose Rename. A sheet name cannot contain
[ ] : * ? / \, cannot be longer than 31 characters, and cannot start or end with an apostrophe. - Reorder sheets by dragging their tabs.
- Delete a sheet with the x on its tab, or right-click the tab and choose Delete. A report always keeps at least one sheet that Viewing can show.
- Hide a sheet with Hide sheet on the View tab, or right-click the tab and choose Hide. A hidden sheet is left out of Viewing but still goes, hidden, into Excel downloads and job output. Choose Unhide to bring it back.
Formats#
The Home tab works like Excel's. It has groups for Clipboard (including the format painter), Font (size, borders, fill and font color), Alignment, Number, Styles (Cell Styles), Cells and Editing (Find & Select).
- Number includes the usual formats plus Millions (0.00M) and Thousands (0.0K).
- The View tab has Gridlines and Headings switches and Freeze Panes with Freeze Top Row, Freeze First Column and Unfreeze. Frozen panes are saved with the report and kept in the Excel download.
- Format a report's cells the way you format any cells. Select a cell in a list or crosstab and apply a format. Reportworq remembers it for that kind of cell and applies it to every cell like it, including after the report refreshes or grows. This is what keeps a column's number format when the data changes. To see where Reportworq keeps these formats, open the report's menu in the pane and choose Show format range; choose Hide format range to hide it again.
Add a picture#
- Select the cell where the picture's top-left corner should go.
- On the Insert tab, in the Illustrations group, select Picture and choose a file.
The file can be PNG, JPEG, GIF, WebP or SVG, up to 2 MB. Reportworq checks what the file really is, not just its name. The picture opens at its own shape, scaled down to fit a 180 by 72 pixel box when it is larger. Every Excel, PDF and job output stretches a picture to its box, which is why the studio sets the size for you. Drag the picture to move it, and drag its corner to resize it.
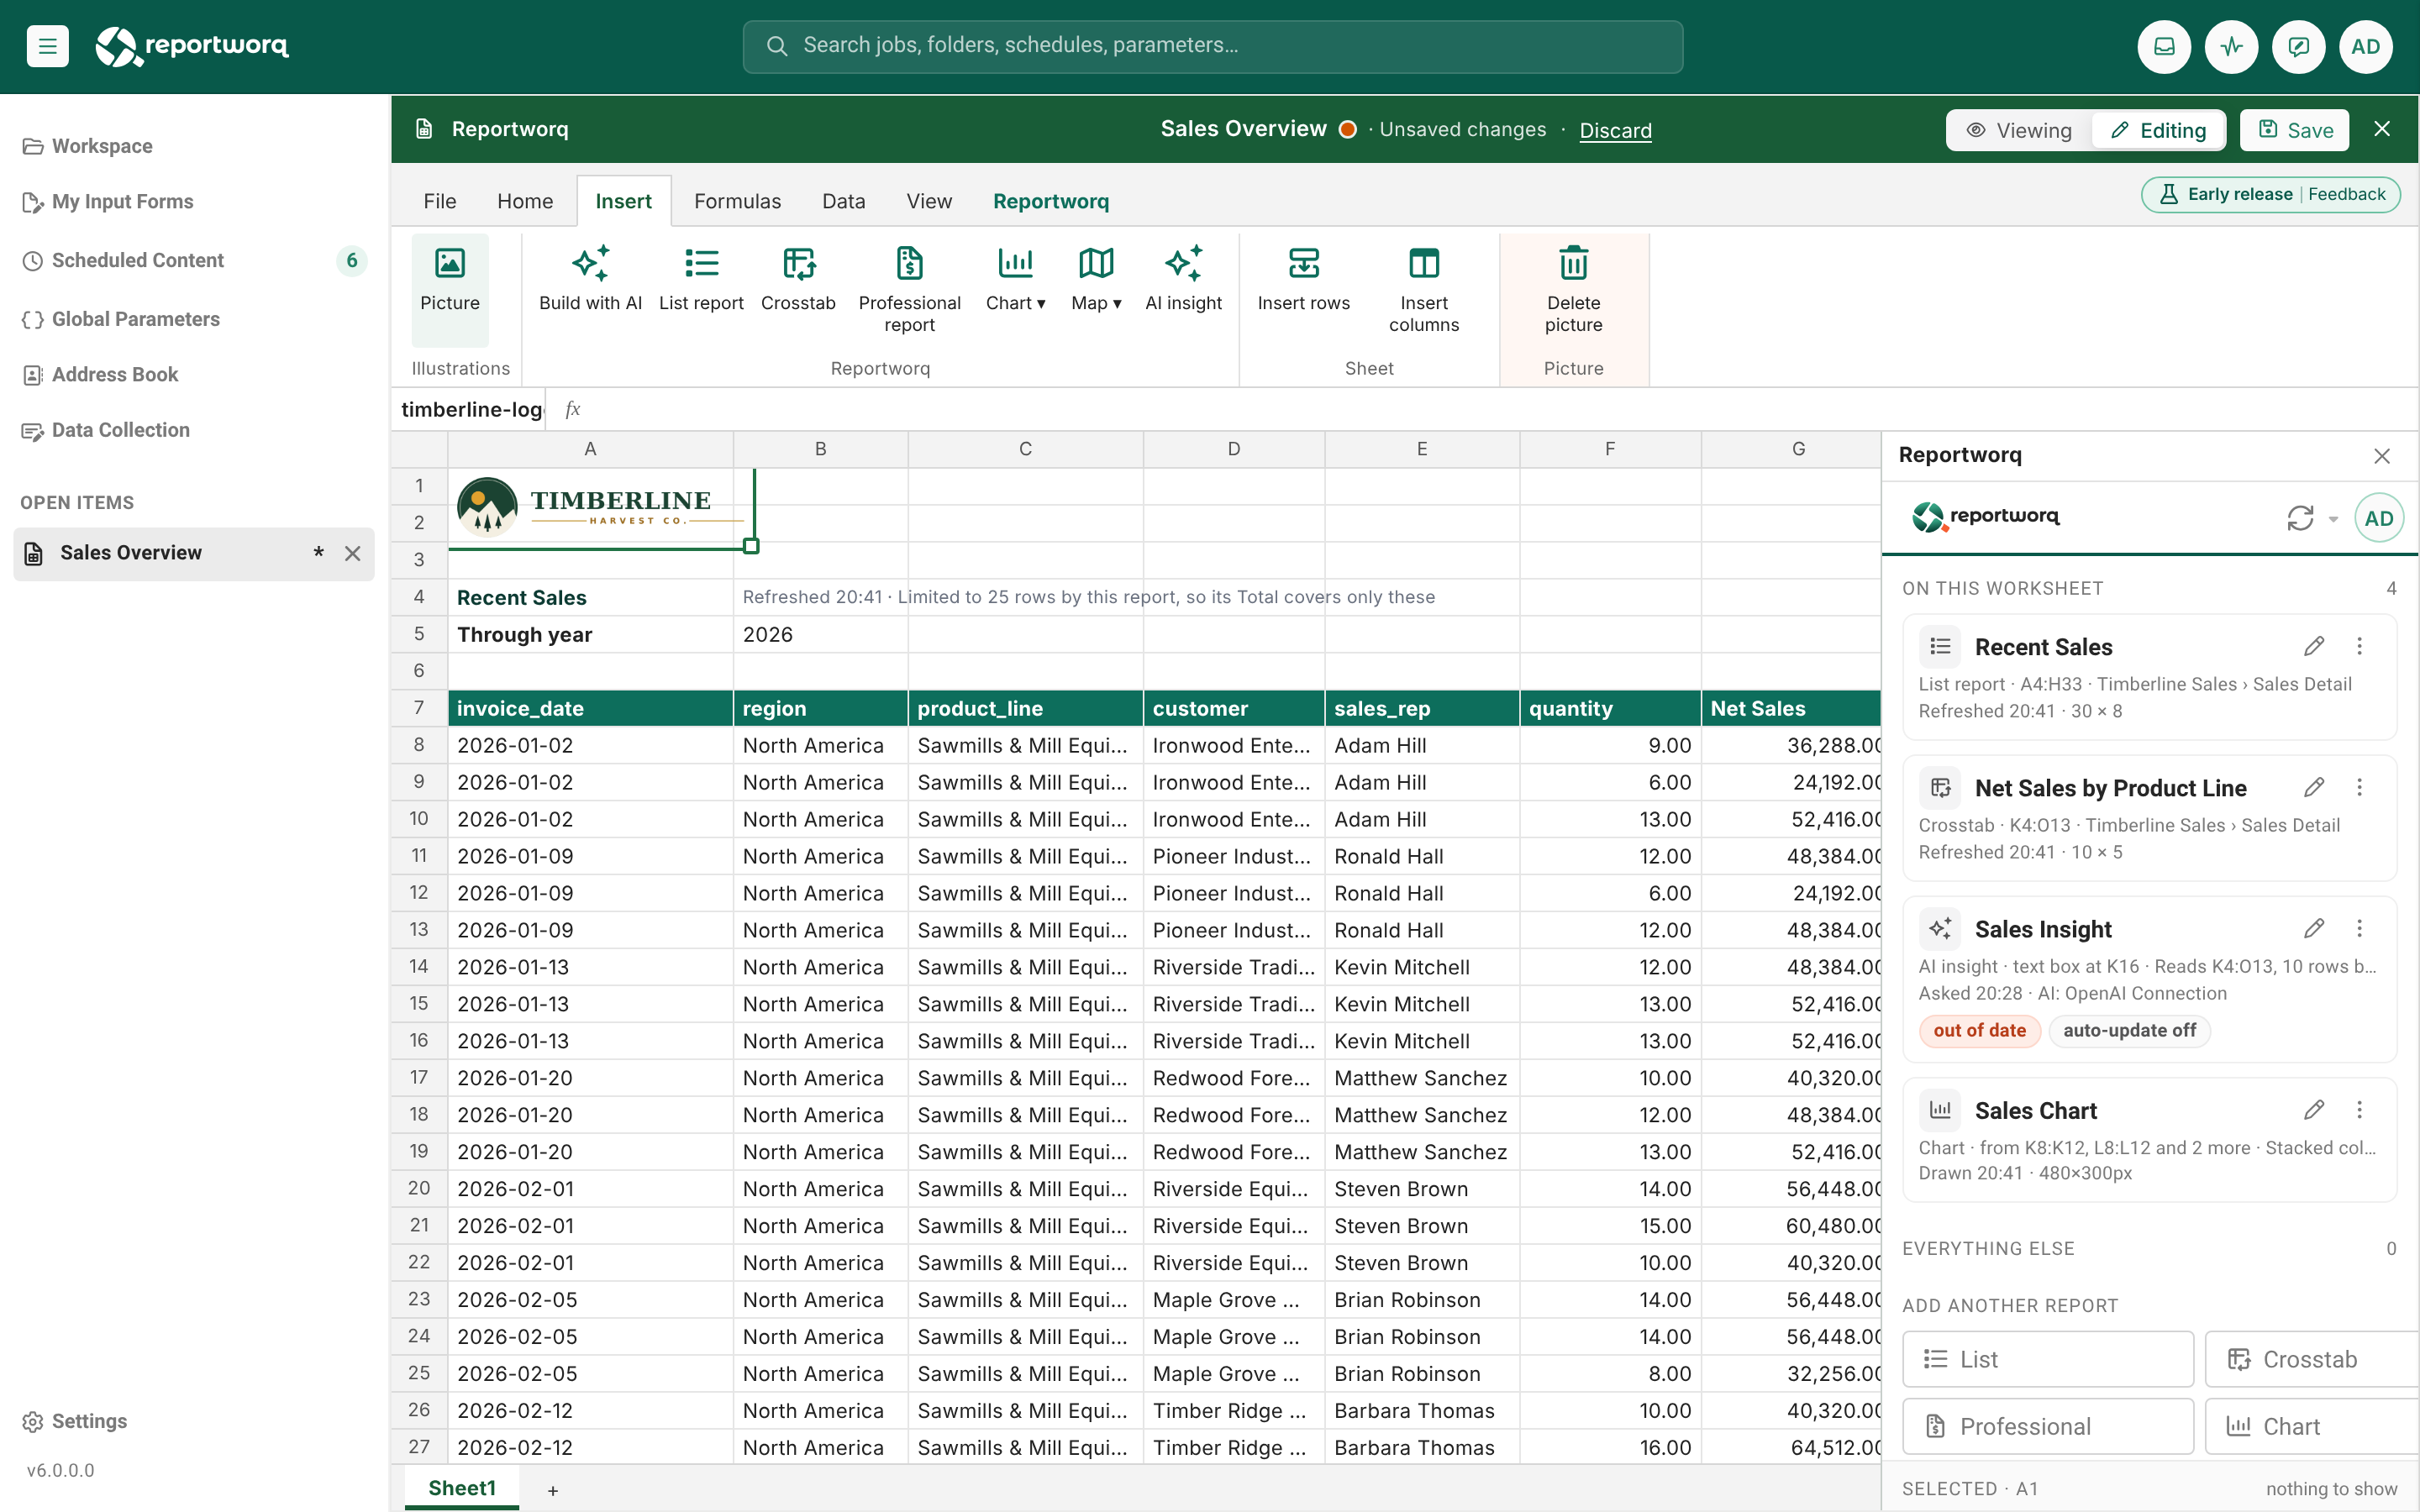
To remove a picture, select it and choose Delete picture in the Picture group that appears on the Insert tab.
If a file is refused, a message under the ribbon says why, for example "logo.png" wasn't inserted. The file is 3 MB; the limit is 2 MB.
Save, Save a copy and Discard#
A web report is saved only when you save it. There is no autosave.
- Save (or Ctrl+S, or File then Save) writes the report. The button is dim and reads "Saved: nothing to save" when there is nothing new.
- Save a copy (on the File tab) saves the report as a new item named like "Sales pack (copy)" in the same folder. If you have unsaved changes, they go into the copy, and this tab then edits the copy; the original stays as you last saved it. With no unsaved changes, the copy is made and you stay on the original.
- Discard (in the title bar, next to Unsaved changes) reopens the report as last saved, on the sheet you are on. Undoing every change by hand also clears the marker.
- Close asks first when there are unsaved changes: "Save them before closing? Discard closes the report as last saved." The choices are Cancel, Discard and Save. Switching to Viewing asks the same question. Leaving or reloading the page also gets the browser's own warning.
- Undo and Redo (Ctrl+Z and Ctrl+Y, or Undo on the Home tab) step back through cell, format, size, sheet and report-definition changes. They are not available while a report is refreshing.

Opening or refreshing a report never counts as a change. Only edits to the page or to a report's definition do.
A save counts only when the server reads back exactly what you wrote. If it cannot, the studio keeps your edits as unsaved and shows "The report wasn't saved" with the reason, so you never see "Saved" for a report that reopens empty. If someone else saved the same report between your write and the check, the message says it was saved again, perhaps in another tab, and your changes are still on screen: save again to replace that version, or reopen the report to see theirs. Two authors editing the same web report at once is not guarded beyond this, and the last save wins.
Refresh#
The studio reads each report's data when you open it. Refresh all on the File tab re-queries every report; it is dim while a refresh is already running. While a refresh runs, the sheet shows "Refreshing. The sheet takes typing again when the reports are back." and does not take typing.
Move a workbook in or out#
On the File tab, the Excel group has three buttons:
| Button | What it does |
|---|---|
| Import workbook | Replaces what is on the page with an .xlsx file. A workbook that was downloaded as Excel, connected brings its reports back live; any other workbook comes in as a plain page. It asks first ("replaces everything in ... on screen") and nothing is saved until you choose Save. |
| Open workbook | Makes a new web report from an .xlsx in the same folder, named after the file, in a tab of its own. Your current report is not changed. |
| Export to Excel | Downloads this report as an Excel workbook. |
A workbook for either import must be 25 MB or smaller. It may unpack to at most 200 MB, hold at most 10,000 files inside, and contain at most 100 pictures (5 MB each, 20 MB together). Hidden sheets and chart sheets are skipped. A sheet name Excel itself would refuse is renamed and the File tab tells you. If a workbook holds more than 100,000 cells past column AZ or row 1,000, it is refused with "This workbook holds more than the 100,000 cells outside A1:AZ1000 that the studio can keep: move or remove that content in Excel, then open it again."
In the workspace, each web report also has the row actions Export as Excel (a connected workbook saved beside the report, which stays as it is) and Convert to Excel (the same workbook, with the web report replaced). Convert cannot be undone; read Convert to Excel before you use it.
Notes and limits#
- What the report uses. The report's Properties list its Data models, Views, Connections and Reports on it. These are worked out each time you save and cannot be edited. A distribution job that uses the report shows under Used by.
- Finding web reports. The workspace has a Web Reports filter, shown when the folder holds at least one. Web reports have their own filter, apart from Distribution Jobs.
- Open as a full page. On the View tab, Launch in embed mode opens the saved report in a new browser tab, showing only the report in Viewing. It is dim until you save, because it shows the report as saved.
- Formulas. Your own formulas in cells are calculated, but only for a common list of Excel functions. A function off the list shows
#NAME?rather than a number that looks right. A formula that points past row 1,000 or column AZ shows#REF!. - Older files. A report saved by a newer version of Reportworq will not open in an older one.
Going deeper. To see how a web report and an Excel workbook relate, and which one to build in, see The Excel add-in and the studio. To send a web report's numbers to readers, see A web report as a job source.
Feedback on this page
Comments, questions, requests, or something missing or unclear? Email us - the page you are on is filled in for you.
Email feedback on this pageOr write to support@reportworq.com directly.