
Data models#
Early release. This feature is in early release, so its screens and behavior may change. Tell us what you think with Send feedback. See Early release features and Send feedback.
A data model is a reusable, governed layer between a source system and the people who build reports. It reads one or more sources and shapes them into curated views, and those views are what report authors use when they build reports in the Excel add-in or in the web report studio. A model lets you rename and reshape source columns into clean business fields once, so every report reads from a stable vocabulary that survives changes to the underlying source schema.
A model feeds two downstream workflows, not just reporting: Distribution Jobs (template-based output) and Contribution Campaigns (input forms). A contribution form binds to a model view the same way a report does, so curate a model as a shared vocabulary, not just a report source.
A model can read several sources at once: any number of Integrations connections and workspace files, side by side. A planning cube, a SQL database and a workbook can all feed one model, and each view draws from one of them.
Modeling a single workbook or database that lives in this workspace? You do not need a datasource connection at all. See Build a data model from a workspace file - it is the quickest way to get from a file in your workspace to a working model, with nothing added to Integrations.
Before you begin#
- At least one source to read: either a datasource connection that tests successfully (see Connect a data source), or an Excel workbook or SQLite database that already lives in this workspace (see Build a data model from a workspace file).
- You have permission to author data models in the workspace.
The model editor at a glance#
A model is edited in the workspace. The rail on the left lists the model's Source, then its joined views in a Joined views folder, then its other views in a folder per source. The Source entry's second line names the source the model reads (a connection or a workspace file), or how many when it reads several (for example 3 sources), or No source until you add one; its tooltip lists every source. Beside Source, a + Add button starts a new view (below). Select an entry to open it; your place on each screen is kept while you move between them, so you can check a table on Source and return to a half-built view without losing it.
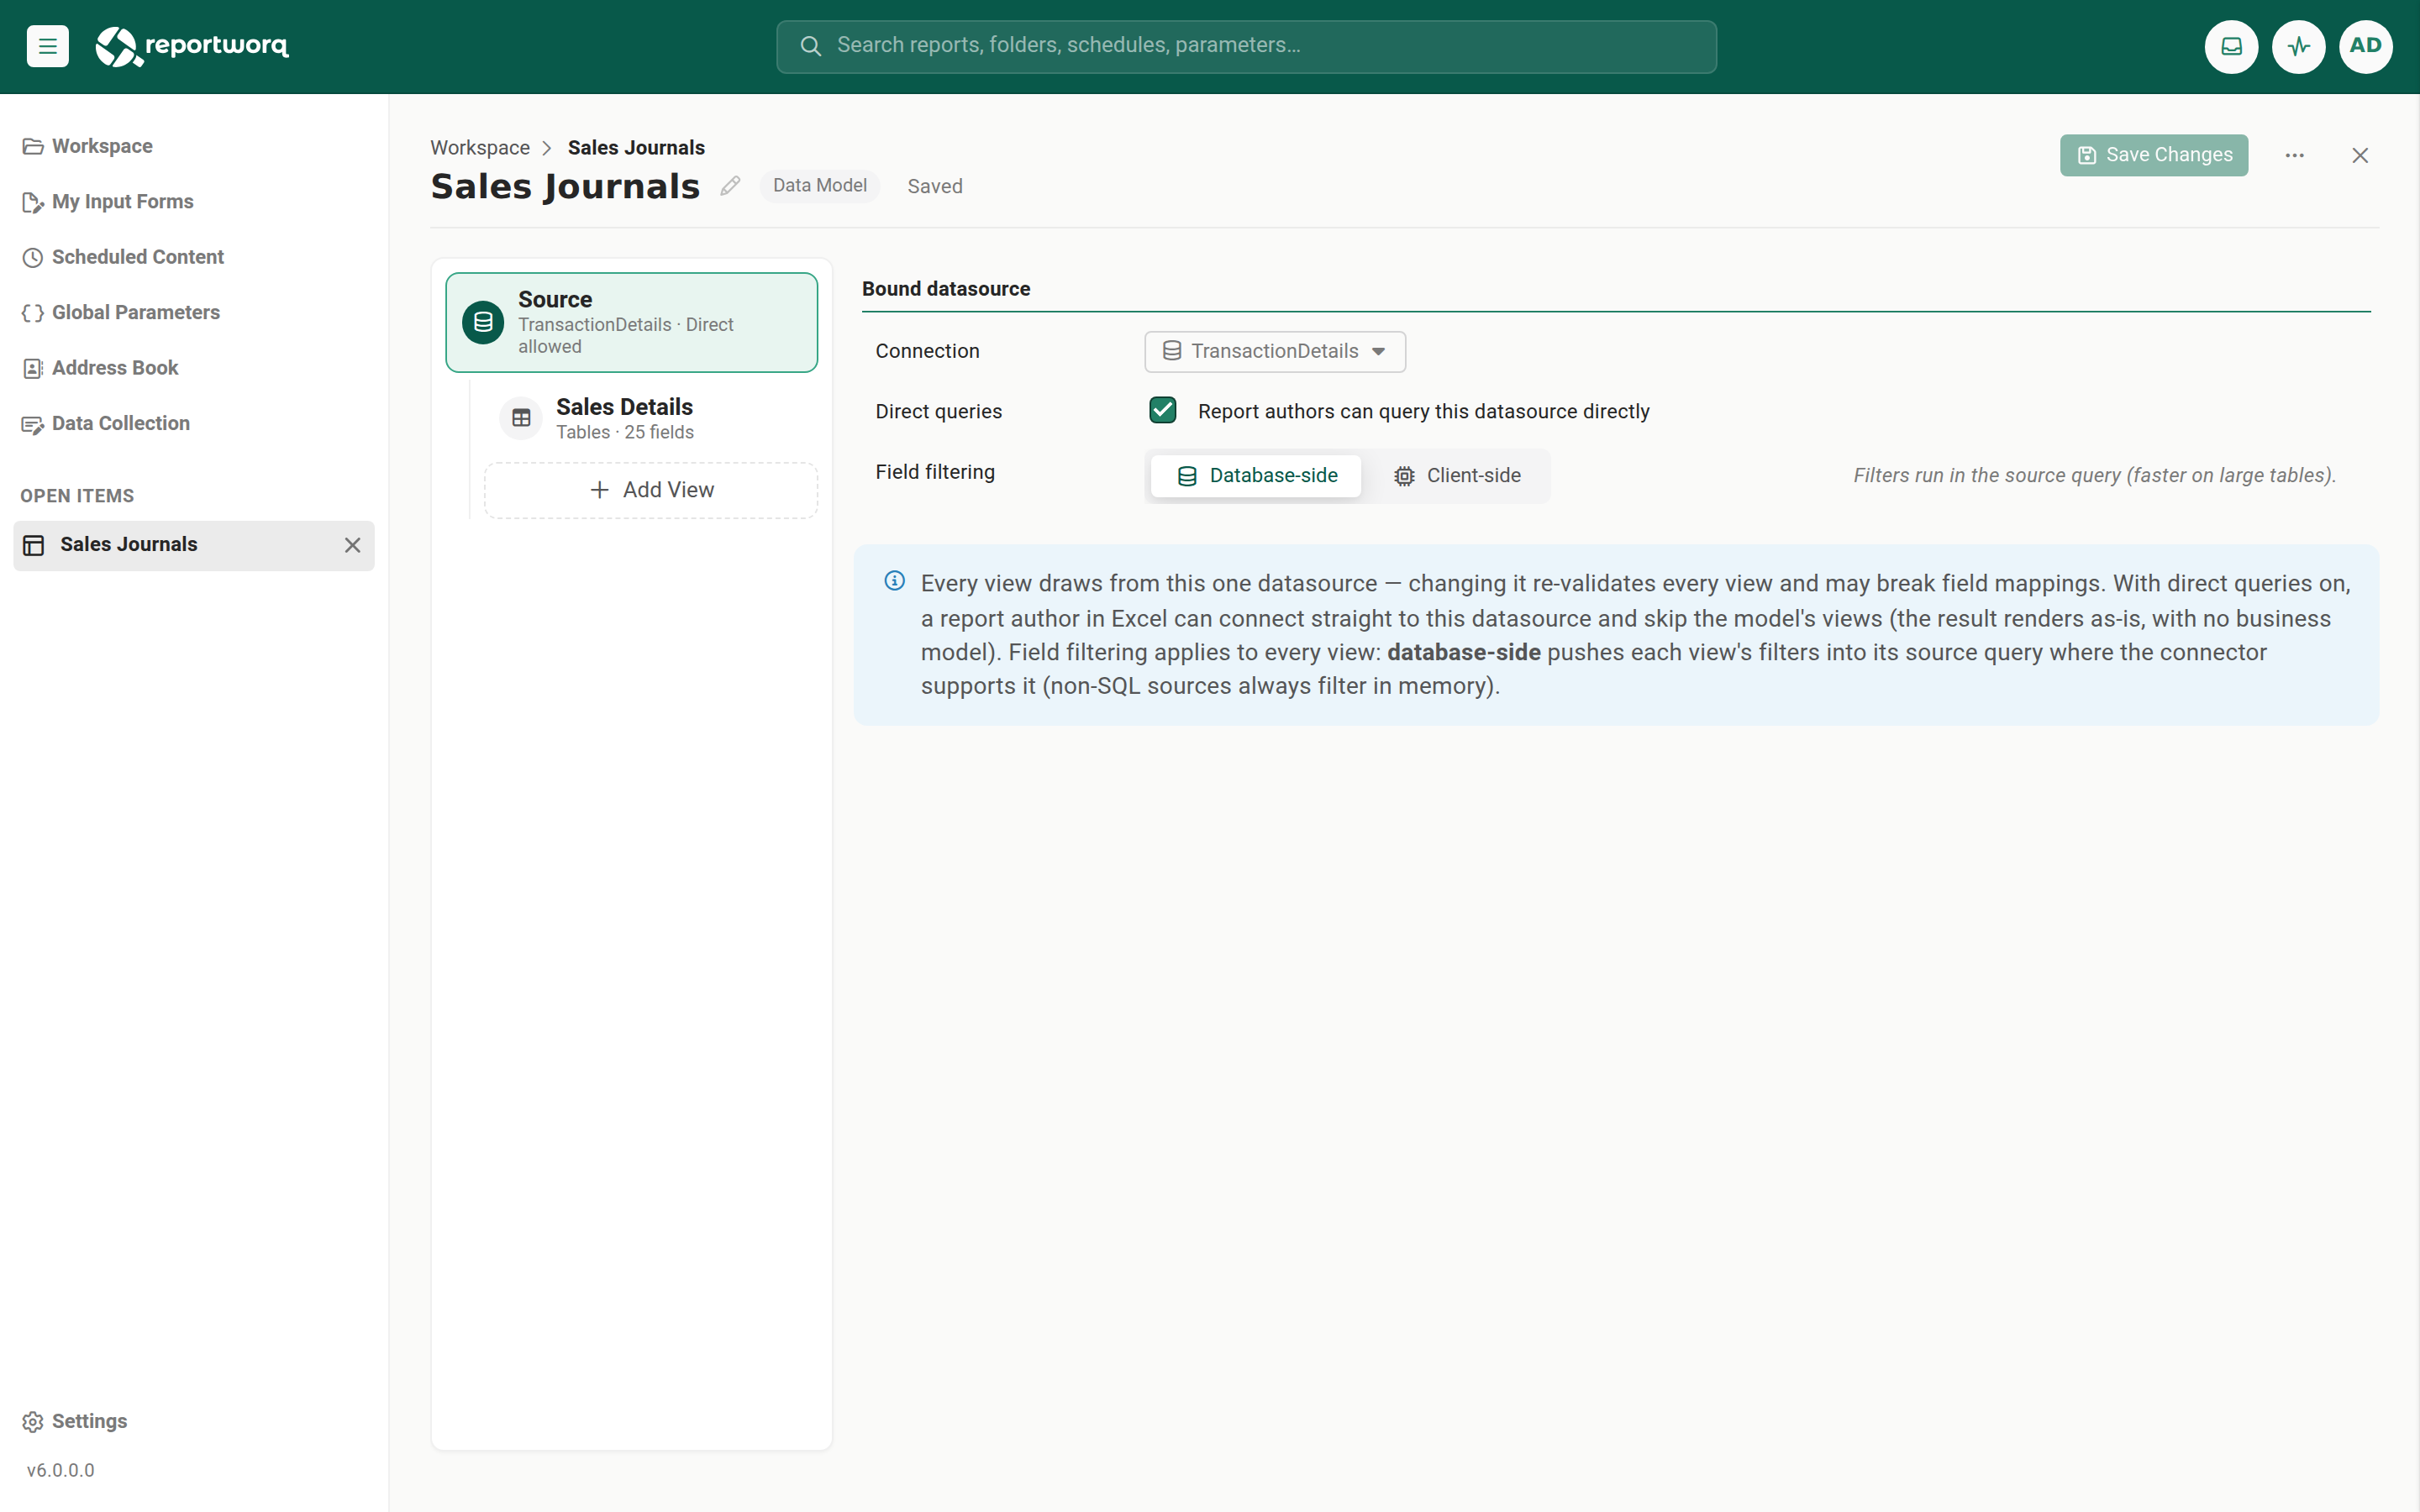
- Source (model level). The Source screen opens on its Sources tab, which lists every source the model reads, with Change (point it at another connection or file) and Remove beside each, plus Add connection and Add workspace file… to add more (see Build a data model from a workspace file). One Direct queries checkbox on this tab applies to the whole model (see Direct queries). The Tables tab lets you look at the rows and links of any SQL source, including a SQLite or Excel workspace file, before you build a view. See Explore the source. Export on each source's row copies all its tables to one workbook (see Export a whole source to Excel). Ask AI, at the top right of the Source screen, opens the data model assistant (see Get views suggested by the AI assistant).
- A source that is missing or disabled is flagged when the model opens. If a source's connection has been deleted from Integrations or disabled, or its workspace file has been moved, renamed or deleted, an exclamation mark appears beside the source's folder in the rail (point to it to read why), and the source's row on the Sources tab explains how to fix it. This check only confirms that the connection or file is still there. It does not sign in to the source or test that it can be reached, so a problem of that kind shows when a view runs.
- Add a view. The + Add button on the rail's Source node opens a short list, Add a view of…, with one entry per source, then Joined view. A model with no source yet offers Add a source first…, which opens the Sources tab. Each source's folder in the rail also has its own plus sign. A view whose source was removed moves to a No source folder; open it to point it at a source again. Choose a source and you get a new view of that source, opened in the editor that suits it: the table designer for a SQL database, the cube view editor for Planning Analytics, and so on. Choose Joined view to combine views of the model, usually across sources (see Join views across sources).
- Views. A view is the model's unit of output: one source query plus a curated set of fields. A model can hold several, and each reads from one of its sources. Each view has four tabs, and every tab is always available:
- Design (on SQL datasources) or Connection (on every other connector) defines what the view queries, whether the view's source is a configured connection or a workspace file. On a SQL datasource you build the view on a canvas of tables and their relationships, or write it as SQL. See Build a view with the designer. On other connectors the tab holds that connector's own query settings, for example a cube data view for Planning Analytics. There is no import step on either: the view's fields follow its query, as described under the list. A joined view has a canvas of its own (see Join views across sources).
- Fields is the curated reporting field list, generated from the view's query. Each field decouples its reporting-facing Id and Name from the source column it maps to (the Mapped Field), so renaming or re-mapping a source column does not break downstream reports. Fields can be hidden, reordered, renamed, re-typed, filtered, added, or deleted.
- Variables are the
{{tokens}}that parameterize the view's query and field filters, and flow downstream to reporting and bursting. Set each one's default, whether it is required, and how a report prompts for it. See Data model variables. - Preview runs the view and shows the resolved rows after variables and field projection are applied.
Fields follow the query. There is no button to import fields. When you leave the Design or Connection tab, and when you select Save Changes, Reportworq runs any query that changed and brings the view's fields up to date. While it runs, the view reads "Updating fields from the query". If the query cannot run yet, for example because a {{variable}} has no sample value (a joined view never asks for one: its fields come from its inputs' samples or defaults), a warning explains why and the view reads "Fields may not match the query yet" until the next tab change or save. On the designer canvas, fields are added as you tick columns, so a designed view is always up to date.
Explore the source#
The Source screen has a Sources tab and, once the model has a SQL source to browse, a Tables tab. A model with nothing to browse yet opens on Sources; a connected SQL model opens on Tables. When the model has several SQL sources, the table list has one folder per source, so you always know which source a table belongs to. The table you select stays selected while you visit Sources and come back.
Use Tables to find the table a view should start from, and to check how it links to other tables before you build.
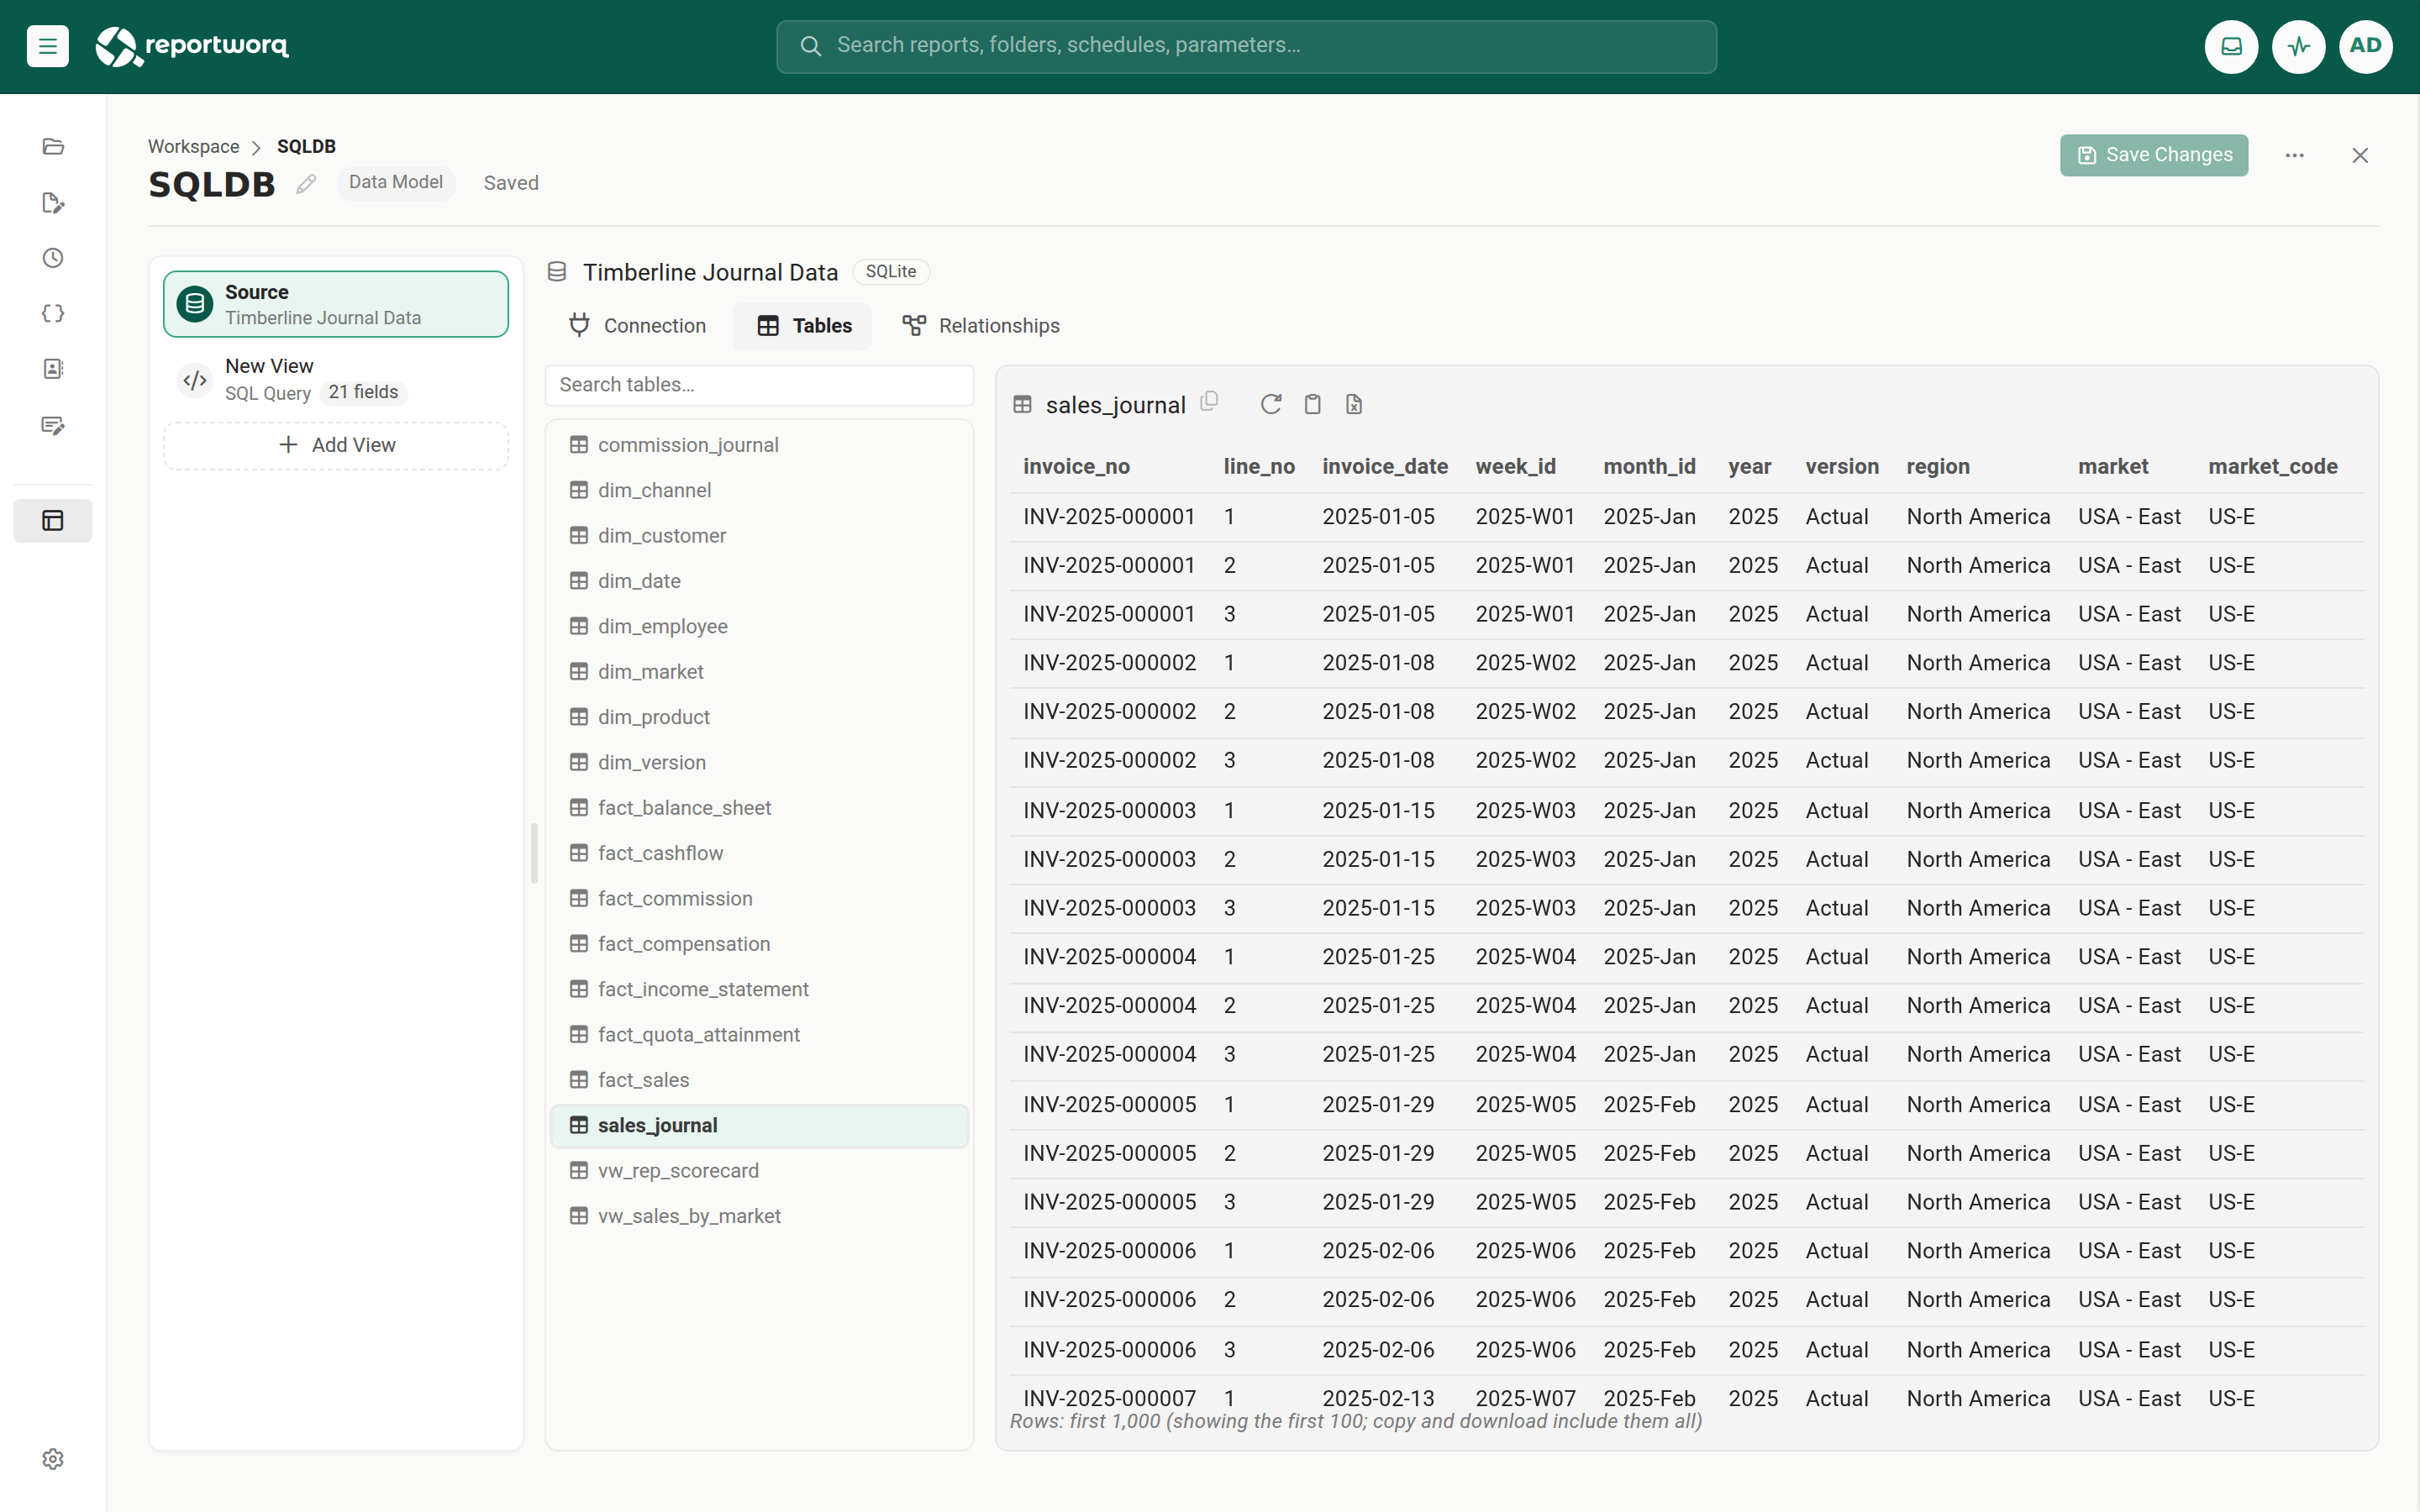
- Select Source in the rail, then Tables.
- Select a table in the list on the left. Use Search tables to narrow a long list.
- Review the table's links in the Relationships section above its rows: those the source declares, those Reportworq infers, and any you defined on the model. Select the plus sign beside Relationships to add one, or select Relationships to collapse the section and give the rows more room. See Table relationships.
- Review the table's rows. The grid reads at most 1,000 rows, and the row count under it says how many were read.
- Optional: select the clipboard button to copy every row of the table with a header row, ready to paste into Excel, or the Excel button to download a workbook of the table (what it is, its relationships, and every row). The small copy icon beside the table name copies the name. To download every table of the source at once, see Export a whole source to Excel. For all the ways to look at a model's data, see Discover your data.
The refresh button reads the table and its relationships again. Table relationships are kept per source, because a relationship becomes SQL and can only relate tables of one source. To relate views of different sources, use a joined view's relationships between views instead (see Join views across sources).
Get views suggested by the AI assistant#
The data model assistant reads the model's sources and suggests a set of views, joined views included, with business names for their fields. Where the data rolls up naturally (state to region, product to category), it also suggests hierarchies and makes them for you. It is a quick way to start a model over an unfamiliar source.
The assistant needs an AI provider. An administrator adds one in Settings > Integrations (see Connect an AI provider). The assistant uses the AI connection selected for the in-app chat assistant, when one was selected and it is enabled; otherwise it uses the first enabled AI connection. With no enabled AI connection, the panel says "No AI model is set up" and offers nothing to run.
What the assistant reads, and what it sends to your AI provider. When you select Analyze my data, the assistant reads each source: it lists the tables (up to 80 per source) with their columns and links, and it runs a small sample read of two rows on each of up to 40 tables per source (12 for a cloud connector, where each sample read is a call to the service's API). It then sends the provider each source's name and type, those table and column names and types, the links between tables, the names and fields of the model's existing views, the names and levels of its hierarchies, and the sample rows, each value cut to 40 characters. Those sample rows are real values from your data, and they leave Reportworq for the provider. The sample reads run against every source of the model, including a connection an administrator has disabled in Integrations. The assistant never changes the model until you add what it proposes, and it never writes SQL. Decide whether that suits the source before you select Analyze my data.
- Open the data model and select Source in the rail.
- Select Ask AI at the top right. The assistant panel opens over the editor; Save Changes stays within reach. To move the panel out of the way, drag it by its header. Double-click the header, or select the dock button, to put it back; the panel remembers where you left it in this browser.
- Select Analyze my data. The assistant reads the sources, explains what the data is and which questions it can answer, and offers options.
- Reply in the box to steer it, for example "views for a monthly sales pack by region". When it proposes views and hierarchies, each comes with a check box.
- Clear the check box of any view or hierarchy you do not want, then select the add button (for example Add these views, or Add 1 view and 1 hierarchy). They are added unsaved: views to the rail, hierarchies to the Hierarchies tab of the Source screen.
- Review each view and hierarchy, then select Save Changes to keep them, or Discard to drop them.
Reportworq checks every proposed view against what the source really has, and leaves out (with a note) any table, column, or link that does not exist. A filter the assistant proposes becomes an optional filter variable, so a blank value returns every row. Closing the panel keeps the conversation; select Start over to begin a new one. An administrator can tune the assistant's instructions in Settings > AI Prompts (see The AI prompt store). The assistant never writes SQL: every view it suggests, a hierarchy's own included, is a table and columns that must exist in the source, and Reportworq writes the query. A suggestion that comes back with SQL in it is left out, with a note, and nothing in it runs.
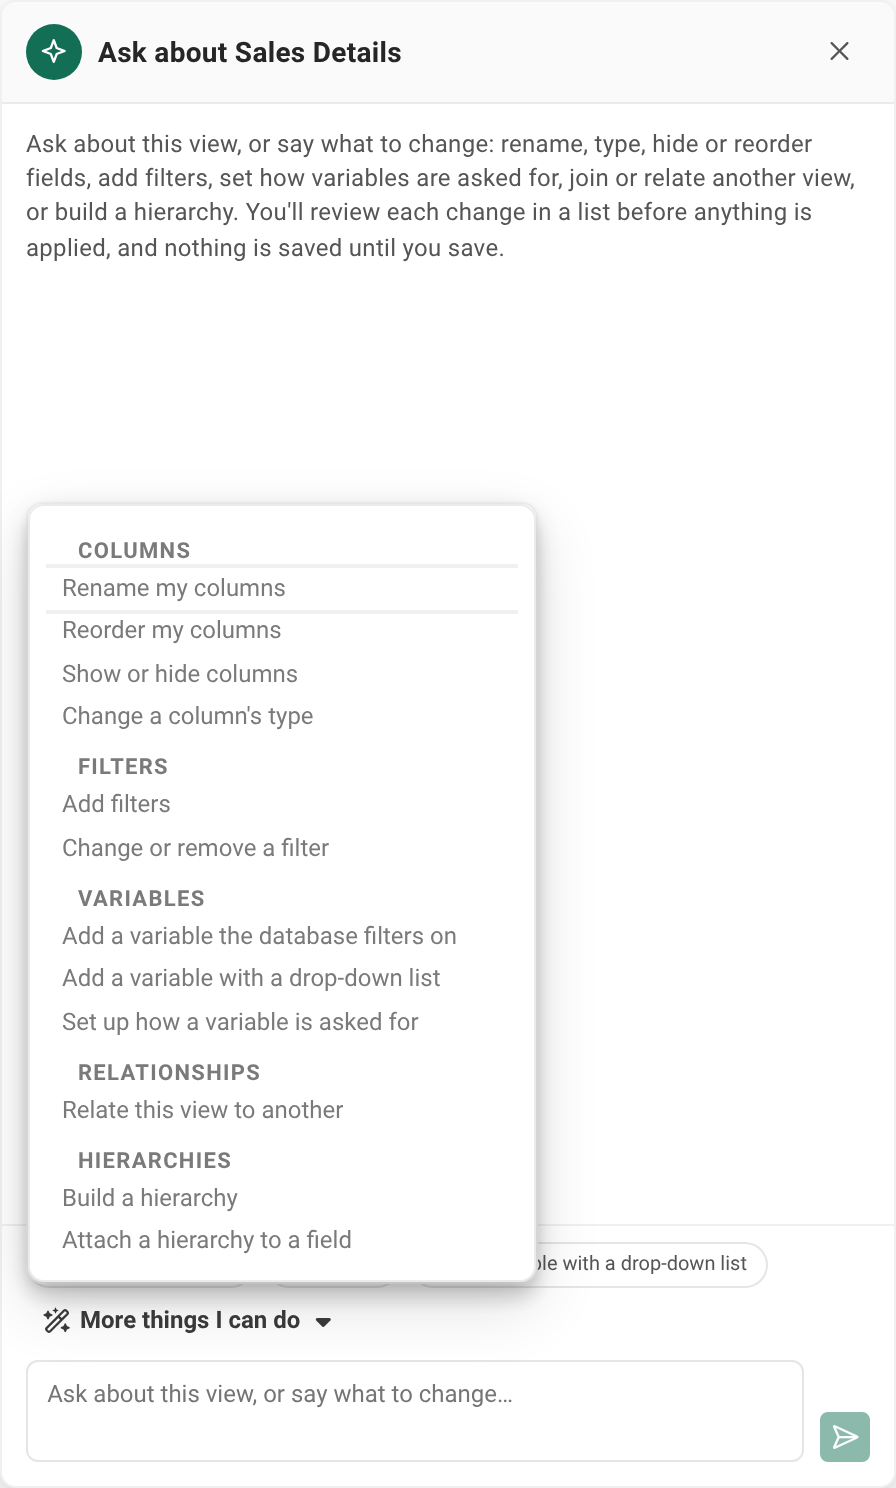
What you can ask for. Once the assistant has analyzed the data, three chips under the chat offer the most common requests: Suggest views for my reports, Build a joined view and Build hierarchies. More things I can do opens the whole list, by group:
| Group | Starter |
|---|---|
| Views | Suggest views for my reports |
| Joins | Build a joined view; Find where my sources could join |
| Hierarchies | Build hierarchies |
| Understand the data | Explain what is in my sources; Tell it our naming standards |
Picking one sends nothing: it starts the request for you to finish (see How the starters work). Ask for something it cannot do here, such as changing a view you already have, writing SQL or changing a source, and the assistant says so plainly and proposes nothing; to change a view, open it and use Ask AI inside it.
Hierarchies. A proposed hierarchy lists its levels from the most detailed up (for example State, then Region), the view it reads, and where it is attached. It usually comes with a view of its own: a table and only its level columns (a parent level can come from a table it links to), for example "Reads table Lookups: State, Region". That view is built like any view the assistant suggests, so you can open and edit it like one. A suggestion that sends SQL for a hierarchy's view is refused: the hierarchy is left out with a note, and nothing runs.
A hierarchy is attached to a field name on a source, not to one view: attaching it to State means every view of that source with a field named State gets it, the views you already have included. The card lists those views, and after you add it a note names the existing views it reached, and says so when it is the first hierarchy on their field (professional reports use a field's first hierarchy). Reportworq never replaces a hierarchy you already have: if the name is taken, the new one gets a number ("Sales Territories 2"), and a field that already has a hierarchy keeps it as its first, with the new one added after it. A hierarchy is attached only to fields of views of its own source. A level, field or source that does not exist leaves it out, with a note, and so does anything the card warns about. At most 10 hierarchies come in one reply. Reportworq does not compare the hierarchy's values with the field's values, so open it on the Hierarchies tab and select Preview tree before you save.
Ask AI inside a view#
Inside a view or a joined view, Ask AI helps you shape the view you have open. Ask it to rename fields, set a field's type and format, show, hide or reorder fields, add, change or remove filters, set a variable's default and how it is asked for, join another view (in a joined view), relate this view to another one, or build a hierarchy and attach it to a field. It proposes the changes as a list you review; nothing is applied until you choose, and nothing is saved until you save.
The button sits in the view's header, beside the Public, Hidden and Disabled choice. It only appears when an AI provider is set up.
What Ask AI inside a view sends to your AI provider. With every message, it sends:
- the data model's name, and the open view's name, kind and source;
- each field's name, source column, type (and any type and format you set), whether it is shown, and the sample value the field already holds (a real value from your data, cut to 40 characters);
- each filter condition, with its value (a fixed value you typed, or the
{{Variable}}it uses);- each variable's name, kind, whether it is required, its default value and its caption;
- the view's relationships with other views, and, for a joined view, its starting view, its joins (keys, kind and matching options) and the views it may join;
- the names and fields of the model's other views, and the names and levels of its hierarchies;
- for a view of one source, that source's tables (up to 80) and their column names and types;
- the conversation so far, including the list of changes you applied or skipped and the reasons.
It reads no rows from your data: the only values from the data are the sample values the fields already hold, and the values you typed into filters and defaults. It never writes SQL and never changes the view's query.
Open the view (or joined view) and select Ask AI in its header. The panel opens, titled "Ask about" and the view's name.
Say what you want, for example "Tidy the field names and hide the id columns", or "Join Teams on TeamId". Or pick one of the chips under the chat, or a request from More things I can do, and finish it (see How the starters work).
The assistant lists its changes, each with a check box. Each line says exactly what the change does, written by Reportworq from the change itself (for example "Rename cust_nm to Customer" or "Filter Status <> Open"); the assistant's own description, when it says something else, is shown under it. Clear the check box of any change you do not want.
A change Ask AI already knows it can't make is grayed out, with the reason on its line, and can't be ticked, so you never apply it by mistake. For example, if Ask AI writes a
{{Token}}into a filter's fixed value, the change says the filter holds a token and isn't a fixed value, and that to let each report pick the value you ask for a filter on a variable. The change that would set up how that variable is asked for, or its default, is grayed out with it, because the variable would only come from the filter that can't be added. A change to a variable is grayed out too when the view doesn't have that variable, when it is pasted into the query as raw text (only you set those), or when it uses the settings from one of the joined view's inputs (change it on that view). The other changes in the reply can still be ticked and applied, and once you apply them, Ask AI is told which changes weren't made, so it doesn't offer them again.When none of the changes in a reply can be made, and at least one can't be made for a reason like these, Ask AI answers in a plain sentence that says why instead. When every change was refused this way, it lists no changes at all; a change it does not support yet still shows on the list, grayed out. A reply made only of changes Ask AI does not support yet keeps the assistant's own answer, with those changes grayed out.
Select Apply selected (it stays off until at least one change is ticked). The changes are applied in order, unsaved, exactly as if you had made them yourself on the view's tabs. Each line then says what happened: applied, or skipped with the reason (for example "no field TeamId in Players"), and a summary such as "Applied 5 of 6" heads the list.
Review the view, then select Save Changes to keep the changes, or Discard to drop all of them.
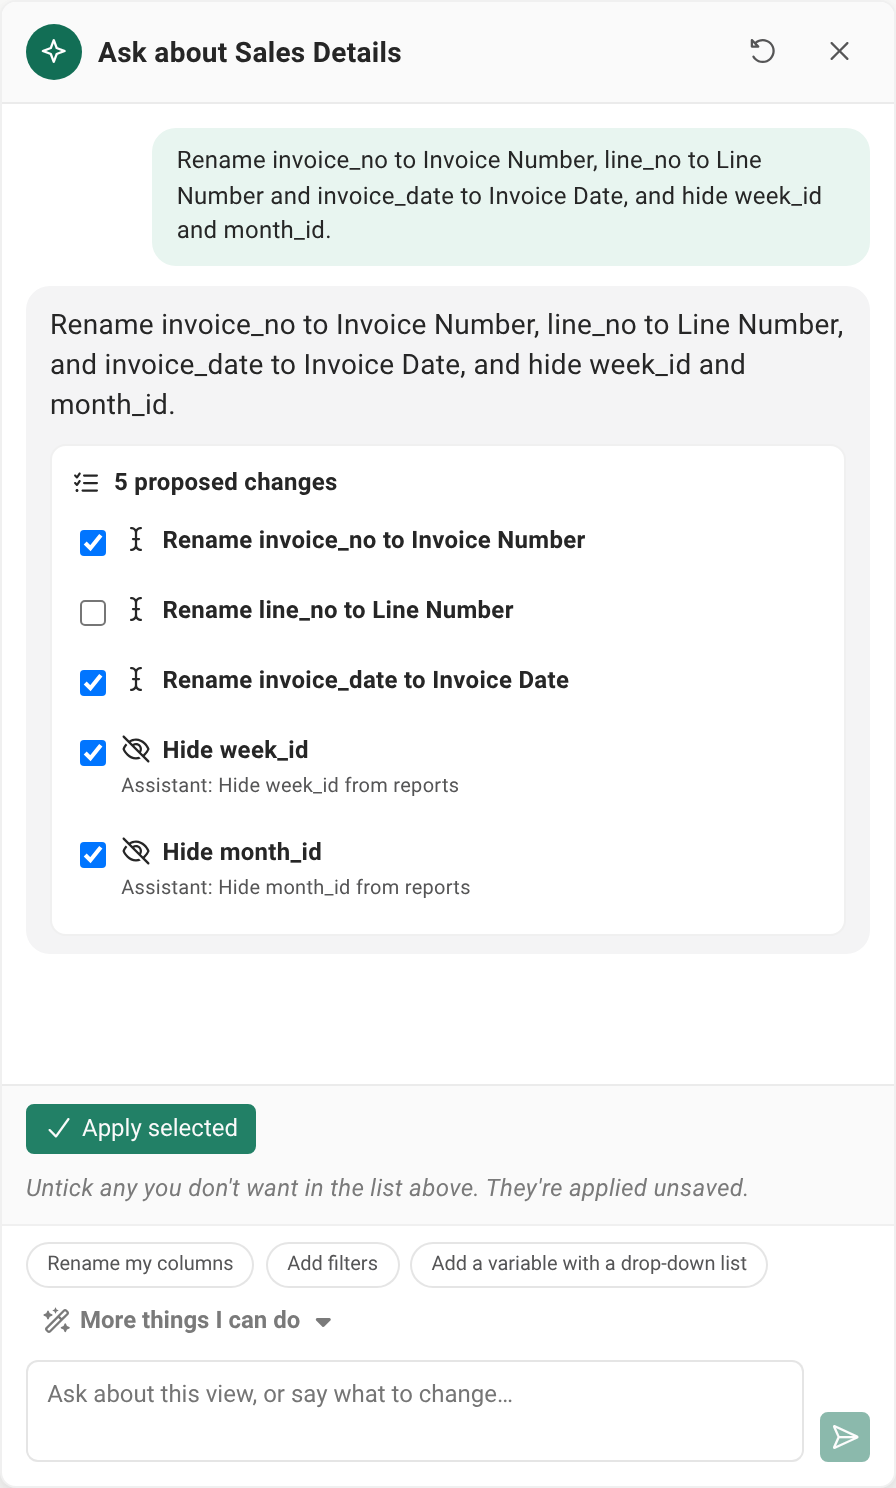
A change that cannot be made is skipped and the rest still apply: a field the view does not have, a name another field already uses, a join that would make a view read itself (a cycle), a second copy of a view that is already in the joined view (add that copy in the joined view editor), a join from a view an Only in left or Only in right join leaves out, a relationship that already exists, or, in a joined view, a change to a variable listed after a join, when the variable still can't be set once that join is made. If you save or discard while changes are being applied, the ones not yet applied are skipped and say so. A change Ask AI does not support yet is shown as "Not supported yet" and is never applied; so is any change that comes with SQL. Ask AI never sets a variable that is pasted into the query as raw text (the Raw query text, pasted as is option on the Variables tab): a change to one is grayed out before you apply anything, as above. Any default it sets is filled into the query by the same safe rules as a value a reader types (see Data model variables). Joining or relating views follows the same rules as the joined view's canvas: a join to a view this one is already related to follows that relationship, and changing how rows match changes the relationship for every joined view that uses it. Rewriting a SQL view's query is not something Ask AI does: it says what to change, and you change it on the view's Design tab.
Each view keeps its own conversation while the editor is open, and moving to another view moves the panel with you.
What you can ask for#
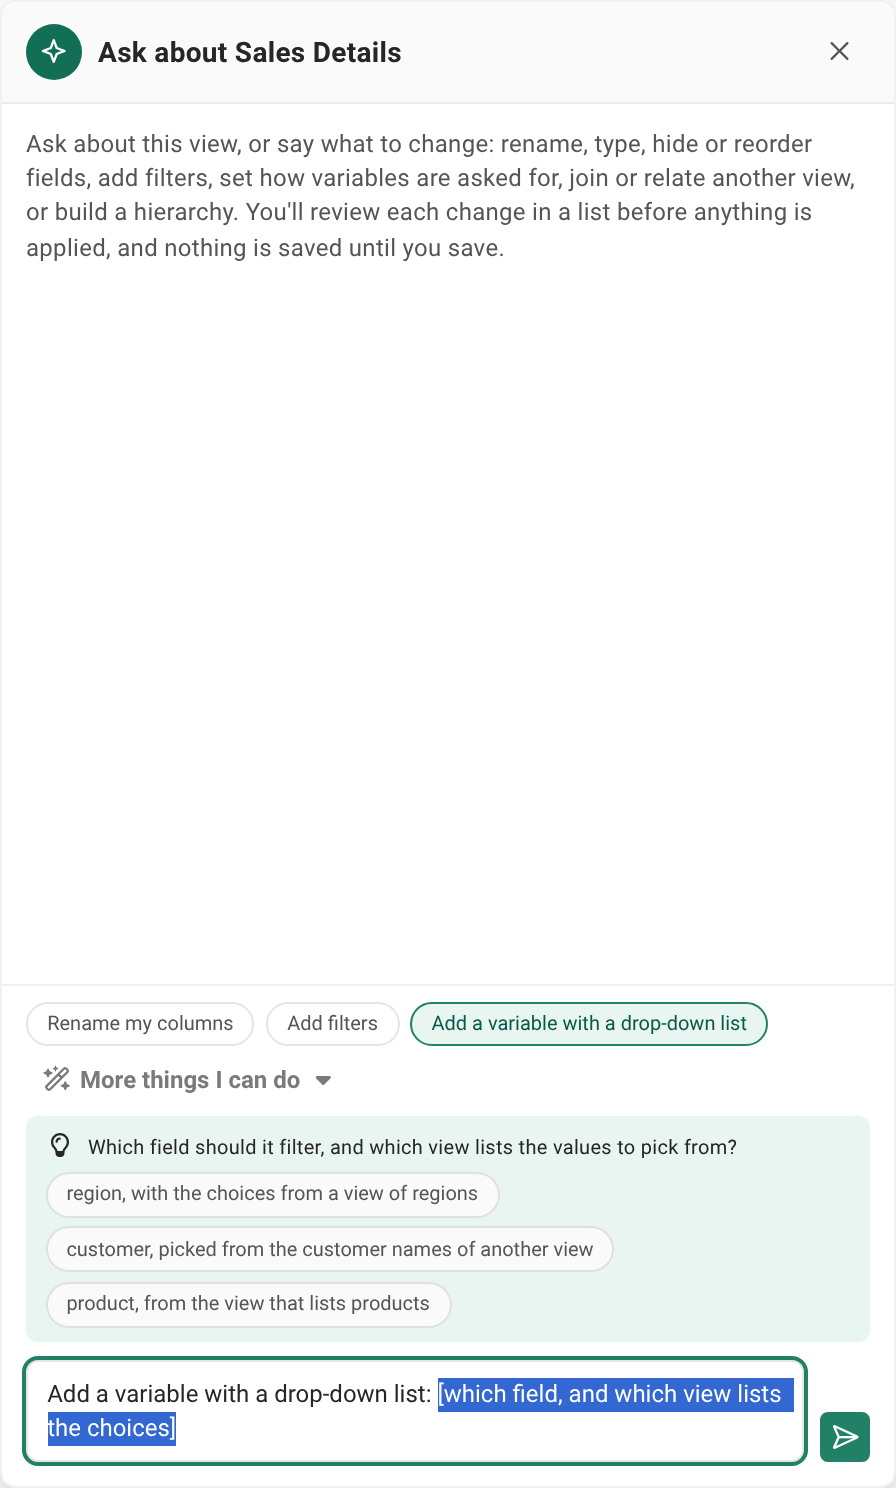
Three chips under the chat offer the most common requests: Rename my columns, Add filters, and Add a variable with a drop-down list (in a joined view, Join another view). More things I can do opens everything Ask AI can do in the view you have open, by group:
| Group | Starter | Offered on |
|---|---|---|
| Columns | Rename my columns; Reorder my columns; Show or hide columns; Change a column's type (text to a date, a number, or yes and no) | Every view |
| Filters | Add filters; Change or remove a filter | Every view |
| Variables | Add a variable the database filters on | A view of one source |
| Variables | Add a variable with a drop-down list (its choices come from a field of another view) | Every view |
| Variables | Set up how a variable is asked for (its default, caption, help text, and whether it is required) | Every view |
| Joins | Join another view; Change how rows match (all from the left, only matches, everything, only in left, only in right; one match or many; ignore case and spaces); Remove a join | A joined view |
| Relationships | Relate this view to another | Every view |
| Hierarchies | Build a hierarchy; Attach a hierarchy to a field | A view of one source |
A variable that filters a view of a database source is applied by the database, so a report reads only the rows it needs. A joined view's own filters can take a variable too; one with the same name as a variable of a view it joins is that same variable, so one value fills both. Ask AI never sets up a variable that is pasted into the query as raw text: that one stays yours. Ask for something outside the list, such as rewriting the view's SQL query or adding a calculated column, and Ask AI says plainly that it cannot do it here and proposes no change.
How the starters work#
Picking a chip or a request from More things I can do never sends anything. It starts the request in the box for you to finish:
- The box holds the start of the request with a part in brackets selected, for example "Add a variable with a drop-down list: [which field, and which view lists the choices]". Type to replace the bracketed part. If you had already typed something, it stays, and the request starts on a new line after it. Pick another request before you finish this one and only the unfinished request is replaced: what you typed is kept, however many times you pick.
- Above the box, a question says what to tell it ("Which field should it filter, and which view lists the values to pick from?"), with a few example answers. Select an example to put it in place of the bracketed part; the rest of the box is left as it is.
- Edit the request as you like, then send it. Pressing Enter while the bracketed part is still there selects it again rather than sending half a request. Clearing the box or sending puts the question away.
More things I can do works from the keyboard too: open it with Enter or Space, move through the list with the arrow keys, press Enter to pick a request, or Escape or Tab to close the list.
The Source screen's assistant works the same way, with its own list (see What you can ask for above).
The assistant is told the same list, so it knows what it can do in each place. An administrator who saved their own version of an assistant's instructions in Settings > AI Prompts keeps that text: it does not gain the list. Reset it to the default to get it (see The AI prompt store).
Join views across sources#
A joined view combines the rows of other views of the same model, usually views of different sources: actuals from the ERP beside a forecast from the planning cube, or CRM sales reps beside HR employees. Each input runs on its own, then Reportworq matches the rows by the fields you choose. You relate two views once, check the match on real rows with Test match or let Discover relationship find the key, and line up values the two systems write differently with a value mapping. Explain shows how a joined view runs and what helps or hurts it.
See Join views across sources.
Build hierarchies#
A hierarchy rolls a field's values up into groups: sales reps into teams, states into regions, players into teams, divisions and sports. Attach one to a field, and the crosstabs of web reports and Explore can show subtotals for each group. A hierarchy belongs to one source of the model, and you build it on the Hierarchies tab of the Source screen.
There are two kinds:
- Manual: you type the members and how they roll up, as an indented outline.
- Levels: you pick a view of the model and the fields it rolls up through, from the most detailed up, for example Player, Team, Division, Sport. The members are read from the view's data each time a report uses the hierarchy, so they stay current as the data changes.
Create or edit a hierarchy#
- Open the data model, select Source in the rail, and select the Hierarchies tab. The tab lists every hierarchy of the model, with its Type, what it is Built from, its Size, and the fields it is Attached to.
- Select New hierarchy, or Edit on a hierarchy's row. The hierarchy opens on its own screen; the Hierarchies link at the top goes back to the list.
- Enter a Name, and choose the Type: Manual or Levels.
- For a Manual hierarchy, choose the source it is Built from (when the model has several), then type the outline under Members: one member per line, indented two spaces or a tab per level. A line with lines under it is a group; a line without is a value of the field you will attach the hierarchy to.
- For a Levels hierarchy, choose the View to read. The list offers every view of every source of the model (not joined views), with the source in brackets when the model has several. Then, under Levels, from the leaf up, choose a field for each level: the first is the most detailed (the values the report's field holds), the last is the top. Use Add a level above, the arrows and the remove button to arrange them. A hierarchy needs at least two levels.
- Select Preview tree to see the members the hierarchy gives, with anything the data says about them under What the data says, for example a team that rolls up to two divisions. It reads the view as you have it in the editor, unsaved changes included.
- Select Save hierarchy, then Save Changes to save the data model. The hierarchy is saved with the model, so it is kept when the server restarts, and it travels with the model when you copy, export or import it.
How a Levels hierarchy reads its view:
- Each value is one member, however many rows hold it, matched without regard to case. The order is the order the view returns its rows, so sort the view to sort the hierarchy.
- A member with two parents is reported, not merged. It is shown under the parent of its first row only, so its totals are counted once, and the preview names every parent it has.
- Blank levels are skipped. A member whose parent is blank sits under the next level up that has a value. A row with a blank leaf gives nothing.
- Variables follow the report. When the view has variables, a report reads the hierarchy with its own values, so a report on one season shows that season's teams.
- At most 1,000,000 rows are read. If the view has more, or can't be read when a report runs, the field shows its values without the hierarchy, and the report says so. A hierarchy is never built from only some of the rows.
Attach a hierarchy to a field#
- Open a view of the hierarchy's source and select the Fields tab.
- In the Hierarchies column of the field, select the hierarchy. For a Levels hierarchy, attach it to its most detailed field, the one its leaves are values of. Detach all removes every hierarchy from the field.
- Select Save Changes.
A hierarchy is attached to a field name on its source, so every view of that source with a field of that name gets it. A field can carry several hierarchies: a crosstab lets you choose one.
Move a hierarchy to another source#
A Levels hierarchy belongs to the source of its view. To move it to another source of the model, edit it and choose a view of that source. Reportworq refuses the move, and says why, while the hierarchy is attached to fields (detach it on the Fields tab first), when the other source already has a hierarchy of that name, or when that source has a problem. A Manual hierarchy stays on the source it was created on.
Export a whole source to Excel#
Use Export to copy every table of a source into one Excel workbook, for example to hand a snapshot to someone without access, or to read a source's tables side by side. On Source, open the Sources tab and select Export on the source's row. Export appears on every source whose tables can be browsed (SQL databases, cloud connectors that expose tables, and SQLite or Excel workspace files).
Nothing is exported until you say so. The dialog looks at the source first:
- It inspects. It lists the source's tables, reads each table's columns and counts its rows. Counting rows is skipped for cloud connectors, because counting a table there would mean reading all of it; their tables show columns only.
- It gives a verdict. Quick, Medium or Large, with the number of tables, rows and cells (rows times columns) and a rough time. A table that could not be counted makes the figures a lower bound, so the verdict is never better than Medium. A very large export is refused, with a pointer to download the tables you need one at a time from the Tables tab: past 10,000,000 cells there is no Export button.
- It warns about load. Exporting reads every row of every table. On a database that reads more than 2,000,000 rows, the dialog warns that it can slow the database for other people and suggests running it outside working hours. For a cloud connector it warns that rows are read through the service's API, one table at a time, and count against its rate limits.
- You select Export. A bar shows each table's progress and one bar shows the whole export. Up to two tables are read at a time (one at a time for a cloud connector).
Stop ends the export and downloads nothing. Once every table has been read the workbook is built and sent to your browser, and there is no Stop from that point.
What the workbook contains#
| Sheet | Contents |
|---|---|
| About | The data model, the source and its connector, how many tables and rows were exported, and when. Below that, a contents list of every table with its row and column counts and any note. Each exported table's name links to its sheet. |
| Relationships | Every link between the source's tables: those the source declares, those Reportworq infers, and any you defined on the data model. |
| One sheet per table | A header row and the table's rows, with the header row frozen. Sheets follow the order of the table list. |
The file is named after the source, for example Timberline ERP.xlsx.
When a table is too big for a sheet#
A table is never refused for being large. It is cut to fit, and its row on the About sheet and in the dialog says what was cut:
- Rows. A sheet holds 1,048,575 rows of data, so a longer table keeps its first 1,048,575.
- Columns. A sheet holds 16,384 columns; the last columns beyond that are left out.
- Text length. A cell holds 32,767 characters; a longer value is cut to that length.
- Workbook size. The whole workbook is held to 10,000,000 cells. The export tracks the cells it has used as it goes, so a table that could not be counted, which may be much larger than it looks, is cut once the budget runs out, and any table after it is left out and listed as such.
A table that cannot be read, for example because of a permission, does not stop the export. It is listed on the About sheet with the reason.
Large workbooks open slowly. A Long export, in the millions of cells, can take a minute or more to build and is slow to open in Excel. For one table, download it from the Tables tab instead.
Curate the fields#
The Fields tab is where a raw source becomes a governed model. Each field shows a green mapped chip or an amber unmapped chip, recomputed automatically as you edit.
- Unmapped fields are excluded until you remap them. A field that is unmapped, whether you added it without a mapping or it lost its mapping after a source change, is left out of the model, the preview, and every report until you point it back at a source column. Unmapped does not mean "author fills it in later", there is no calculated or literal field type; unmapped simply means excluded.
- Field names must be unique within a view. A duplicate display name is rejected and the edit reverts.
- The Fields list is not paged. Field order is set by dragging rows, and a drag cannot cross a page boundary, so every field is listed on one scrolling list however many there are. Other long lists in Reportworq page at 100 rows, this one deliberately does not.
- Hidden fields stay queryable. Hiding a field removes it from the report author's field list but keeps it usable as a filter reference, so you can filter on a key column without exposing it. Use Hide all or Show all to toggle visibility in bulk.
- Rename many fields at once. The Rename menu offers Tidy names, which turns source names such as
Account_FullyQualifiedNameintoAccount Fully Qualified NameandTransaction_Type_IdintoTransaction Type ID, and Edit names as text, which lists every name one per line in field order so you can edit them in place or paste them back from a spreadsheet. Line 1 renames the first field, line 2 the second, and so on, so Apply names stays unavailable until there is exactly one non-empty, unique name per field. Both change display names only; reports bind to field ids and keep working, and Discard undoes a rename you do not want. - Filter on a variable. A field filter's value can be a
{{variable}}, so a report decides the value at run time. Reportworq writes the value into the source's query by the field's type, so it needs no quotes. To set its default and prompt, see Data model variables.
Where filters run#
A model's field filters run in the source's own query wherever the source supports it, so the database returns only matching rows and less data crosses the wire. There is nothing to switch on; large sources and selective filters are fast by default.
Sources that cannot express a filter in their own query language, such as Planning Analytics, the planning-tool APIs and other non-relational connectors, filter the rows in memory after retrieving them. You get the same result either way.
Text comparison can differ slightly. Because the database does the filtering, a text filter follows the database's own rules for comparing text (its collation), for example whether
mainematchesMaine. If a filter returns different rows than you expect, check how the source compares text.
Direct queries: modeled view or direct query#
Direct queries is a checkbox on the Sources tab, labeled "Report authors can query this data model's sources directly", and it defaults off. It applies to the whole model, not to one source. Leaving it off keeps the model view-only: authors consume the curated, Public views. Turning it on lets a report author query the model's sources directly and bind to the query result's own columns, skipping the model's curated fields entirely. In the Excel add-in, the author gets one New query per source.
When to use each:
- Use a Public view for governed, reusable, change-resilient reporting. The field-mapping abstraction survives source schema changes, and the view is reusable across many reports and forms.
- Use a direct query for a one-off, well-understood, or exploratory pull, for example running a known SQL extract or inspecting a source before deciding whether to invest in a curated view. Direct-query results do not carry the field-mapping abstraction, so they do not survive source changes and are not centrally reusable.
Choose who sees a view: Public, Hidden or Disabled#
Each view has a visibility, set in the view's header with the Public, Hidden and Disabled buttons. Hover a button for a short reminder of what it does. Each view has its own setting, so one model can hold a mix.
| Visibility | Listed in the Excel add-in and web report pickers | Other views of the model can join it | Runs |
|---|---|---|---|
| Public | Yes, for everyone | Yes | Yes |
| Hidden | No, for anyone, authors included | Yes | Yes |
| Disabled | No | No | No. You can still edit it and run Preview in the data model editor |
- A new view starts Hidden. Build and preview it, then set it to Public when report authors should find it in the Excel add-in or the web report studio.
- Use Hidden for a building block. A view that only feeds a joined view (a lookup, a mapping table) can stay Hidden: a Public joined view reads a Hidden view like any other, and nobody picks it by mistake.
- Hiding a view changes the picker, not existing reports. A report or job already bound to a view keeps running after you set it to Hidden, so you can take a view out of the add-in without breaking anything.
- Use Disabled to stop a view from running. A report, job, joined view or variable choice list that uses a Disabled view fails with a message that names it, for example "“CRM Accounts” is disabled". It never runs without the view's columns.
- Disabling a view that something uses asks first. When joined views or relationships in the model use the view, Reportworq lists them (the same list as Used by in the view's header) and asks before it disables the view. You can still go ahead.
Hidden is not a permission. Hiding a view only leaves it out of the pickers in the Excel add-in and the web report studio. Anyone who can see the data model, through its folder permissions, can still run a Hidden view, readers included. For example, a web report shared with readers shows them the rows of the Hidden view it is built on. To keep data private, use folder permissions on the data model, or set the view to Disabled.
Upgrading from an earlier version. Views that were Published are now Public, and views that were Draft are now Hidden. Nothing that ran before stops running. Two things change:
- Authors no longer see draft (now Hidden) views in the Excel add-in. The rule is the same for everybody.
- Readers can now run views that were Draft. Before, a reader-only user could not run a report built on a draft view. Now a reader with access to the data model's folder can, for example through a shared web report. Before you upgrade, check that any draft view holding data readers should not see is protected by folder permissions, or set it to Disabled after the upgrade.
Other changes in this release. Keep on a relationship between views now belongs to each joined view, so changing it no longer changes other joined views; existing joined views keep the rows they kept. A key whose field is typed Date now matches as a date even when the source stores it as text, so a joined view can find more matches than before. Hierarchies are stored in the data model and can be built from a view's levels. See Join views across sources and Build hierarchies.
Rolling back. An earlier version does not know Disabled: it treats a Disabled view like a draft one, and runs it. Do not roll back past this version while views are Disabled, or first set those views to Hidden and expect them to run.
Limits#
Know these before you rely on a data model:
- A source is checked only for being there. When the model opens, Reportworq checks that each connection is still in Integrations and enabled, and that each workspace file is still in the workspace. It does not sign in to the source or test that it can be reached, so a wrong password or an unreachable server shows only when a view runs.
- SQL Server, OLE DB and ODBC sources supply no table relationships. Add the links you need as manual relationships. See Table relationships.
- Hidden is not a permission. Anyone who can see the data model can run a Hidden view. Use folder permissions, or Disabled. See Choose who sees a view.
- Older versions of Reportworq get some new settings wrong. An older version runs a Disabled view, runs Only in left and Only in right joins as Matches only, and drops a Levels hierarchy if it saves the model. Upgrade every server that shares a data model, and don't roll back while you use them.
- Planning Analytics, Analysis Services, Adaptive and Pigment are read as tables. A view of a cube is flattened into rows and columns; a data model has no cube model of its own.
- Joined views run in the server's memory, within limits an administrator sets, and a Pigment or Planning Analytics input is always read in full. See Join views across sources.
- Relationships between views are found from a joined view. To see, edit or delete one, open a joined view that uses it.
- Hierarchies work in web reports and Explore, in crosstabs. They are not used by the Excel add-in's own reports, and a joined view can't carry one.
- Checks read samples. Test match, Discover relationship, Explain and Preview tree read the first rows of each view, not all of them.
- The AI assistant reads your data. It reads two sample rows from up to 40 tables of every source, a disabled connection included, and sends them to your AI provider. If an administrator has changed the assistant's instructions in Settings > AI Prompts, they keep that text: select Reset to default there to get the newest guidance, such as how to suggest hierarchies.
- Variable values in Adaptive names are not checked. A
{{variable}}in an Adaptive Planning sheet, version, level or dimension name is filled in as given. Give such a variable a list of Choices with typing turned off. - No calculated fields. A field must map to a source column; an unmapped field is left out until you remap it.
Notes#
- The Preview tab runs the view fresh each time, with no cache. Report display and formatting (grouping, aggregates, sort priority, format modes) are authored in the report builder, in the Excel add-in or the web report studio, not in the model editor.
- To work on a model, open it with Edit from its row in the workspace. Someone without edit rights can open its Properties.
Going deeper. To build a view on a SQL datasource, see Build a view with the designer and Table relationships. To combine views of different sources, see Join views across sources. For defaults, prompts, and how values are filled into a query, see Data model variables. For the limits of data models, see Limits. For the field labels and query types of a specific source, see Connect IBM Planning Analytics, Connect SQL Server, OLE DB, and ODBC, and the Connector catalog. To bind a model to an Excel workbook or SQLite database in this workspace with no Integrations connection, see Build a data model from a workspace file.
Feedback on this page
Comments, questions, requests, or something missing or unclear? Email us - the page you are on is filled in for you.
Email feedback on this pageOr write to support@reportworq.com directly.