
List reports#
Early release. This feature is in early release, so its screens and behavior may change. Tell us what you think with Send feedback. See Early release features and Send feedback.
A list report is rows from one view of a data model. You choose the fields that become columns, decide how to sort and group them, add totals, and filter what is shown. The list draws into the cells where you place it and stays connected to the view, so it refreshes with current data.
When to use it. You want the detail behind a number, not a summary. For example, every invoice line from the Sales Details view of the Timberline Sales Journals data model for one region, sorted by net amount, with a total at the bottom. If you want numbers grouped by two or more fields, build a crosstab instead.
You build a list the same way in Excel and in the web report studio, because both host the same Reportworq pane. The only differences are where you click to start and how much room the sheet has. See The Excel add-in and the studio.
Before you start#
- You are signed in as an author or a system administrator.
- A data model with a Public view you can see. A list reads a view of a data model. It does not read a cube. A Hidden view is not listed in the pane and a Disabled view never runs. See View visibility.
- In Excel, a version of Excel that supports the Reportworq pane. In the studio, a web report open in Editing mode. See The web report studio.
Start a list#
Click the cell where the list's top-left corner should go.
Start the list:
- In Excel: on the Reportworq tab, in the New report group, select List. Or open the pane and, on Home, pick a view from the model list, or select List under Or start from a report type.
- In the studio: on the Reportworq tab, in the New group, select List report. The Insert tab has the same button.
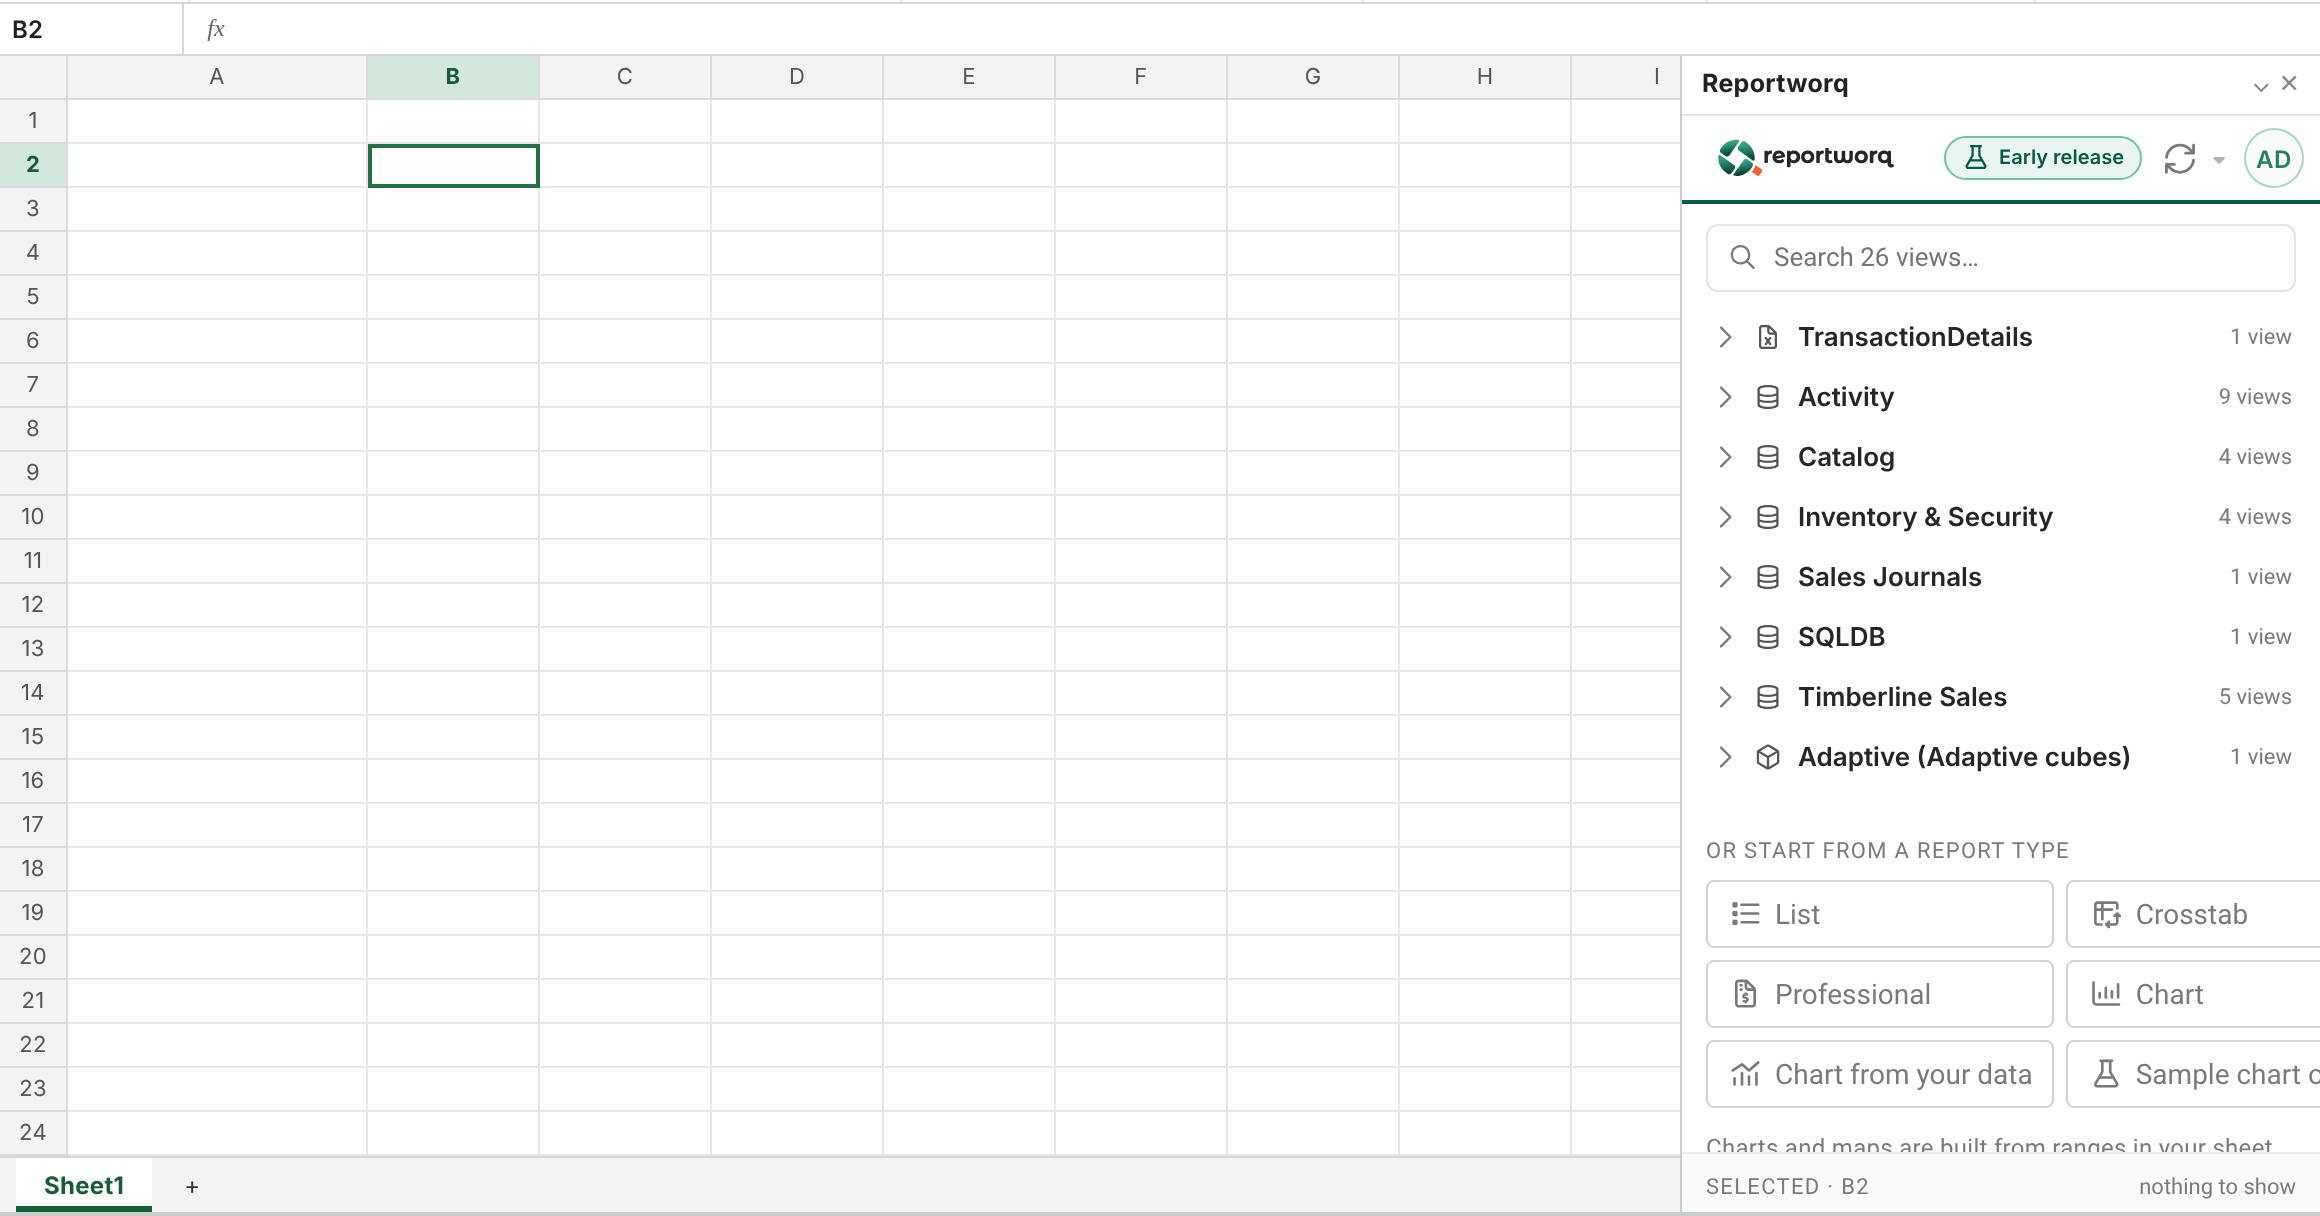
The Reportworq pane Home page in Excel with the model list and the report types to start fromTap or click the image to view it full screen On Home, each view in the model tree also has quick buttons that start a list or a crosstab already connected to that view. Double-click a view, or press Enter on it, to start a list from it.
The new list opens on its Connection page. If you started from a view, it skips ahead to the field picker. If your selection was on a report or picture already, the list goes two rows below the lowest report on the sheet instead, so it never covers another report.
Choose the view#
- On the Connection page, find the view. Models are rows you open and close; each shows its number of views, and each view its number of fields. Type in the box ("Search 24 views...") to narrow the list.
- Select a view. Its details appear below the tree: Type (View, Joined view or Cube), Data source(s) and About.
- Select Done, or double-click the view, to connect.
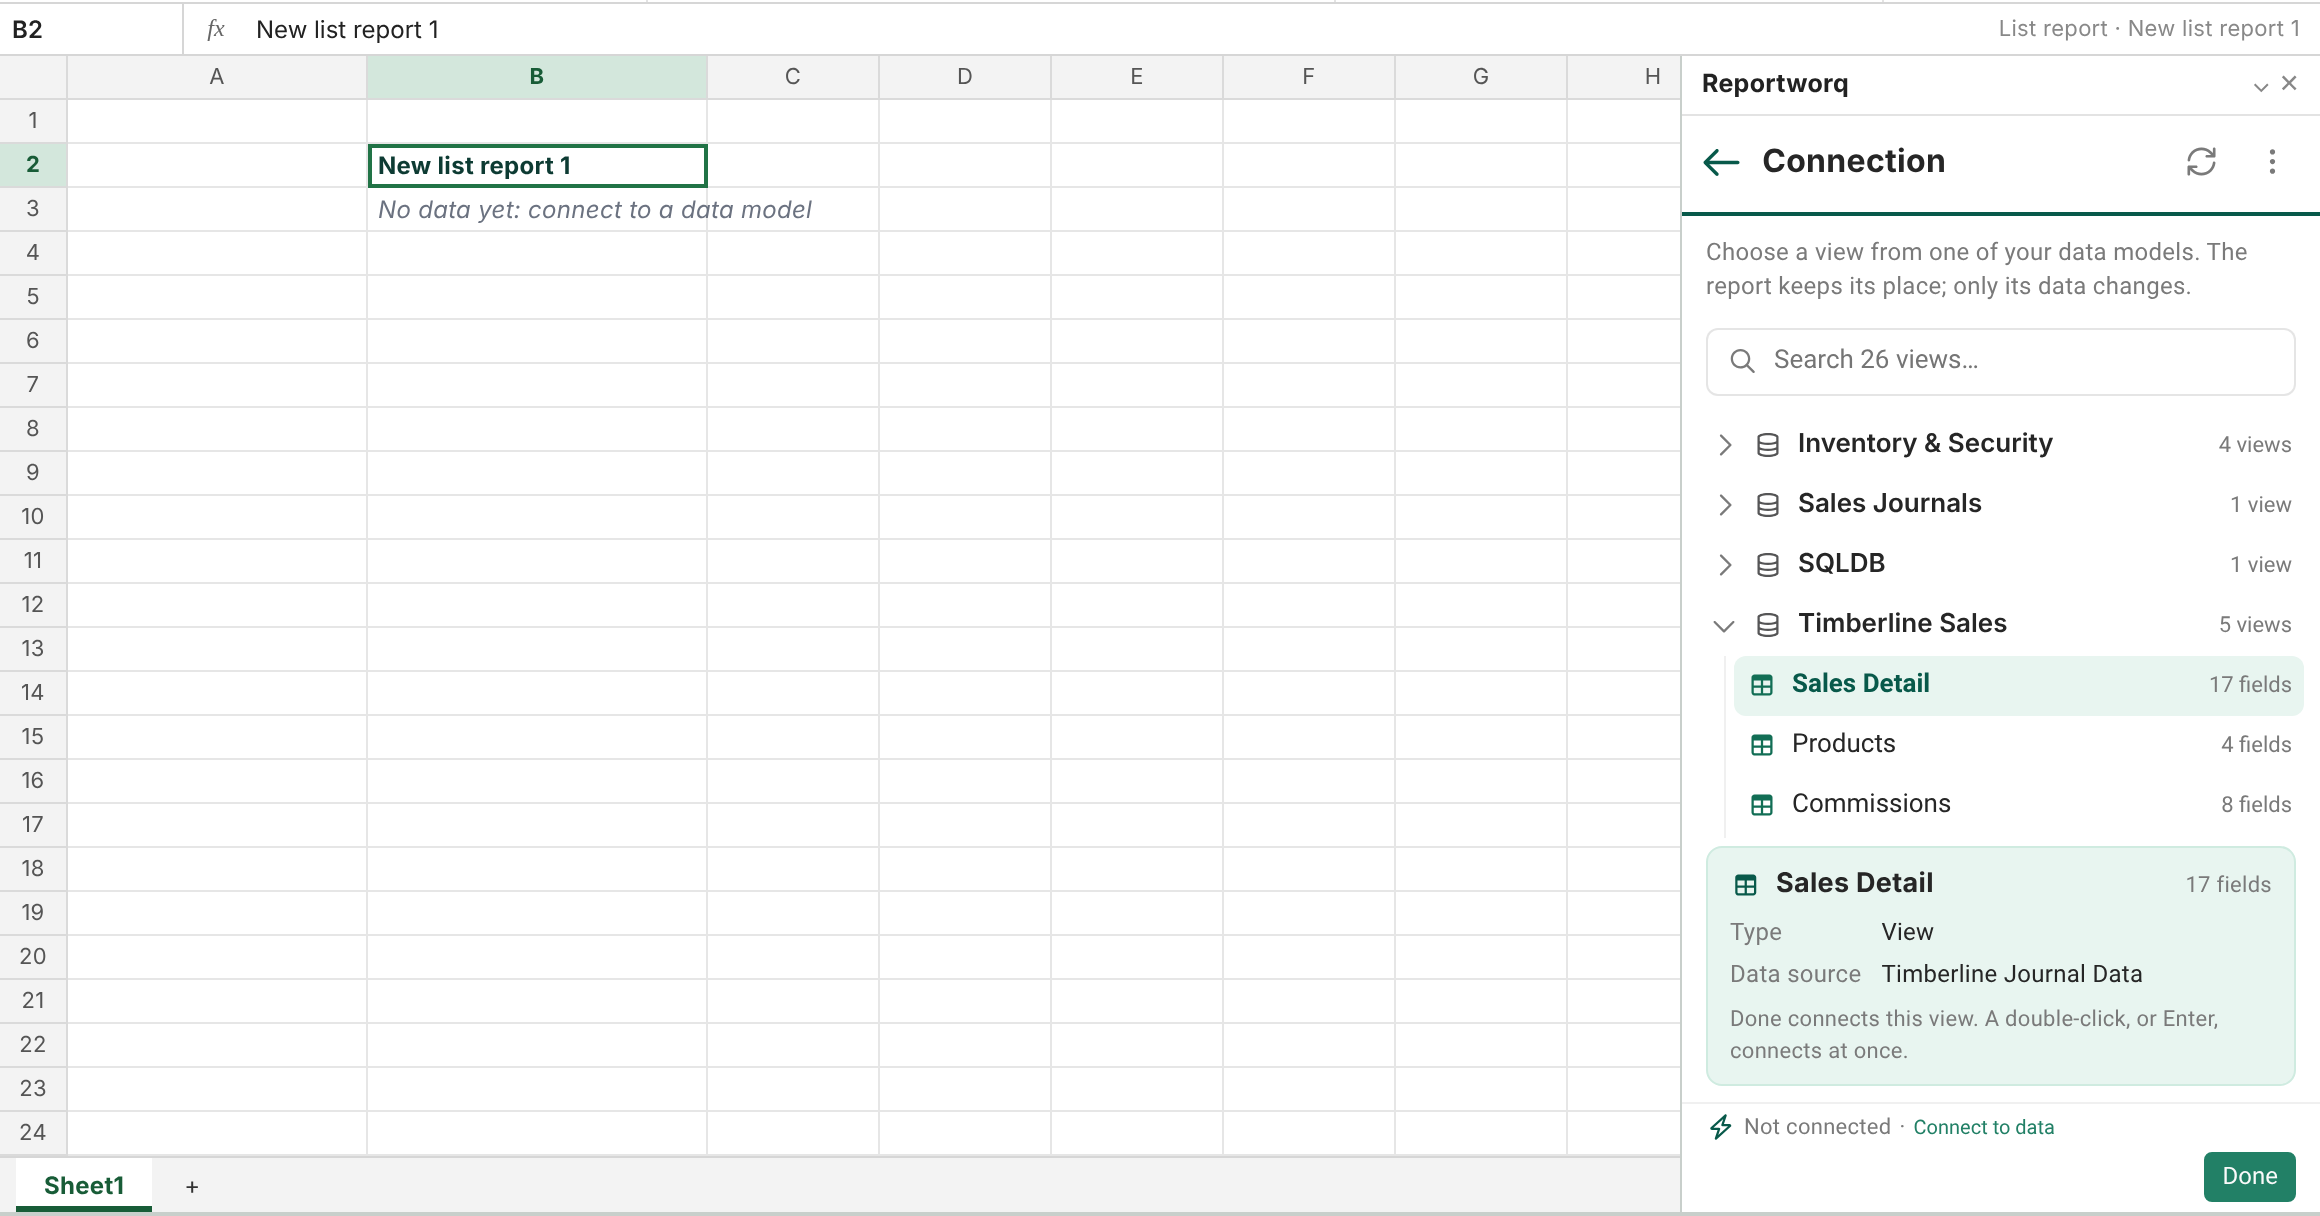
Selecting a view does not connect it; Done does. Back leaves the list unchanged. To change the view later, open the same page from the list's menu or the Connection button on the List tab. Fields the new view also has are kept.
Pick the fields#
- On the list's main page, select Pick fields. You can also select the + beside Columns or Sections.
- Tick the fields you want. The list draws as you tick. Type in the box ("Search 30 fields...") to find a field. Select all and Select none act on the fields the search shows.
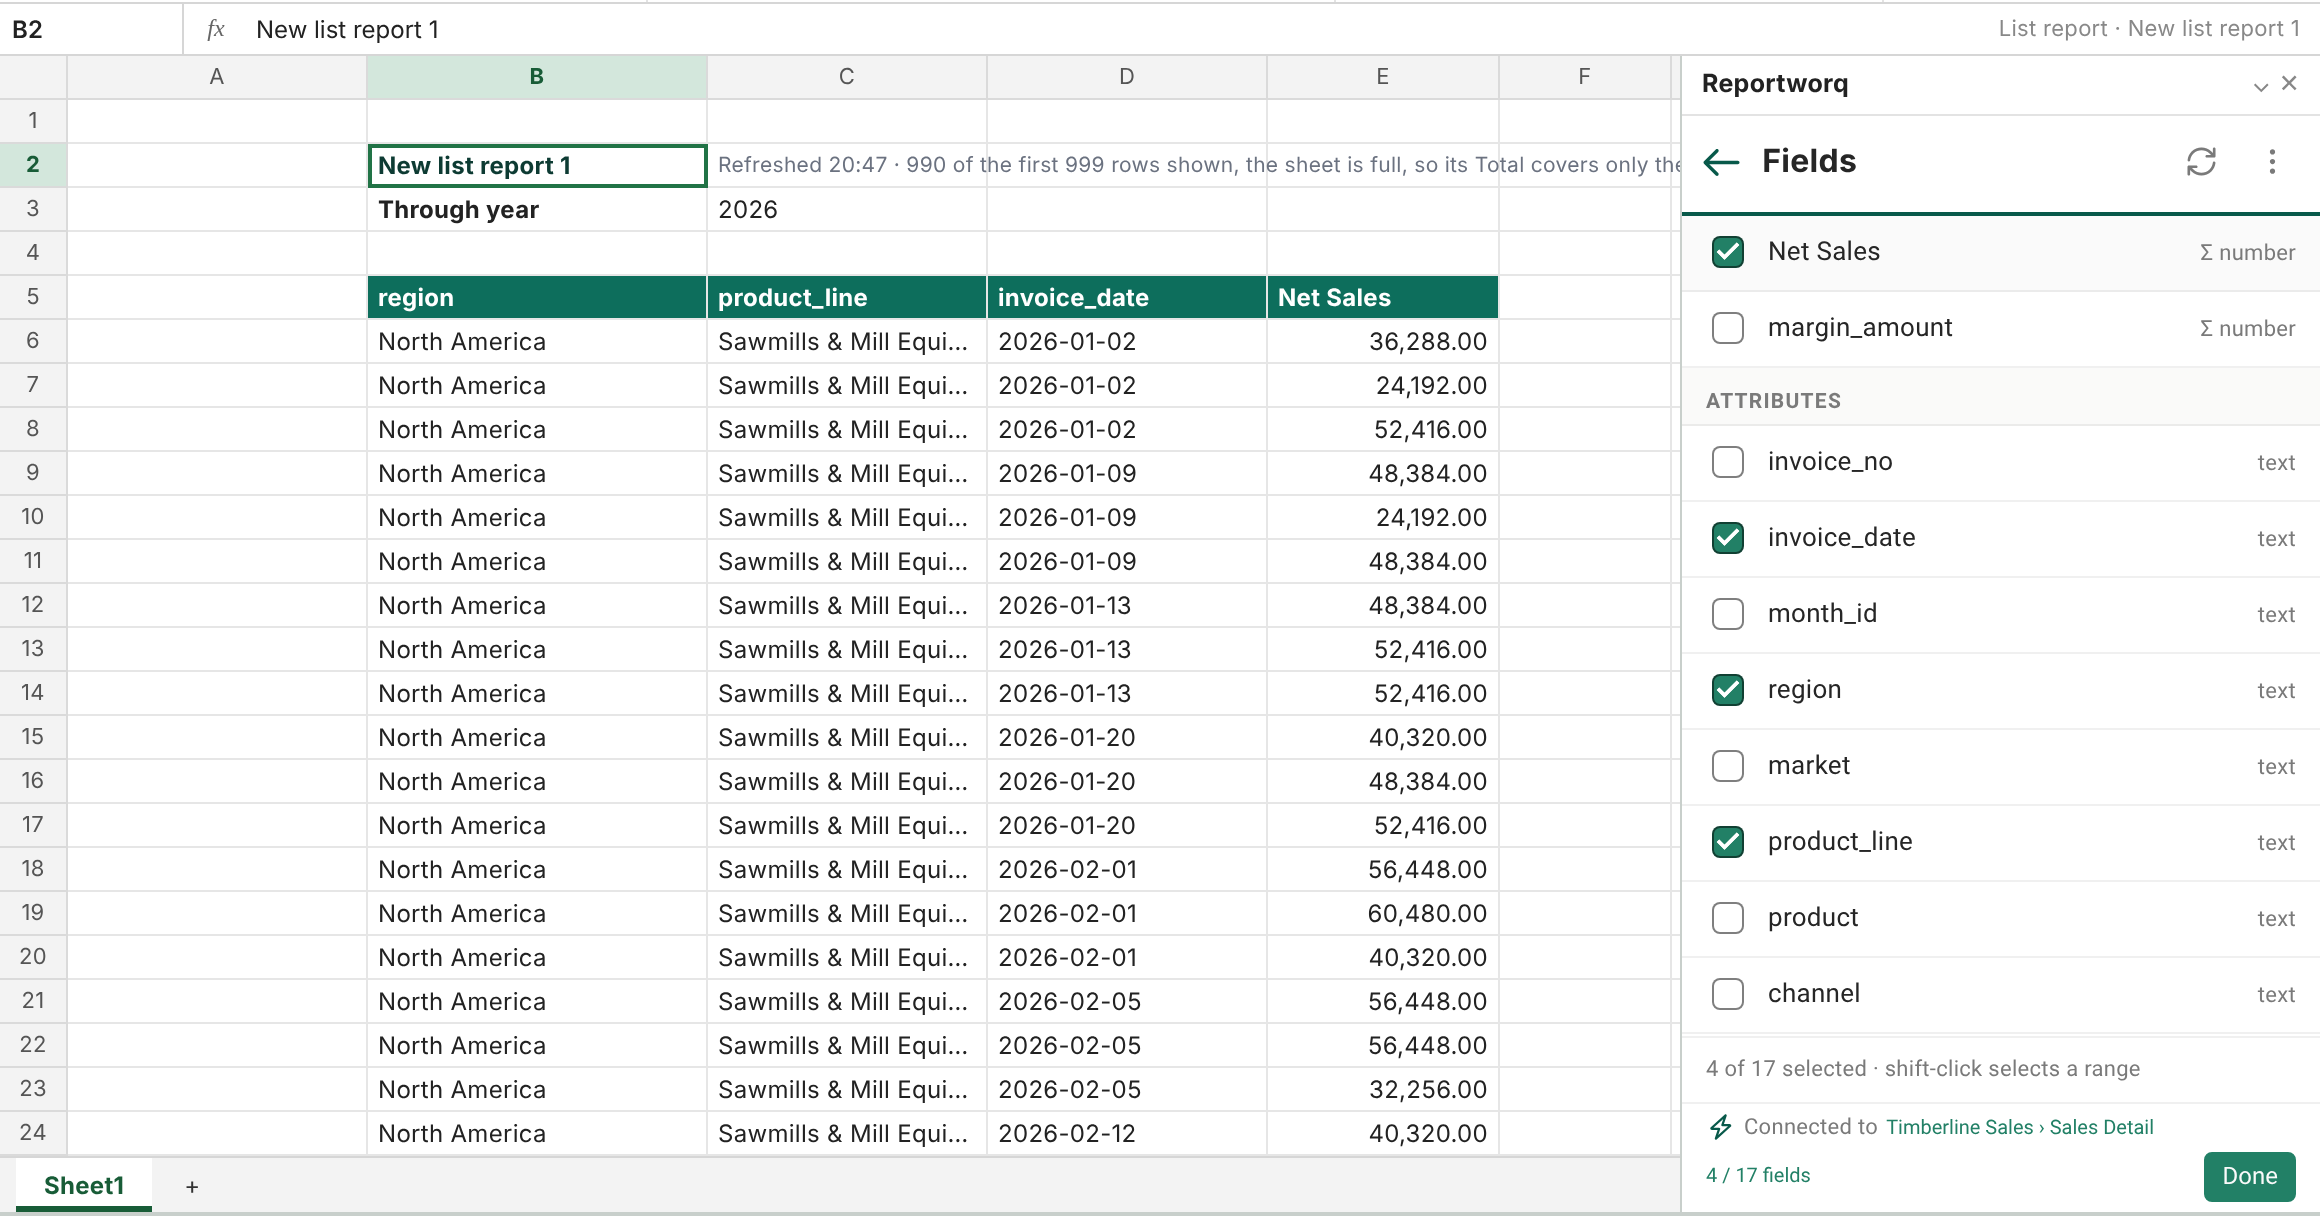
Select none leaves a field in place if it is hidden and only used for a filter or a Top N, so one click never removes a filter by accident.
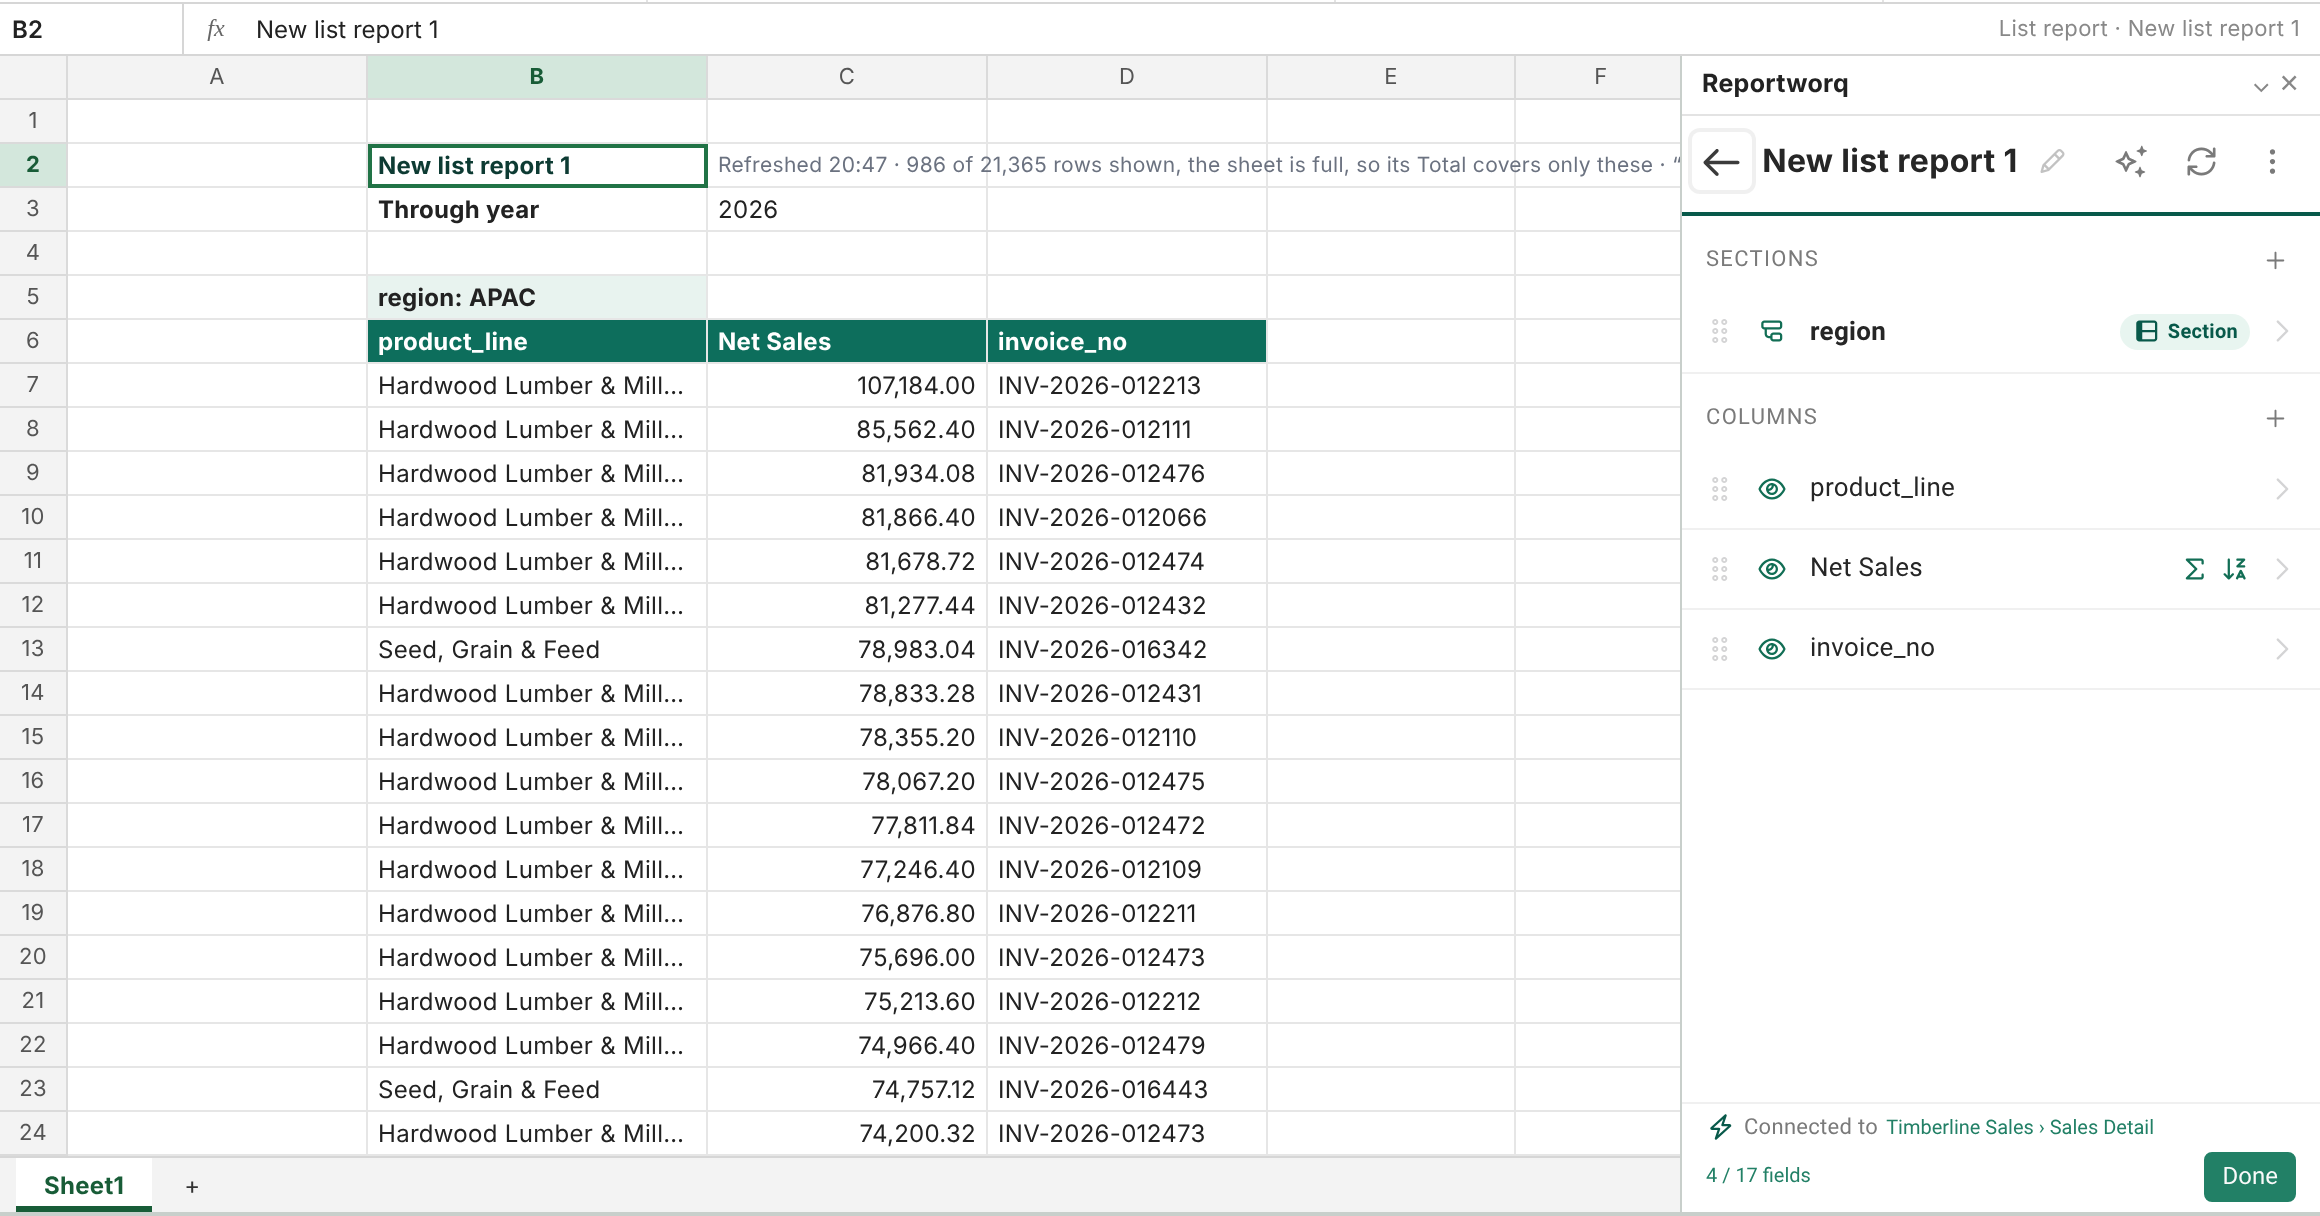
Back on the main page, the list has up to three areas: Filters (shown when a field has a filter), Sections and Columns.
- Drag a row by its grip to move it. Hold Ctrl (or Cmd) and click, or Shift and click, to select several rows, then drag them together. Drop a field on the Sections heading to make it a section, or on Columns to make it a column.
- The eye on a column hides it from the output but keeps it available for sorting and filtering. Its tooltip reads "Hide (keep for sorting)".
- Click a field's name to open its page.
Set up a field#
A field's page has three parts: Header, Data and Filter.
Header
- Column, Section or Group. A Section starts a new section for each value, with its own column headers. A Group puts rows under a heading for each value inside a section. A plain Column is the default.
- Subtotals, for a section or group: adds a subtotal row for the measures that have a total.
- Don't repeat value, for a text column: shows a repeated value only once, down the column.
Data
- Sort: None, A→Z or Z→A. With more than one sorting column, the order you chose them in decides which sorts first, and the page shows "(sort 1)", "(sort 2)". Dragging a column does not change the sort order.
- Total, for a number field: None, Sum, Avg or Count.
- Transform, for a text field: None, Upper, Lower or Trim.
- Shown in report: clear it to hide the field and still use it.
Filter: see the next section.
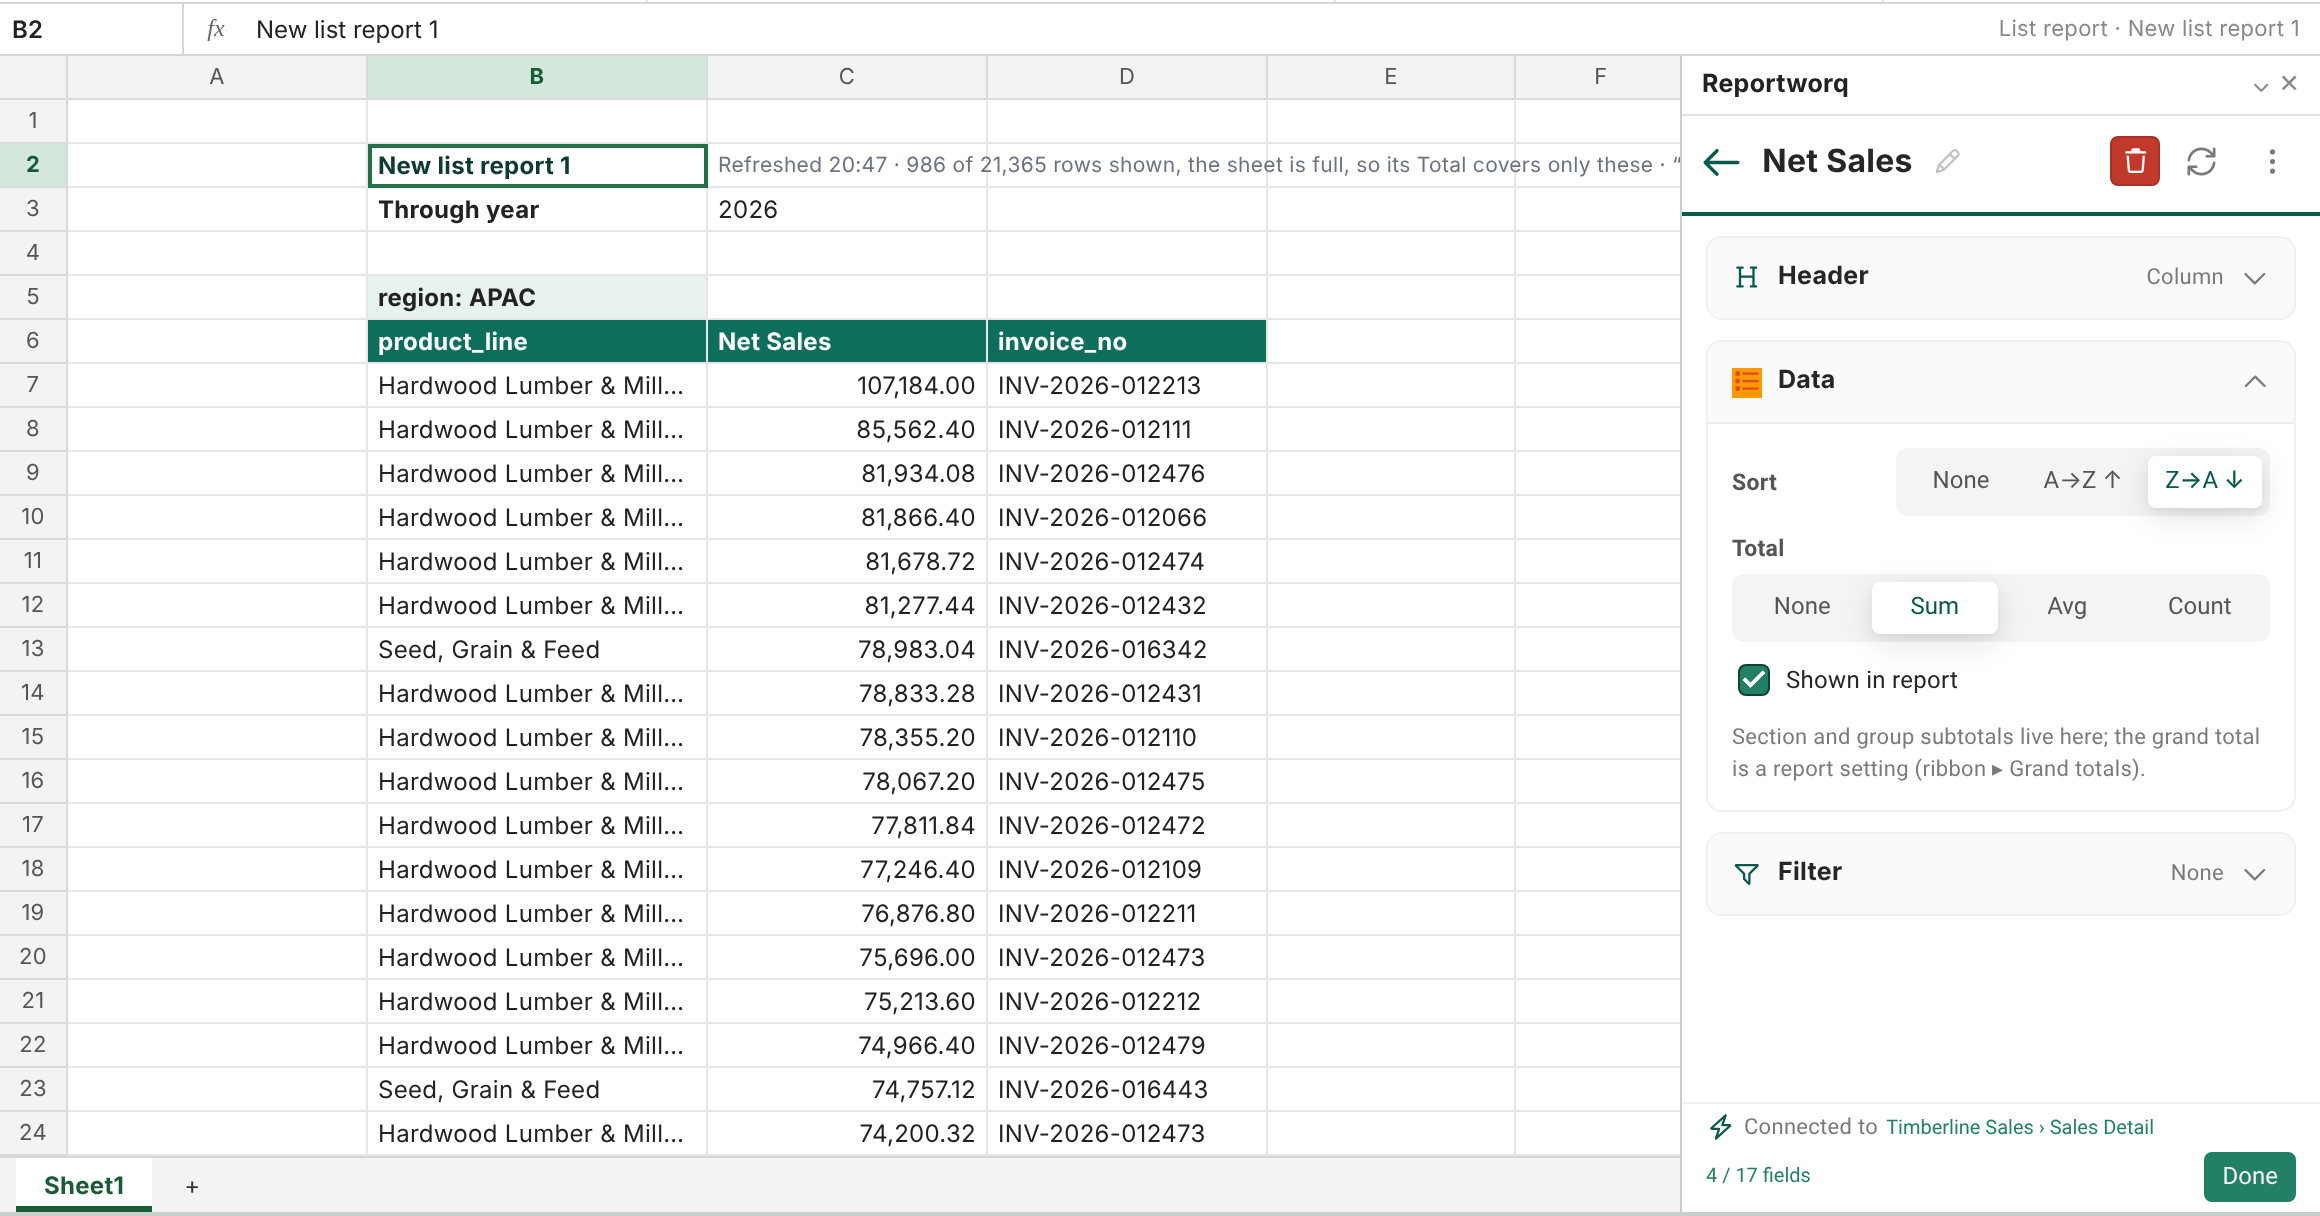
Sections and groups sort by their field's own sort: high to low when it is Z→A, low to high when it is A→Z or has none. Numbers compare as numbers, dates as dates, then text.
Filter a list#
Open a field and expand Filter. Pick one of up to three ways to filter:
| Mode | For | What you do |
|---|---|---|
| Select values | Any field | Tick the values to keep. Type in Search values to find one. Select all and Clear change every box. |
| Label | Fields that are not numbers | Show items whose label equals, does not equal, begins with, does not begin with, ends with, does not end with, contains, does not contain, is greater than, is less than, is between, or is not between a value. |
| Value | Number fields | Show items whose value is =, not equal, >, >=, <, <=, between, not between, top N or bottom N. |
The checklist lists at most 200 values at a time with a search over all of them, and says "Showing 200 of N values. Search to find the rest." If you untick a value from an all-ticked list, Reportworq stores it as left out, so a value that appears later still shows. After you choose Clear, ticking keeps only the values you tick.
Top N and bottom N keep the highest or lowest N rows for a number field, within each section if the list has sections. A row with no value for that field is never ranked. Ties keep the row the list sorts first, so exactly N rows are kept. You can have both a comparison and a Top N on one field. The list shows "Top 5 by net_amount, in each section" under Filters, with a button to clear it.
Text matches ignore case and leading and trailing spaces: "Low", "low" and "low " are one value. A text field whose values are all numbers or all dates tells you on its page and where to change its type, in the data model's field settings.
Each filter shows as a line above the list on the sheet and as a badge on the field.
Filters that apply to the whole list#
The list's Report filters page applies before anything else. Open it from the Report filters button on the List tab or the list's menu.
- Select Add report filter.
- Under Field, pick the field. Changing the field clears the value.
- Under Equals, pick a value, or under Or variable pick a variable that reads its value from a cell.
To use a cell as the value, open the Variables page, select Add variable, give it a Name, select the cell on the sheet, and select the Use button (it shows the cell address). Change the cell and refresh the list. For more on cell-driven values, see Cell-driven variables.
A view can also define its own variables, which appear on the list. See Data model variables.
Add totals#
- On the field's page, under Data, set Total to Sum, Avg or Count.
- For a section or group subtotal, set Subtotals under Header.
- For a total at the bottom of the whole list, open the Totals page (the Grand totals button on the List tab) and tick Grand total row. A total needs at least one value field with a Total set.
A Count total shows as a whole number. A cell with no value is left out of sums, averages and counts; it is not treated as zero. If a list has no rows, the total row shows zeros for Sum and Count and blanks for Avg.
Place the list and limit its rows#
Place (Place button on the List tab) sets where the list sits and how it behaves when it grows:
- Location shows the anchor cell. Move to Sheet!Cell moves the list to the cell you have selected.
- When the report grows: Insert rows (default), Insert cells (only the report's columns move) or Overwrite (scratch sheets). The page names any content below or beside the report that would be pushed.
- Import as an Excel table writes the list as an Excel table.
Limit rows (the list's menu or the Limit rows button) cuts the list after sorting and filtering. Choose No limit, 10, 25, 50, 100, 500 or 1,000, or type a whole number in Rows. An empty box means no limit. A list in the pane draws at most the first 10,000 rows when it has no limit of its own; the chip reads "No limit (first 10,000 rows)".
Rows read from the source sets how many rows the list asks the view for. Choose Default (10,000), 1,000, 10,000 or All rows (up to 1,000,000). See the limits below.
Refresh the list#
The list refreshes as you edit. Use the Refresh button in the pane's header, or Refresh on the List tab, to read the view again. Clear data removes the values and keeps the definition. If a list is slow to draw, Reportworq switches Auto-update off for that report and tells you; refresh it by hand after that.
If the list is cut short, a Not every row note appears in the editor, for example "This list read only the first 10,000 rows of its source." Select Load all rows to read up to 1,000,000 rows.
Notes and limits#
| Limit | Value | What happens past it |
|---|---|---|
| Rows read from the source, any list | 1,000,000 | A list that sorts, filters, ranks or has sections or groups is not shown and says why. Nothing is cut. Add a filter in the view or a data model variable, or set Rows read from the source to 1,000,000 or fewer. |
| Rows read, plain list with no limit | The first 10,000 in the pane | The list says it shows the first 10,000 rows. Load all rows reads up to 1,000,000. A job ignores this default. |
| Cells in one list | 2,000,000 by default (an administrator can set 1 to 5,000,000) | Nothing is written. The list's status is Too big for Excel with the cell count and a Limit to N rows button. |
| Ask before writing | Above 100,000 cells (Excel only; an administrator can change it, 0 never asks) | The card reads "Waiting to write" until you choose Write N cells or Cancel. |
| Cells in one workbook | 5,000,000, over all reports in a workbook in Excel | A report that would pass it writes nothing. |
| Sheet size in the studio | 1,000 rows by 52 columns | A list stops at the last row and says "S of M rows shown, the sheet is full, so its Total covers only these." The list's own title, header and hidden format rows share the sheet, so it has room for fewer than 1,000 data rows. |
| Sheet size in Excel | Excel's last cell, XFD1048576 | A list that would pass it draws the rows that fit and keeps its totals. |
| Read time | 120 seconds | The list fails with "The source took too long." Add a filter or a lower row limit. |
| Checklist values | 200 shown | Search finds the rest. |
- A cube has no rows for a list. A list on a cube says "A list reads a data model's views, not a cube, so there are no rows to show. To report on a cube, use a crosstab."
- Order of work. The list reads its rows, applies field filters and then report filters, sorts, applies Top N within each section, applies Limit rows, and finally stops at the end of the sheet. Totals are kept when the sheet cuts the list.
- Distribution jobs. A job that refreshes a workbook with a list has no 10,000-row default, never cuts a list, and fails the sheet with a message if the list is too large. See Excel: the analyst pane.
Going deeper. For a formatted, formula-driven report, see Professional reports. To describe a list in plain language and let Reportworq build it, see AI insights.
Feedback on this page
Comments, questions, requests, or something missing or unclear? Email us - the page you are on is filled in for you.
Email feedback on this pageOr write to support@reportworq.com directly.