
Charts and maps#
Early release. This feature is in early release, so its screens and behavior may change. Tell us what you think with Send feedback. See Early release features and Send feedback.
A chart or map is a report type of its own. You build it from cells on the sheet, or from a list or crosstab you already have, and it is drawn live while you work. When a distribution job delivers the workbook, charts are redrawn as pictures from the data of that run.
When to use it. You have a Financial Reports crosstab of revenue by quarter and want a column chart beside it, or a table of store locations and want bubbles sized by sales on a map.
Where you can build one#
| Web report studio | Excel add-in | |
|---|---|---|
| Charts (13 kinds) and maps (2 kinds) | Yes | Yes, in the analyst pane (the default pane) |
| Legend, data labels and gridline settings | Yes | Yes, in the analyst pane. The older companion pane has no controls for them |
| Map color, size and label by column | Yes | Yes, in the analyst pane only |
| Live chart with tooltips on the sheet | Yes | The chart is placed as a picture on the sheet |
If an administrator turns off Use the analyst pane in Excel, the add-in shows the older companion pane. It has its own New chart builder with the same chart and map types, but it keeps the legend, labels and map styling on their defaults.
Before you start#
- Have the data on the sheet: a table of cells, a list report or a crosstab. A chart does not run a query itself.
- Optional: an enabled AI connection if you want Fill in from (the AI suggests which columns are labels and which are series). Without one, a built-in rule does the same job. See AI insights for what AI features send.
Chart and map kinds#
| Kind | What it draws | Notes |
|---|---|---|
| Column, Bar, Line | One series per value column | Bar puts the value axis along the bottom |
| Stacked column, Stacked bar | Series stacked | Positive and negative values stack apart |
| Pie, Donut | Share of a whole | A donut is a pie with a 50 percent hole |
| Waterfall | A running bridge | Up and down steps are colored differently |
| Combo | Each series is Column, Line or Area | Tick 2nd axis to put a series on a right-hand axis, for example revenue columns and a margin percent line |
| Range bars, Range area | Each category spans a low and a high value | A range chart can label each band with the difference |
| Heatmap | A matrix colored by value | Reads a crosstab block or a long table of row, column, value |
| Sankey | Flows between nodes | Reads a table of source, target, value |
| Map: Points | Markers on a map | Reads a table of label, latitude, longitude |
| Map: Bubbles | Circles sized by a value | Same table plus a value column |
Add a chart#
- Select the cells that hold the data, with a header row if you have one. The first column is used as the labels when it is text or years. A block with no text column is labeled 1, 2, 3 by row.
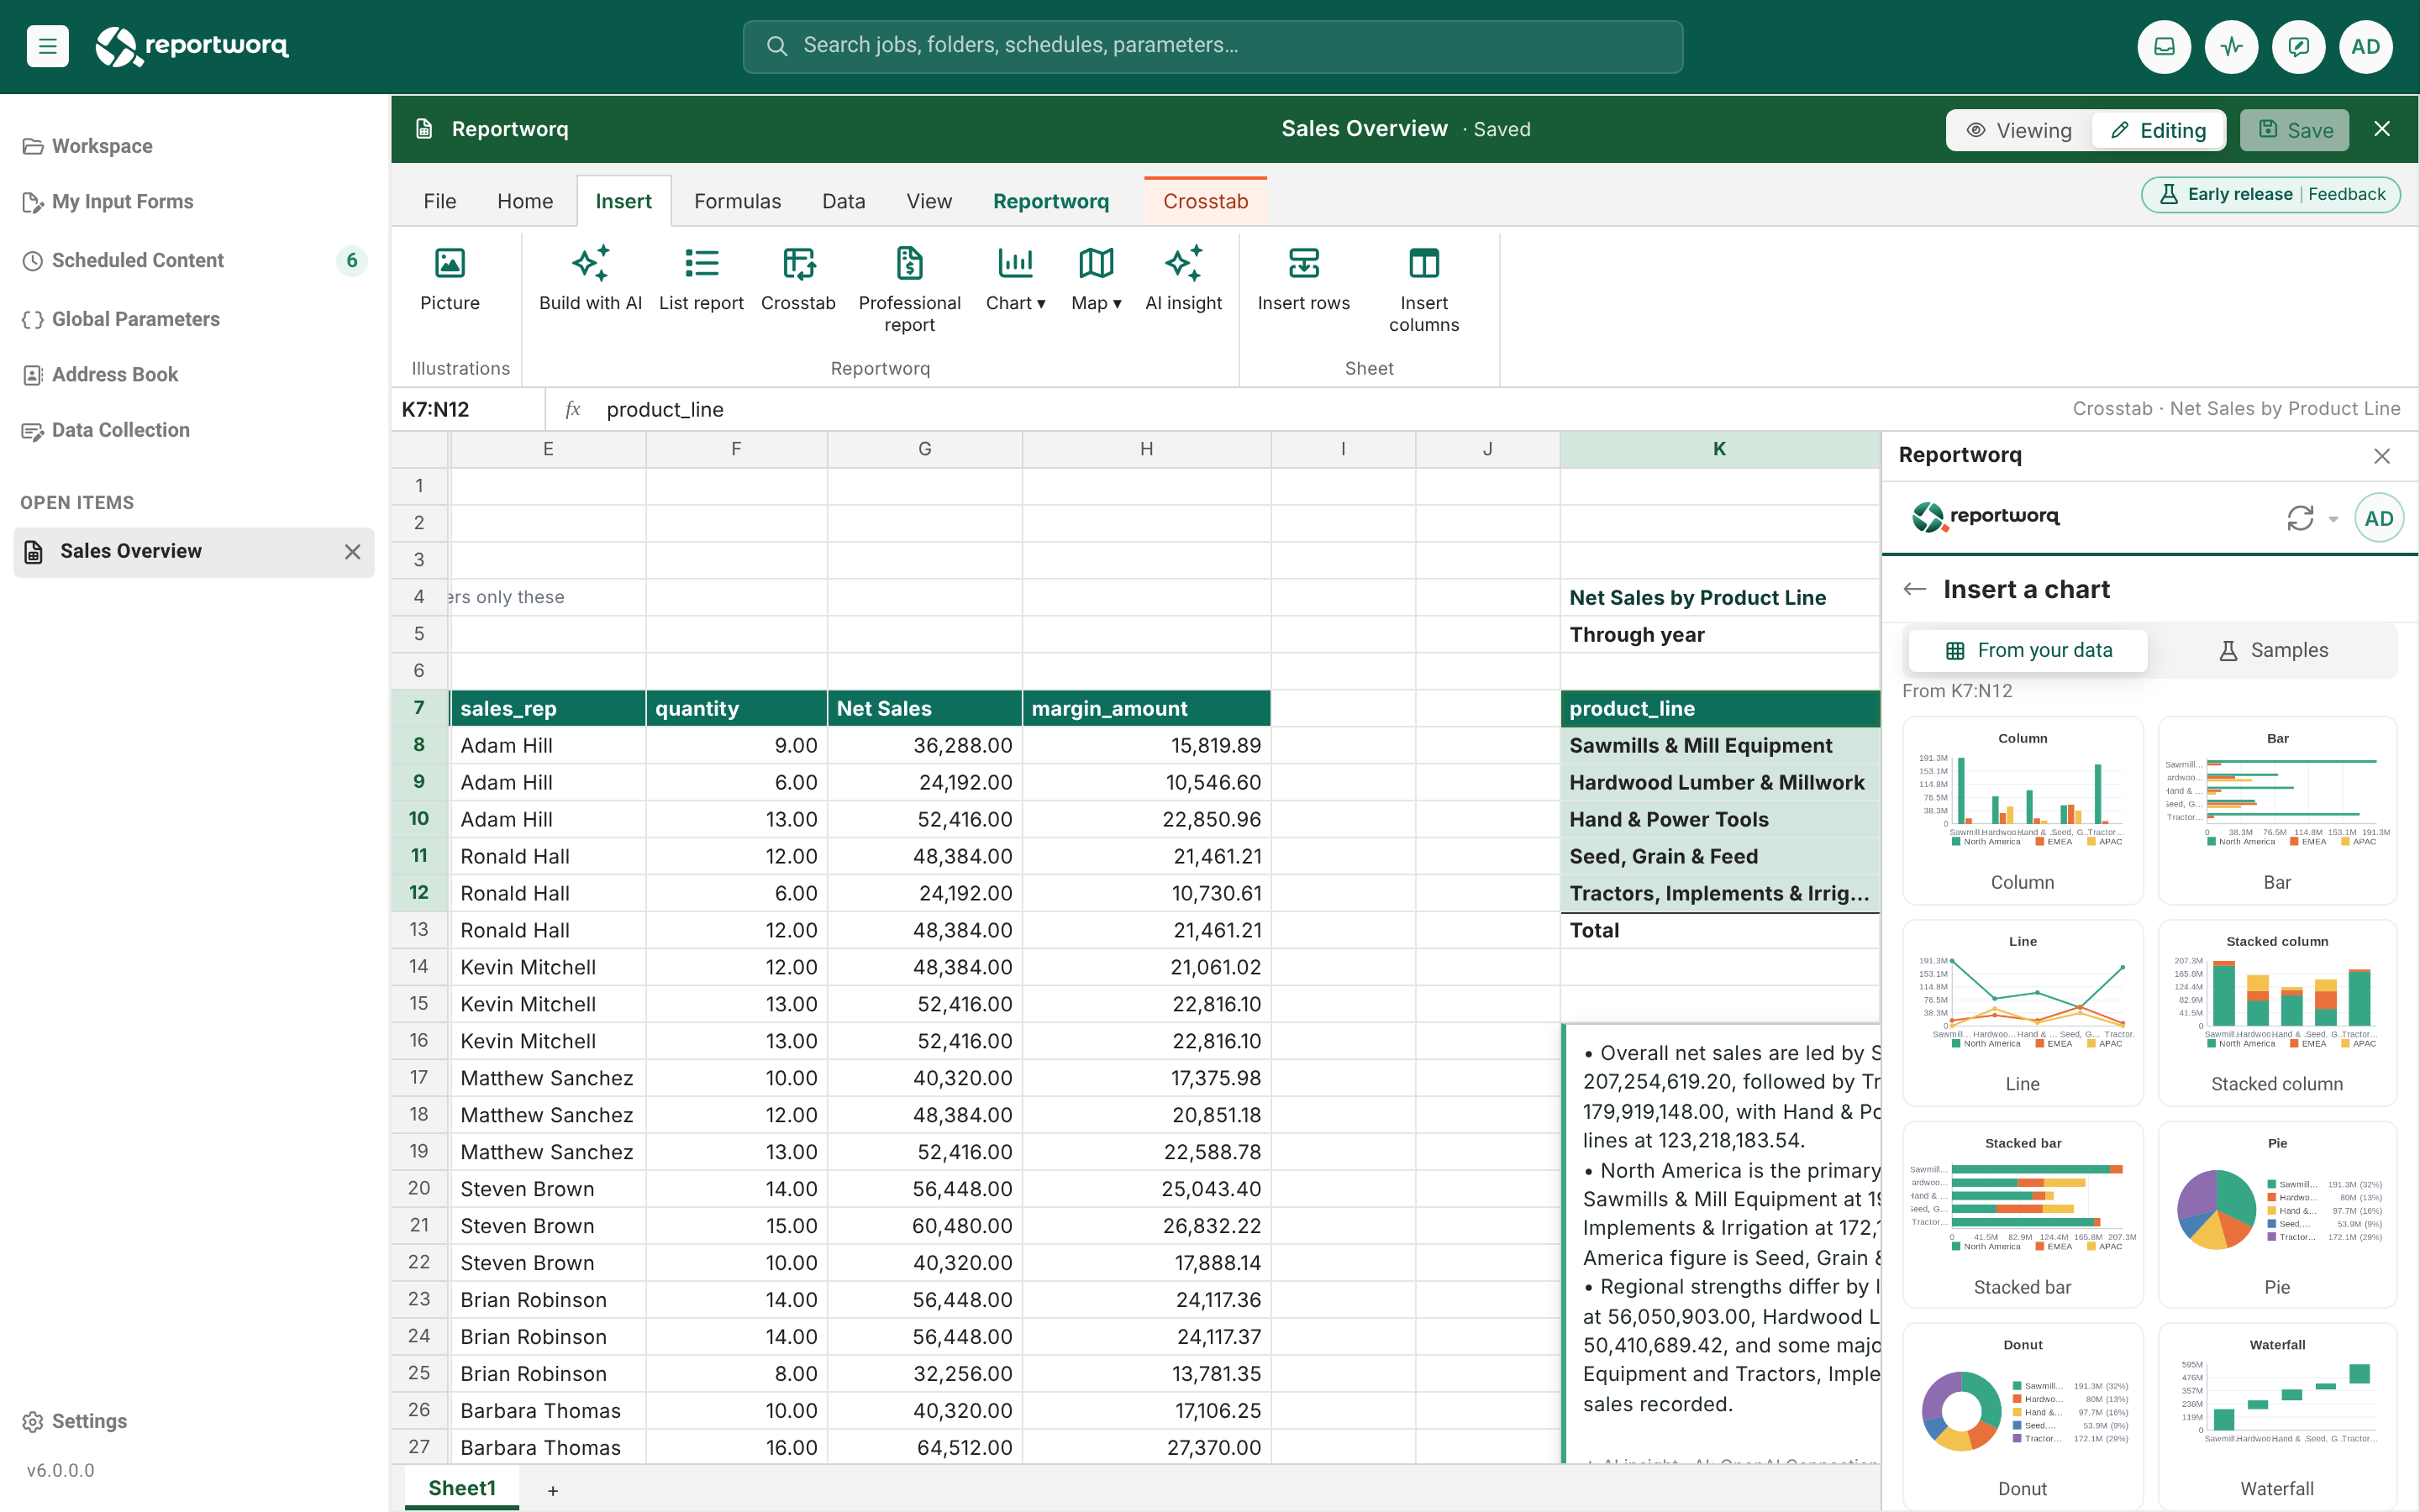
- On the New group of the ribbon (web report studio) or on Home in the pane (Excel), choose Chart, then Chart from your data.
- On the From your data tab, every chart and map kind is previewed with your selection. Pick the one that reads best. The previews use the top-left 30 rows by 7 columns of the selection.
- The chart is placed at 480 by 300 pixels and never on top of another picture. Reportworq looks for room beside your selection; when a report is in the way it can land elsewhere on the sheet, and a message names the cell, for example "Chart placed at Sheet1!A40".
- Open the chart to review its set-up pages: Data, then Legend & labels. A heatmap has Matrix; a Sankey has Flows and Appearance.
To start from an example instead, choose Sample chart or map. The samples write their own data at the active cell and ask "Write sample data?" before overwriting cells.
Set up the data#
On the Data page:
- Category is the range that holds the labels.
- Each series has a name (typed, or taken from a cell) and a values range.
- On a Combo, each series also has a type (Column, Line or Area) and a 2nd axis tick.
- A chart title can be typed or taken from a cell. Use the small menu inside a field to switch between Type a value and From a cell.
On Legend & labels, set the legend (Auto, Off, Bottom, Right or Top), data labels (Auto, Off or Values, plus Percent on a pie) and gridlines (not for a pie).
Keep a chart in step with its report#
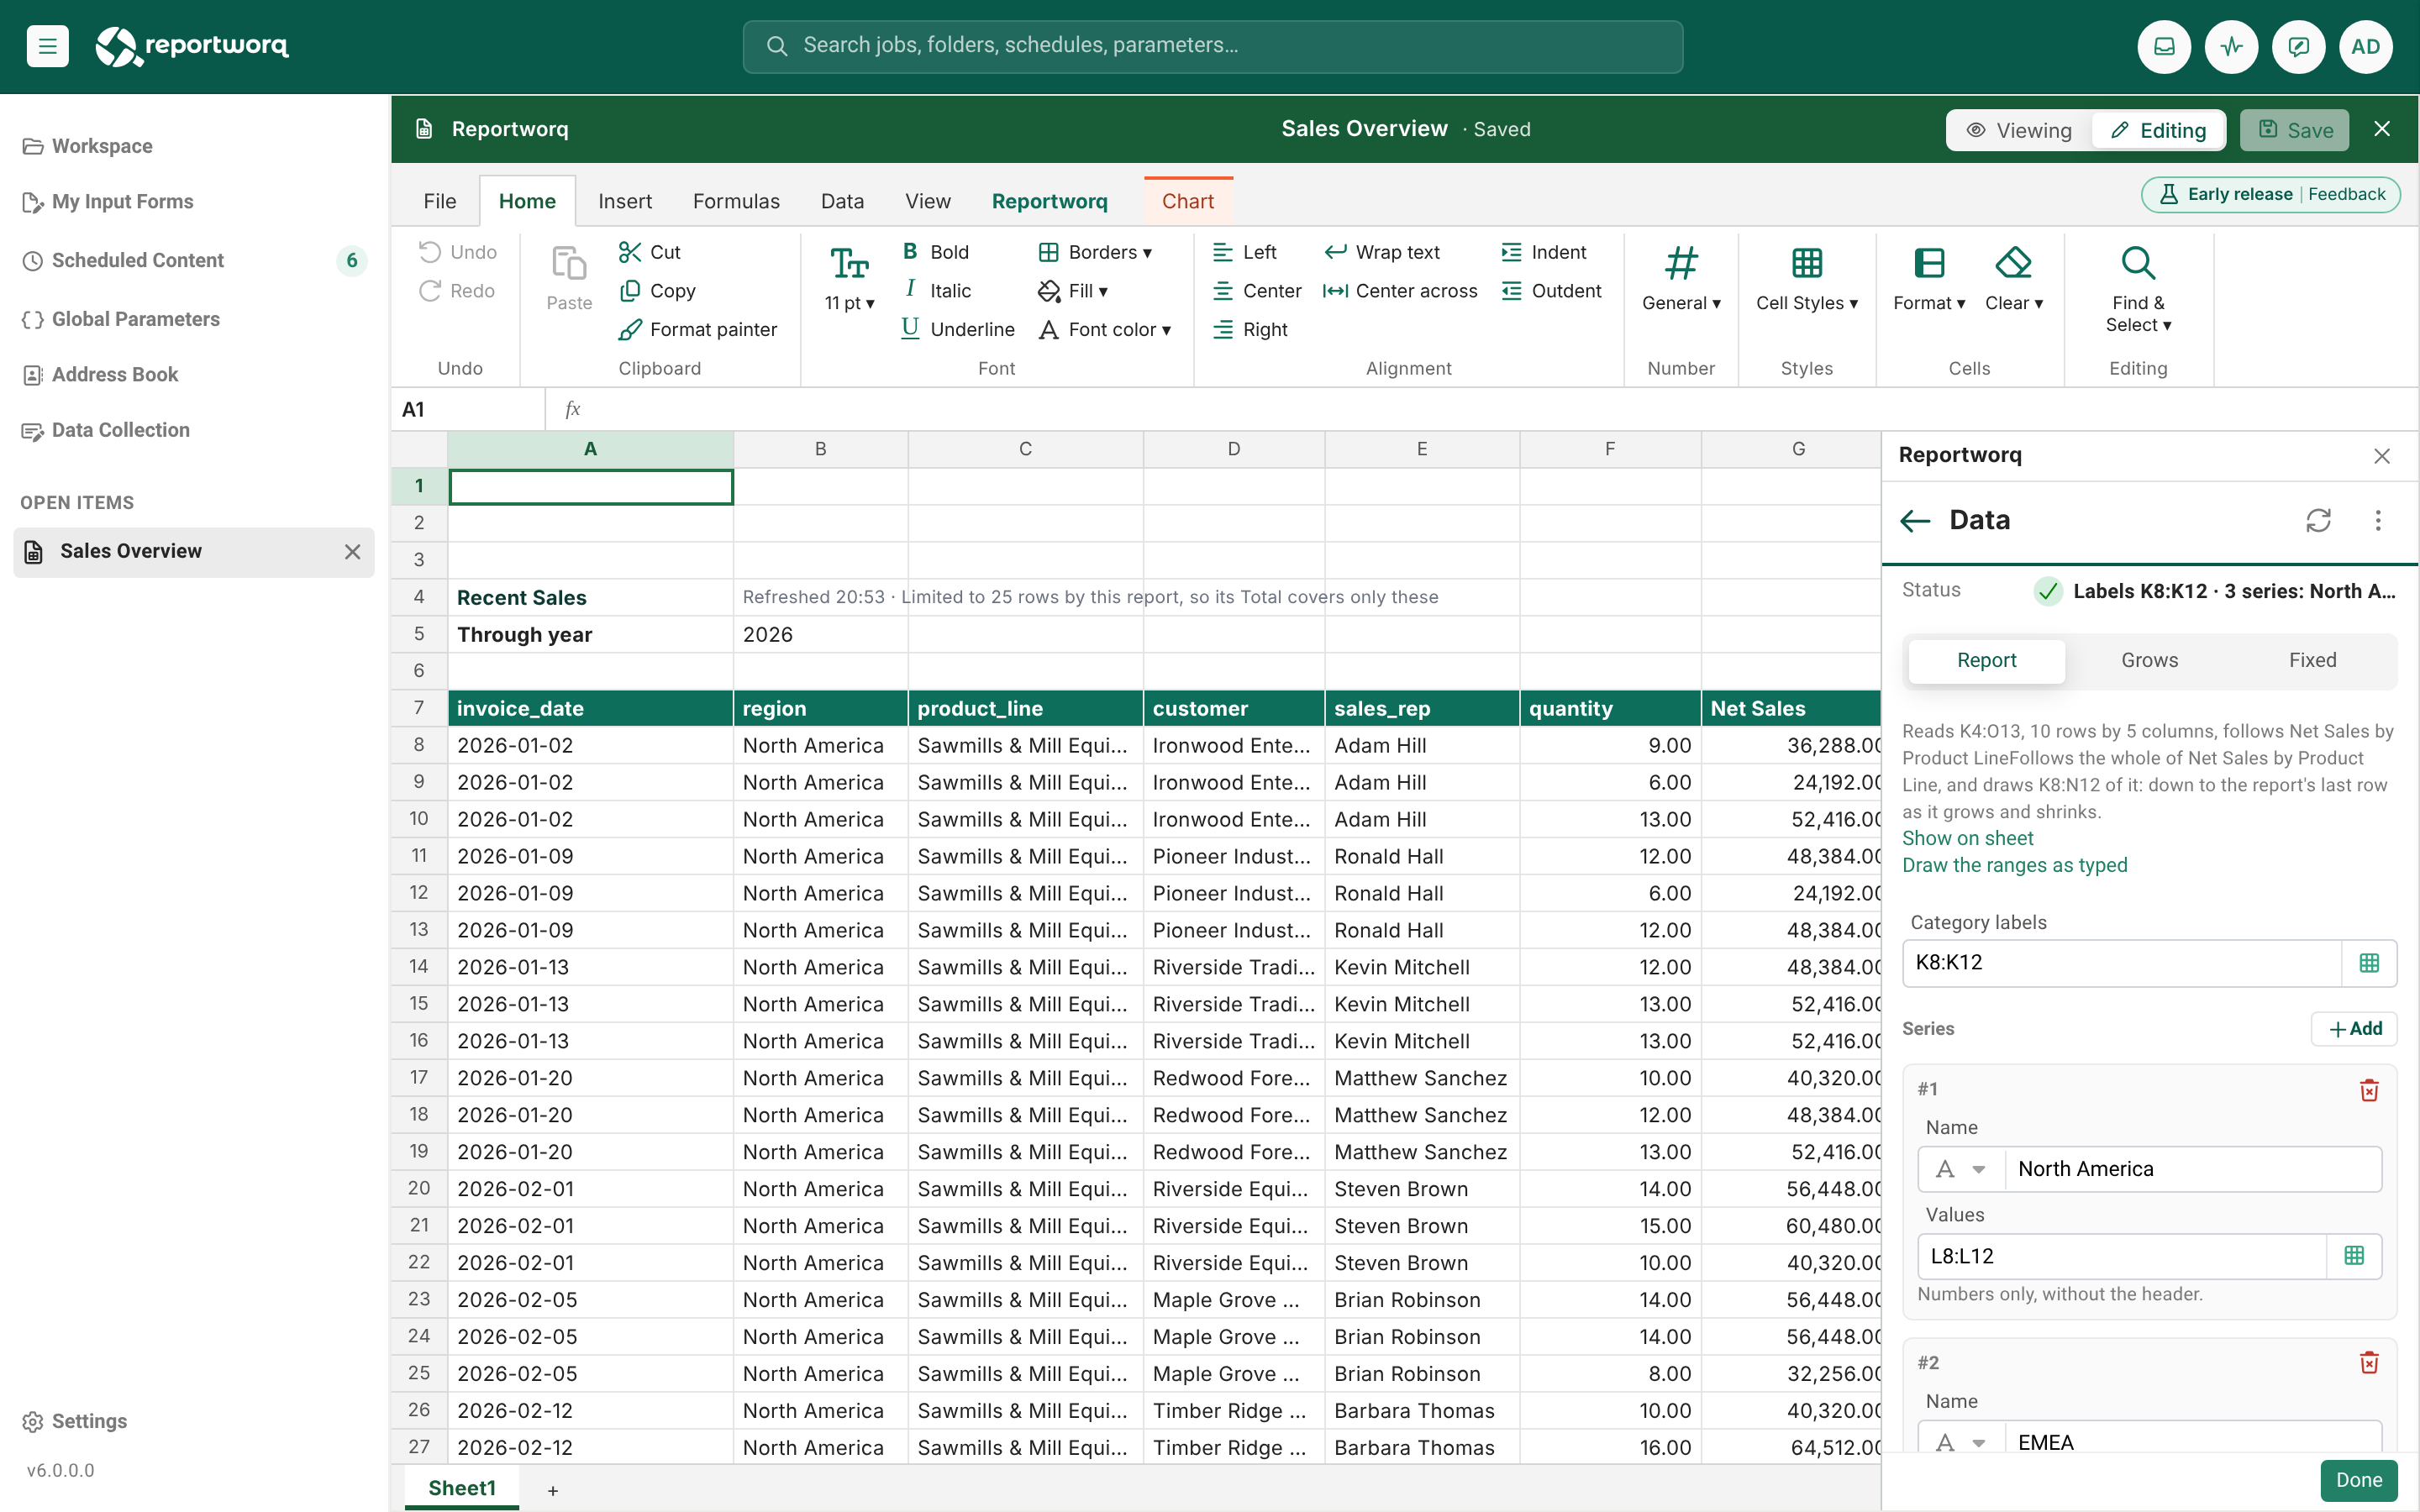
A chart made from a selection remembers what it was made from. The Data page shows a Reads line and a source mode:
| Mode | What it does |
|---|---|
| Report | Follows a list or crosstab. As the report grows, shrinks or gains filter lines, the chart draws every data row and never the Total row (unless you charted it) |
| Grows | Starts at the cells you chose and grows down and across while the cells are filled |
| Fixed | Draws exactly those cells |
Show on sheet selects the cells the chart reads. If a chart says "Draws fixed cells", choose Follow these cells to make it follow its report. Draw the ranges as typed drops the source, which is the way out when the report it followed was deleted.
A chart over a crosstab draws each series from the column that holds its name. If a column is filtered away, that series is left out. If the report has no rows for a part of a burst, the chart draws empty under its own title.
Add a map#
- On the sheet, make a table with a header row. For markers use
label, then latitude and longitude. For bubbles add avaluecolumn. Create table writes a ready-made template at the active cell. - Choose Map on the New group, then Points or Bubbles.
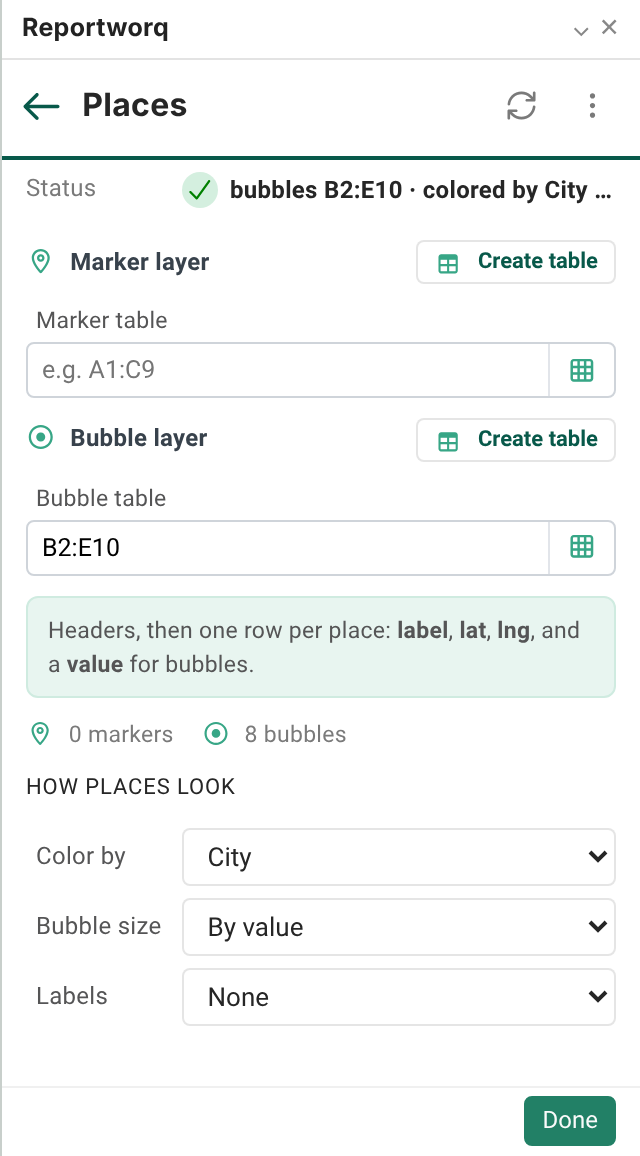
- On Places, pick the Marker table and/or the Bubble table. Optionally set Color by a column, Marker size (or Bubble size) by a column, and Labels from a column.
- On Background & position, choose a tile map or a picture, then frame it by place search or by latitude, longitude and zoom. Framing cells must be single cells on the map's own sheet.
Notes and limits for maps
- A tile map is a static image: it is not pannable inside Excel. Frame it in the pane.
- Tiles come from OpenStreetMap by default. The server fetches tiles only over https from a host that resolves to public addresses. A tile source that fails the check, or cannot be reached, leaves the map drawn without tiles; the render or job does not fail. A server with no outbound internet draws maps without tiles.
- A picture background can be PNG, JPEG, GIF, WebP or BMP. SVG is not accepted. Load sample offers five floor plans: Factory floor, Warehouse, Retail store, Office floor, Farm and mill.
- A place with a latitude outside -90 to 90 or a longitude outside -180 to 180 is left off the map. The Places page says how many were left off. A place with a blank latitude or longitude is kept but not drawn.
In a distribution job#
A chart is stored with its definition, so when a job runs a workbook that holds one, the chart is redrawn from that run's data and delivered as a picture at the size it has on the sheet. A map goes out as saved: its places are not re-read, so a job that narrows a web report refuses to run if that would send every recipient all the places. See A web report as a job source.
Notes and limits#
- Rows or columns you insert or delete inside the block, below its header, do not move a range that starts below them. In the Excel add-in your own edits there are followed name by name.
- A Sankey drops rows with a blank end, a self-loop, or a zero or negative value. A range chart drops half-pairs.
- A heatmap draws a missing cell blank and outlined, never as zero.
- Chart pictures from a job are rendered at three times the on-sheet size so they stay sharp in PDF and PowerPoint.
- Fill in from sends up to 12 rows of the selected block, all their columns, to your AI provider. A line under the button says so. With no enabled AI connection nothing is sent.
Going deeper. To drive a chart's title or a map's center from a cell, see Cell-driven variables. To put a chart on the same sheet as other report types, see Combine report types.
Feedback on this page
Comments, questions, requests, or something missing or unclear? Email us - the page you are on is filled in for you.
Email feedback on this pageOr write to support@reportworq.com directly.