
AI insights#
Early release. This feature is in early release, so its screens and behavior may change. Tell us what you think with Send feedback. See Early release features and Send feedback.
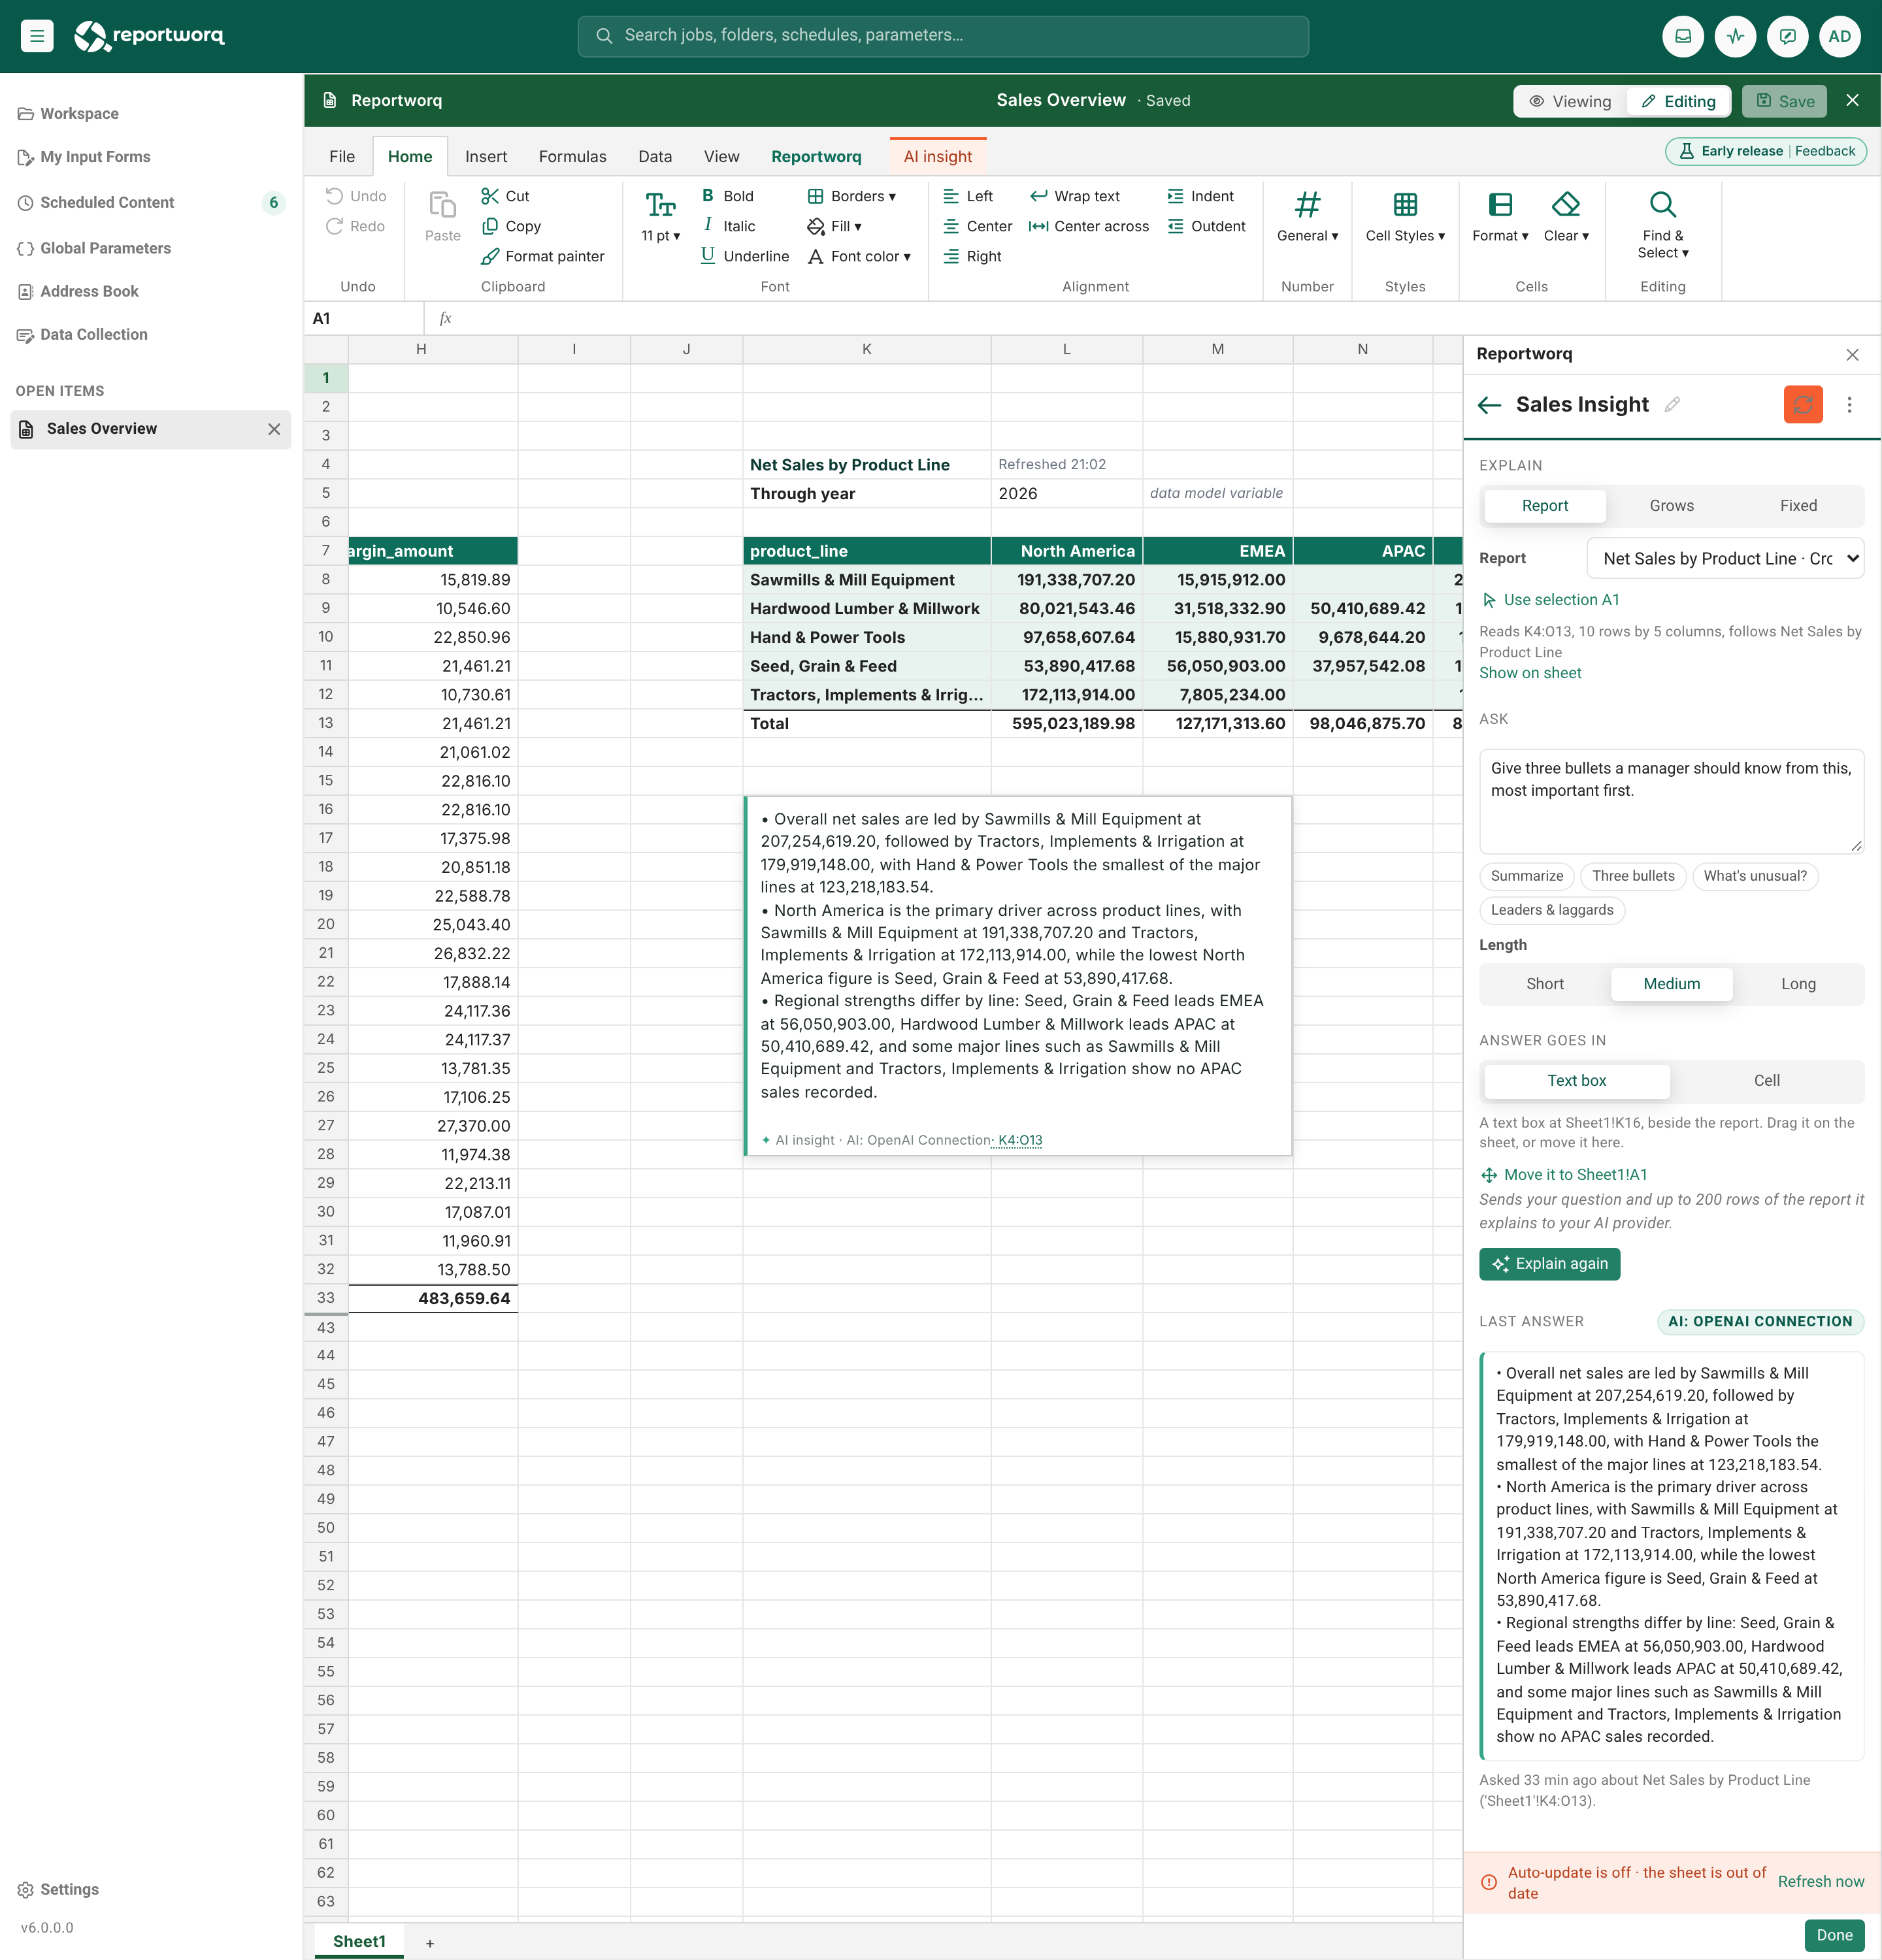
An AI insight is a report type that explains other cells in words. You point it at a list, a crosstab, a chart or a range, ask a question, and the answer appears in a text box on the sheet or in one cell. It keeps its answer with the report, so readers see the text without anyone asking again.
When to use it. Under a Financial Reports crosstab of revenue by region, a one-paragraph "What stands out this quarter?" for the people who only read the delivered PDF.
This is not the same as the AI Generated Insights section of a job's Distribution step, or the
RWAIINSIGHTworksheet function. Those are described in AI-generated insights in reports. An AI insight report type lives on the sheet and is part of the web report or workbook.
Where you can build one#
| Web report studio | Excel add-in | |
|---|---|---|
| AI insight report type | Yes | Yes, in the analyst pane |
| Companion pane (analyst pane turned off) | Not applicable | No. Its only AI tool is Create with AI in the chart builder |
| Build with AI and Edit with AI (the report chat) | Yes | Yes, in the analyst pane |
Before you start#
- An administrator has added and enabled an AI connection. See Connect an AI provider. Any enabled provider connection works; if the insight names none, the first enabled one is used.
- Without an enabled connection the insight still works in the pane, but a labeled offline stand-in answers from the numbers (what leads, what is smallest, how many are above average) and marks itself "AI offline: demo stand-in". A distribution job never uses the stand-in.
- A report, chart or range to explain.
Add an AI insight#
- Click the cell where the insight should start. A text box can sit anywhere; do not click inside another report.
- Choose New, then AI insight (in Excel, also the AI insight button on the List and Crosstab ribbon tabs, or a report card's menu on Home).
- Under What to explain, pick a source mode, or choose Use selection with the cells selected:
- Report follows a list, crosstab, chart or map as it renders now, however a filter or variable changes it.
- Grows starts at a cell and reads down to the first blank row and across to the first blank column, stopping at any report.
- Fixed reads exactly the cells you typed.
- Type the question, for example "Which regions are below plan and by how much?"
- Choose where the answer goes (a text box or one cell), the length (short, medium or long) and, if you have more than one, the AI connection by name.
- Choose Explain.
The pane's Reads line says what the insight reads, for example "Reads B5:F12, 8 rows by 5 columns, follows Sales by Region". Show on sheet selects those cells.
What is sent to the AI provider#
The pane shows a line above Explain: "Sends your question and up to 200 rows of the report it explains to your AI provider."
- The cells a reader sees now, as displayed text (
15.3%,52.05M, never the raw number). Rows and columns hidden by hand, by an AutoFilter or by Reportworq, and a report's format range, are left out. - The report's title and filter lines, its header row, and a marker on subtotal and total rows.
- At most 200 rows or 24,000 characters. If the data is cut, the cut is stated in the request and the total rows are still sent.
- A chart or map sends its data range. A range over two reports is sent in parts, with a rule never to combine figures across parts.
- Cell text that looks like instructions to the model is neutralized so a cell cannot close the data block or open one of its own.
- Nothing is sent without a click on Explain, Refresh or a refresh-all command, or a job run that reaches the insight.
Treat the provider as having seen the cells shown. Do not point an insight at cells a recipient should not see.
Check the answer#
An answer is checked before it is kept. Figures in the answer that cannot be found in the data are listed, and the answer shows "Unverified figures: ... Check them before you rely on this answer." in a callout in the pane, a chip on the report card, and the foot of the text box. A cell answer carries the same line as a note on the cell. A correct figure the model worked out itself is marked too: the mark means nobody checked, not that it is wrong. A refused answer, for example one holding a link, contact or path, is an error and the insight keeps its previous answer.
A model can still state something false in words, or steer tone, if a cell tells it to. Review insights before you send them to customers.
When the cells an insight read change after its answer, it is marked out of date until it is asked again.
In a distribution job#
When a job uses a web report as its source, each insight is asked again while the report is converted, using the cells as they are in that run. The answer goes out as a text box or cell in the delivered workbook or PDF.
- If the ask fails (no AI connection, a disabled connection, a timeout, a refused answer), the saved answer is withdrawn rather than sent as this run's. The text box or cell says
AI insight not refreshed in this run.In a narrowed or burst run it saysAI insight unavailable for this filtered report.The run completes with a warning that names the insight and the reason; it does not fail. - On a Test run, tick Skip AI Insights to spend no AI tokens. A placeholder
[AI Insight skipped for this test run]appears, and Run History will not let you Send that run to recipients. - A workbook converted with Convert to Excel keeps its insights as saved text. A whole-workbook run that refreshes the reports withdraws their answers with "AI insight not refreshed in this run." because nothing asks them again on that route.
- Rows hidden by a report-suppress step during the run are not hidden yet when the insight reads, so they can be sent.
See A web report as a job source and Convert to Excel.
Notes and limits#
- The text box is 420 pixels wide by default; its height follows the answer, from 100 to 640 pixels. A cell answer is one or two sentences.
- A source that cannot be read (its report or cells were deleted) is never asked and says why.
- In Excel, a Grows source over plain cells becomes a Fixed range, because the pane cannot see where your own table ends. Excel's own insert and delete do not move an insight's source until the next sync.
- On the studio canvas a source reads at most 1,000 rows by 52 columns.
Feedback on this page
Comments, questions, requests, or something missing or unclear? Email us - the page you are on is filled in for you.
Email feedback on this pageOr write to support@reportworq.com directly.