
The viewer#
Early release. This feature is in early release, so its screens and behavior may change. Tell us what you think with Send feedback. See Early release features and Send feedback.
The viewer is how you read a web report. It draws the report as it would print, with live data, and lets you change what the report shows (pick a filter value, expand a row, look at the rows behind a number) without changing how the report is built. Nothing you do in the viewer is saved.
When to use it. A finance analyst opens a web report from the Financial Reports folder, picks her region in a filter, drills a variance to its source rows and copies them into Excel, all without opening Excel or asking the report's author for a new version.
Who can open a web report#
Only authors and administrators can open a web report. This is by design: a web report is a working document for the people who build and analyze, and readers get the finished result another way.
| You are | What you see |
|---|---|
| Author or administrator | The web report in the workspace, in the viewer. The Edit button appears if you may change the report. |
| Reader | No web reports at all. They are left out of the folder tree, search and listings. A link to one lands the reader on the workspace root, and the report does not open. What a reader receives is the static output of the distribution jobs that distribute the report, such as the PDF or workbook in an email or the job's outputs. |
To give readers a web report's content, put the report in a distribution job. See A web report as a job source.
Open the viewer#
- In the workspace, select the web report's name, or open its ⋯ menu and select View.
- A report that already has content opens in the viewer. A report with nothing in it opens in the editor instead.
- Wait for the status next to the report name to read Live. While it reads Refreshing, the report is reading its data again.
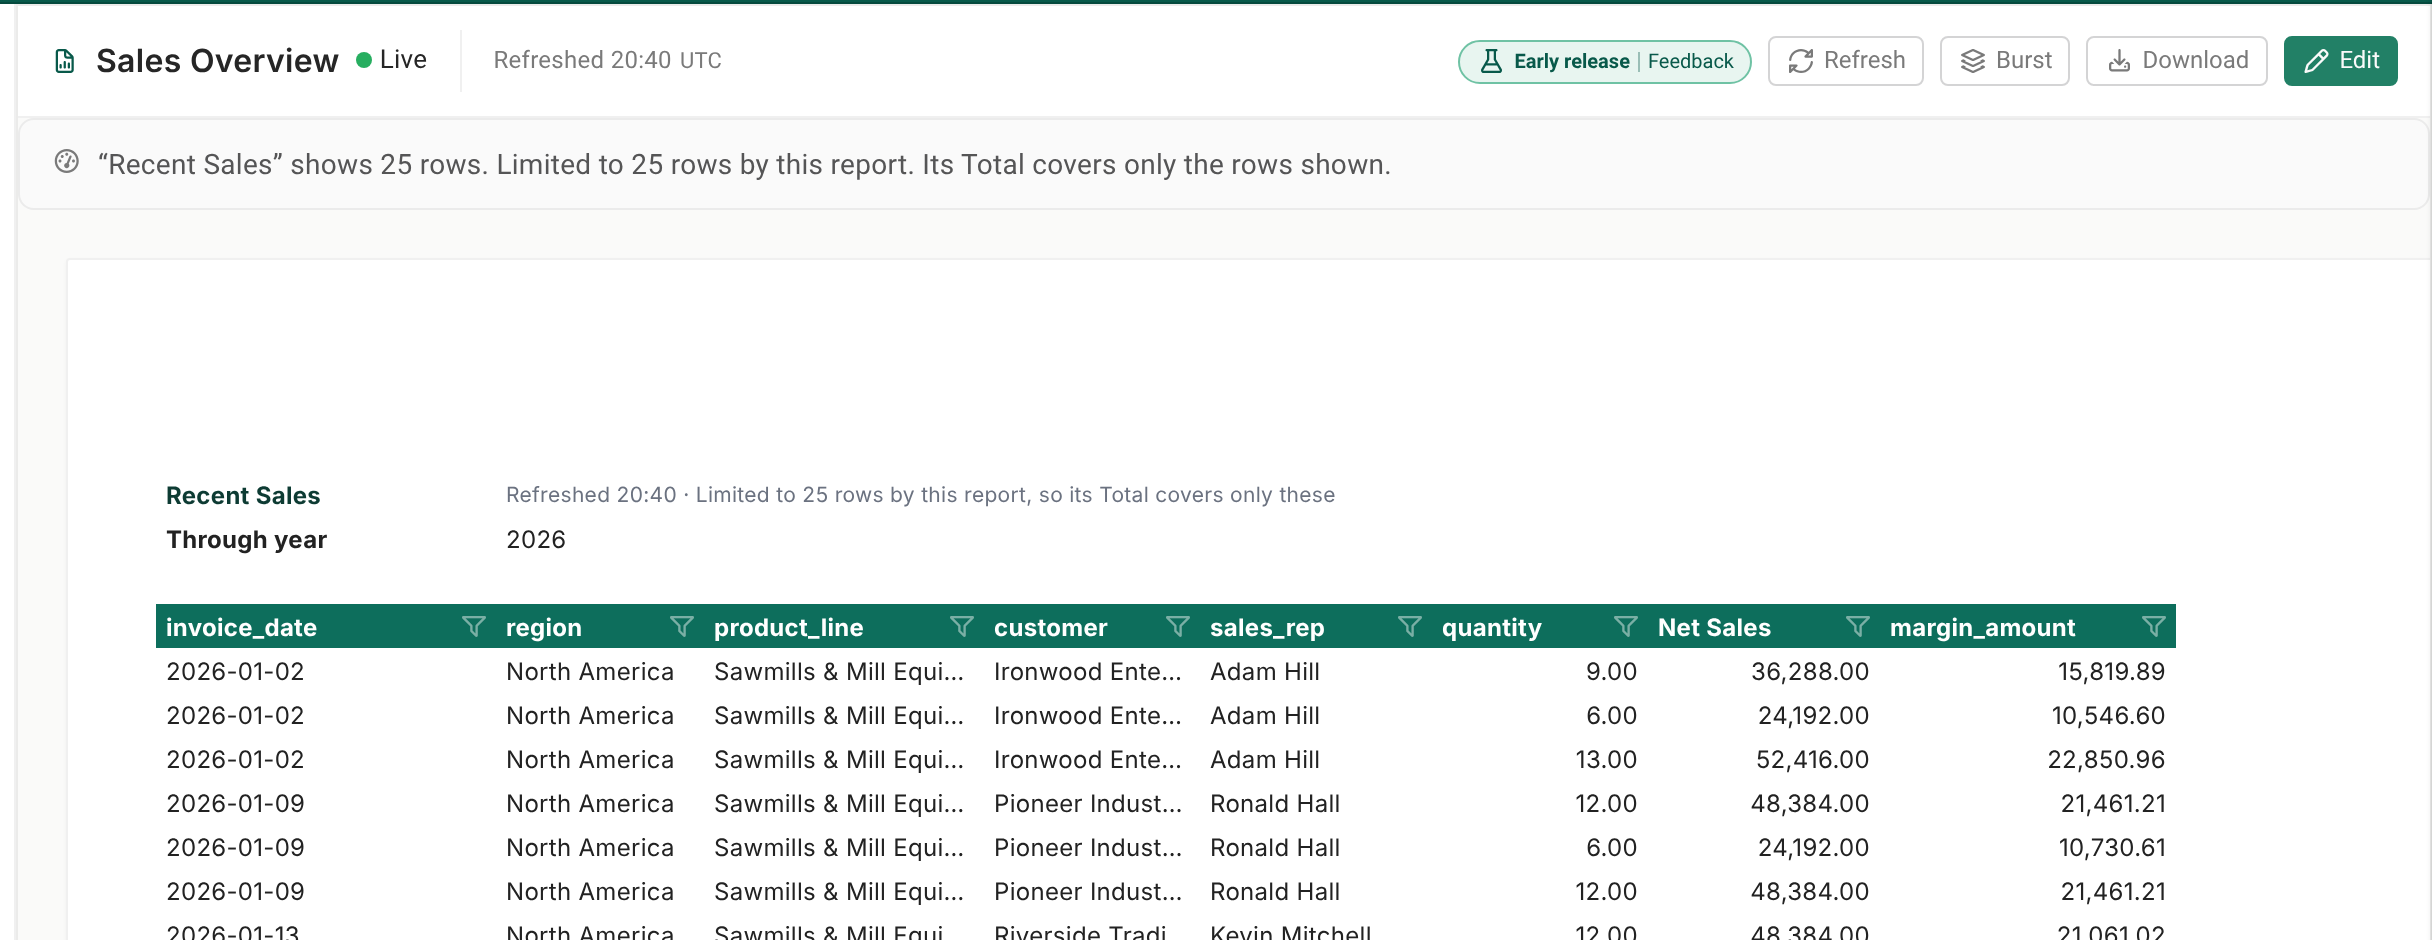
Opening a report always refreshes every report on it from its live source, so you see today's numbers.
The command bar#
| Control | What it does |
|---|---|
| Report name, Live or Refreshing | The report and its state. |
| Refreshed 15:42 | When the report last read its data, on your own clock (24-hour), with your time zone beside it. |
| Unsaved edits | Shown to editors who came to the viewer from the editor with layout changes not yet saved. |
| View adjusted | You changed what the report shows. Nothing is saved. |
| Transactions | Shown when one number is selected. Lists the source rows behind it. |
| Copy | Shown when cells are selected. |
| Reset view | Shown after you adjust the view. Puts the report back as it was when you opened it. |
| Early release · Feedback | The early release badge, to the left of Refresh. See Early release features and Send feedback. |
| Refresh | Reads every report on the page again from its live source. |
| Burst | Runs the report once per value of a filter. See Download, burst and keep a view. |
| Download | Takes the report away as Excel or PDF. See Download, burst and keep a view. |
| Edit | Opens the editor. Shown only to people who may change the report. |
A Sheets panel on the left lists the sheets when the report has more than one visible sheet. A sheet the author hid is not shown in the viewer, but it still goes out, hidden, in Excel downloads and job output.
Change what the report shows#
Pick a filter value. A filter or variable on the page has a drop-down. Select its cell and pick a value. A variable that allows only its list of choices refuses a value that is not on the list.
Filter a column. A column heading of a list report, or of a filter the author set on plain cells, shows a funnel.
- Select the heading's funnel.
- Search the values, tick or clear them, or use (Select all).
- Select Apply, or Clear to put the author's own choices back.
On a list report the menu lists the distinct values of the list's source, not only the rows drawn on the page. It tells you when the list may be partial, for example "More than 500 values: only the first 500 are listed. A value past them stays in when you untick others." The viewer has no sorting.
Expand and collapse. Select the plus or minus glyph next to a row label. If there is no room to expand because another report sits right below, the viewer says so, for example: "There isn't room to expand “West” here: “Largest accounts” sits right below it. The report's author can make it insert rows as it grows."
Break a row down. On a crosstab row label, open the nest menu and choose Break
Look at the rows behind a number. Double-click a number, or select it and select Transactions. A dialog lists the source rows, up to 200, and says when there are more (for example "1,234 source rows · showing the first 200 · Copy rows copies all 1,234"). Copy rows copies every row with its headings. A cube crosstab number cannot be drilled, because a cube holds the number and not the rows behind it. A text cell or a heading says "This number has no source rows to show."
Copy cells. Drag over cells, then select Copy or press Ctrl+C. The cells paste into Excel as cells.
Load all rows. A list report that shows only some of its source's rows has a note above the page saying how many it shows of how many its source has. When the author set the report's Rows read from the source to the same number as its row limit, the note also carries a Load all rows button. A list limited only by Limit rows shows the note without the button. Select it to read up to the report's ceiling of 1,000,000 rows. If the source has more than that and the report needs every row, the report keeps its limit and tells you why.
Refresh. Select Refresh to read every report again. An AI insight whose data changed because of your filter shows "Out of date: the report has changed since this answer was asked. Refresh to ask again." at the foot of its box. Refresh asks again.
Reset view. Select Reset view to undo every adjustment and go back to the report as you opened it.
Notes and limits#
- Nothing is saved. The viewer never writes the report. Select Edit and the editor opens on the report as the author last saved it, not on what you adjusted. To keep a view you built, see Download, burst and keep a view.
- Row limits. A report reads at most 1,000,000 rows from its source. The sheet shows 1,000 rows and columns A to AZ; a list taller than that draws the rows that fit and says so. See Limits of a web report.
- A report cannot be drawn. The viewer shows the reason in place of numbers. Fix the source or the report's filters in the editor, or ask its author.
- No Find button. Use your browser's find (Ctrl+F) on the page.
Going deeper. To build a web report, start with The web report studio. To understand where the viewer fits, see How reporting works.
Feedback on this page
Comments, questions, requests, or something missing or unclear? Email us - the page you are on is filled in for you.
Email feedback on this pageOr write to support@reportworq.com directly.