
Professional reports#
Early release. This feature is in early release, so its screens and behavior may change. Tell us what you think with Send feedback. See Early release features and Send feedback.
Not released yet. Professional reports are not currently released. This page is in preparation for the next release. It describes what to expect, and the feature is not available on a standard license today.
A professional report is a sheet you lay out freely: your own labels, blank lines, Excel formulas between report rows, and any formatting. Reportworq owns only the report's own formulas, one per row or column header, and fills in every number where a row meets a column.
When to use it. A monthly Timberline P&L where the account rows are fixed, a "Top 5 product lines under Revenue" row grows and shrinks on every refresh, your own margin formulas sit between rows, and a quarter filter is a drop-down on the sheet. A crosstab cannot be formatted line by line like that.
License#
Professional reports are a licensed feature. They are not part of a standard license yet; today they come with internal and QA licenses only. Web reports themselves need no license, and neither do lists, crosstabs, charts, maps or AI insights. See Licensing.
A server without the license behaves like this:
- Controls stay, disabled. Professional report in the New group, Convert to professional, Add dynamic row, Add row member and Add column member are disabled with the reason
Professional reports are coming soon.A command that reaches the pane anyway shows the same sentence and creates nothing. - A web report that already holds a professional report opens with that report's value cells blank, only in that session, and it cannot be saved, saved as, exported or downloaded. The stored report is not changed. Once the server is licensed it opens normally.
- A distribution job over it stops and distributes nothing. The job fails with this message, where the name is the web report the job uses:
Nothing was distributed: the web report '<name>' uses a professional report, which this license does not include.The message is quoted exactly as the product words it. If a workbook holds the report's formulas, the same sentence names that source. - AI insights are not asked over a professional report's cells.
The license does not show in the Capabilities block of the License tab, so the messages above are the signal. To get it, ask your Reportworq contact.
Where you can build one#
| Web report studio | Excel add-in | |
|---|---|---|
| Start blank or convert a crosstab | Yes (licensed) | No. The controls are disabled with Professional reports aren't in Excel yet. and a toast adds "Build them in the web report studio." |
| Open a workbook that already holds one | Yes | Listed and handled, but its formulas do not calculate in Excel itself |
Build professional reports in the web report studio. Then convert the web report to Excel or use it as a job source; a professional report goes out of a job as saved values.
Before you start#
- A licensed server (above).
- A data model view with at least one measure. See Data models.
- A web report open in the studio, with an empty cell where the report should start.
Start a professional report from blank#
- Click an empty cell where the report should begin.
- In the studio ribbon choose New, then Professional report. (The Home start button Professional does the same on an empty sheet.)
- On the report's Connection page, pick the data model and the view. Nothing is written to the sheet until you pick. The pick writes the report's anchor cell with its first measure.
- Under Rows, choose Add. In the form, pick a Field, tick its Members, and optionally tick Total. OK writes one row header per member down the label column (up to 200 per Add).
- Under Columns, choose Add and do the same across the header row. The first columns replace the temporary value column that shows each row's total.
- Choose the Value in the Report section if you want a different measure.
The pane shows the numbers as soon as the report has rows and columns. Before then it says "Add rows and columns to see numbers."
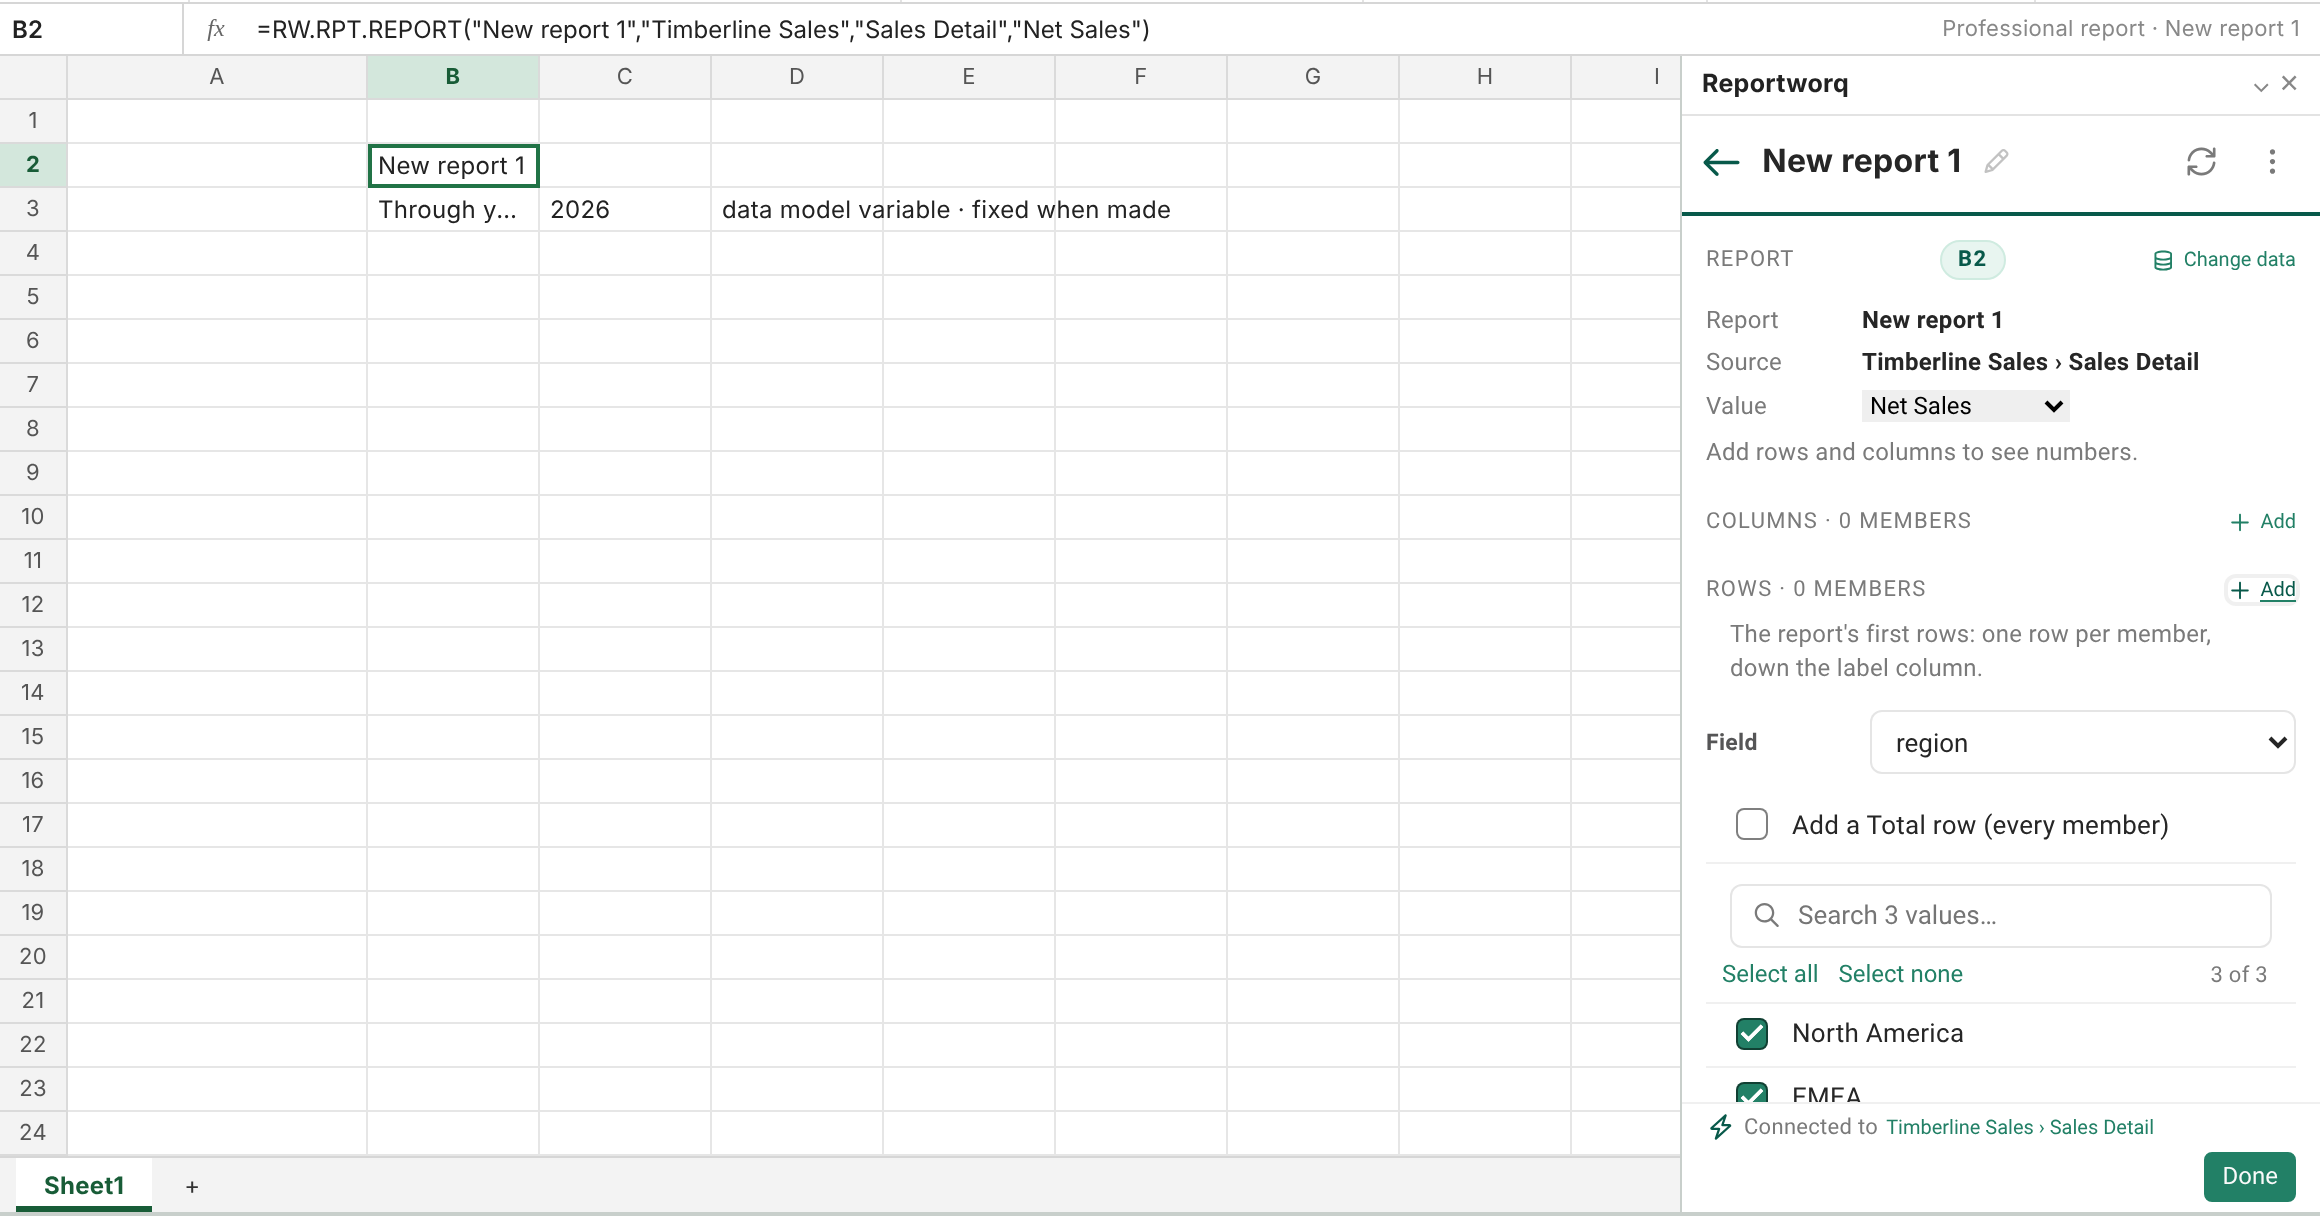
Refused when you start: a cell that is not empty ("Select an empty cell"), a view without a measure, a view with a required variable that has no default, a cube view (start from a crosstab and convert instead), and a place that would land on another report.
Convert a crosstab#
- Build and check the crosstab first. See Crosstabs.
- Select the crosstab and choose To professional report (the editor menu or the Crosstab ribbon tab).
- Reportworq rewrites the crosstab in place as formulas, keeps its formats, then compares every value and total with the crosstab. If anything differs, the convert is undone and refused with the count.
A crosstab converts only with a model, a row field, one column field, one column stack and one value. Several row stacks convert to one professional report per stack, layered down the sheet. Filters become report filters. Data model variables are carried as fixed values: those cells show the value the report reads but take no typing. To read with another value, change it on the crosstab and convert again.
A chart, map or AI insight that followed the crosstab follows the new report. After a stacked convert the toast tells you which chart still reads the old crosstab so you can pick its data again.
Convert refuses, naming the field, for a Top N on a row field or an inserted row, an "Everything else" row under an inserted row with left-out members, and any row or column member filter on a cube.
Make a row dynamic#
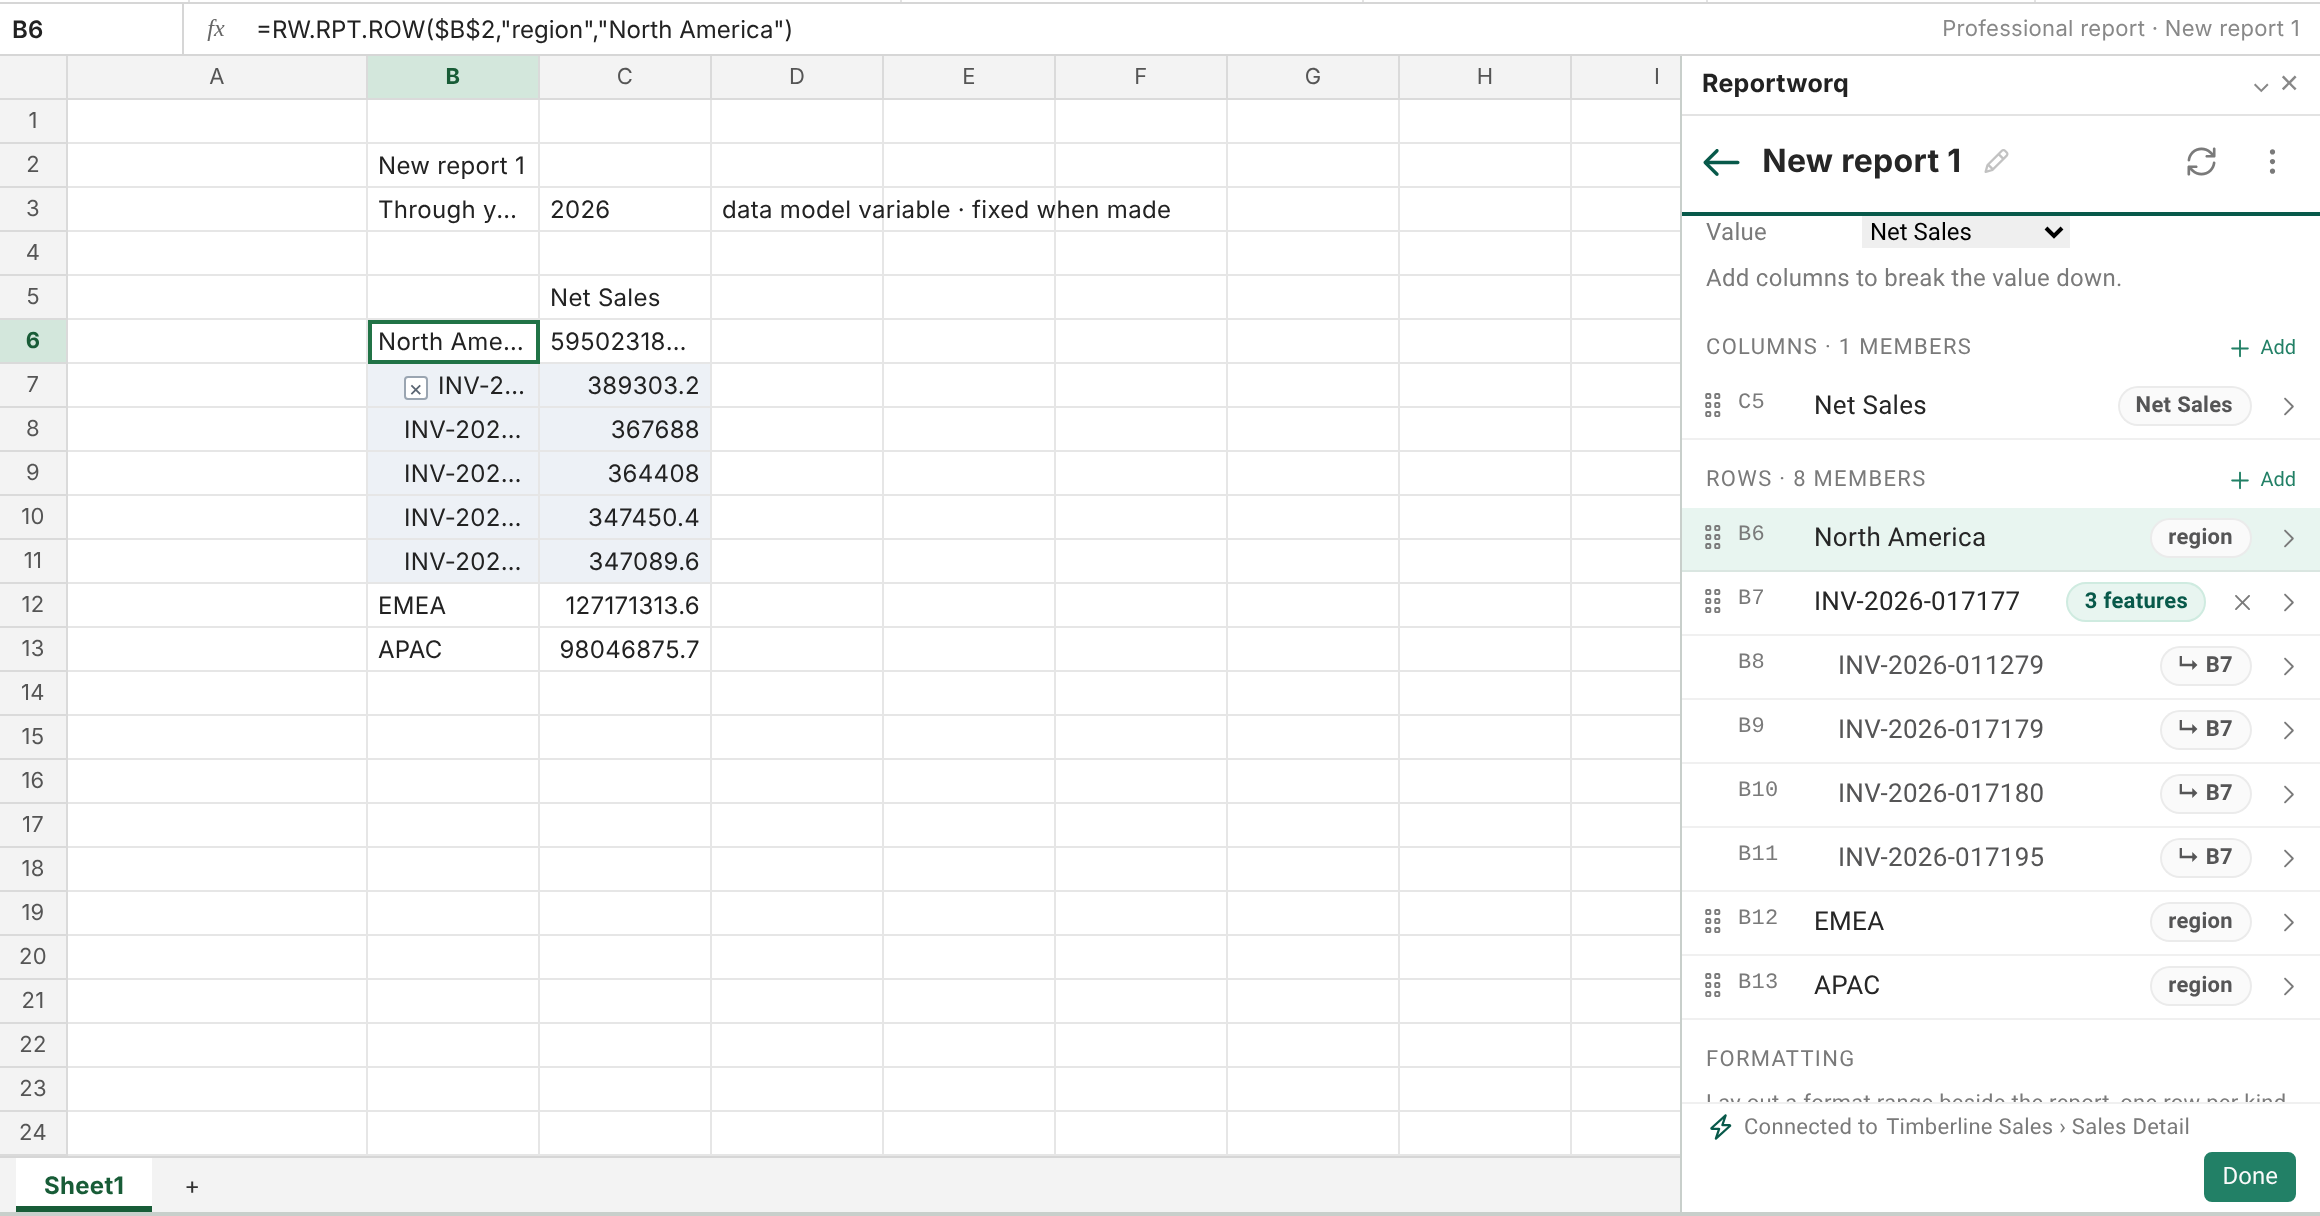
Select a row member and use Add dynamic row, then Top N. A temporary block grows or shrinks on every refresh and ranks by the report's value. In the Add menu a member can also take a label filter (equals, does not equal, contains, begins with, ends with) or Expand, which lists the member values in scope. On a cube, Expand on a consolidation walks the hierarchy.
Drag members and their generated blocks to reorder; references follow, as when you insert cut cells in Excel.
Notes and limits#
- Only Top and Bottom N, label filters and Expand are offered in the pane. Value filters, an "everything else" row on a Top N, subtotal planning and sort are not available yet; formulas that name them are kept but have no effect.
- A dynamic column is not available in the pane. Top, Filter and Expand work on row members.
- One value per report. Add writes siblings only, not child rows. Report filters cannot be added from the pane yet; a converted crosstab carries its filters.
- Values are rounded to two decimals and show unformatted until you format them with Excel's own tools.
- A cell claimed by two reports shows
#COLLISION. If a growing block would run through a neighbor, the refresh inserts cells across this report's columns instead, or is refused. - A member wrapped in your own IFERROR or IF still refreshes, but the pane shows it read-only.
- A refresh is held to the per-report cell cap and, in Excel, to the workbook total.
Feedback on this page
Comments, questions, requests, or something missing or unclear? Email us - the page you are on is filled in for you.
Email feedback on this pageOr write to support@reportworq.com directly.