
The Excel add-in and the studio#
Early release. This feature is in early release, so its screens and behavior may change. Tell us what you think with Send feedback. See Early release features and Send feedback.
You can build Reportworq reports in two places: in your own Excel workbook, with the Reportworq pane beside the sheet, and in the web report studio, in the browser. They are the same reporting engine. This page explains what they share, what is different, and how a workbook and a web report move between the two. For the step-by-step builds, see List reports and Crosstabs.
One pane, two hosts#
The Reportworq pane (also called the analyst pane) is one piece of software with two homes.
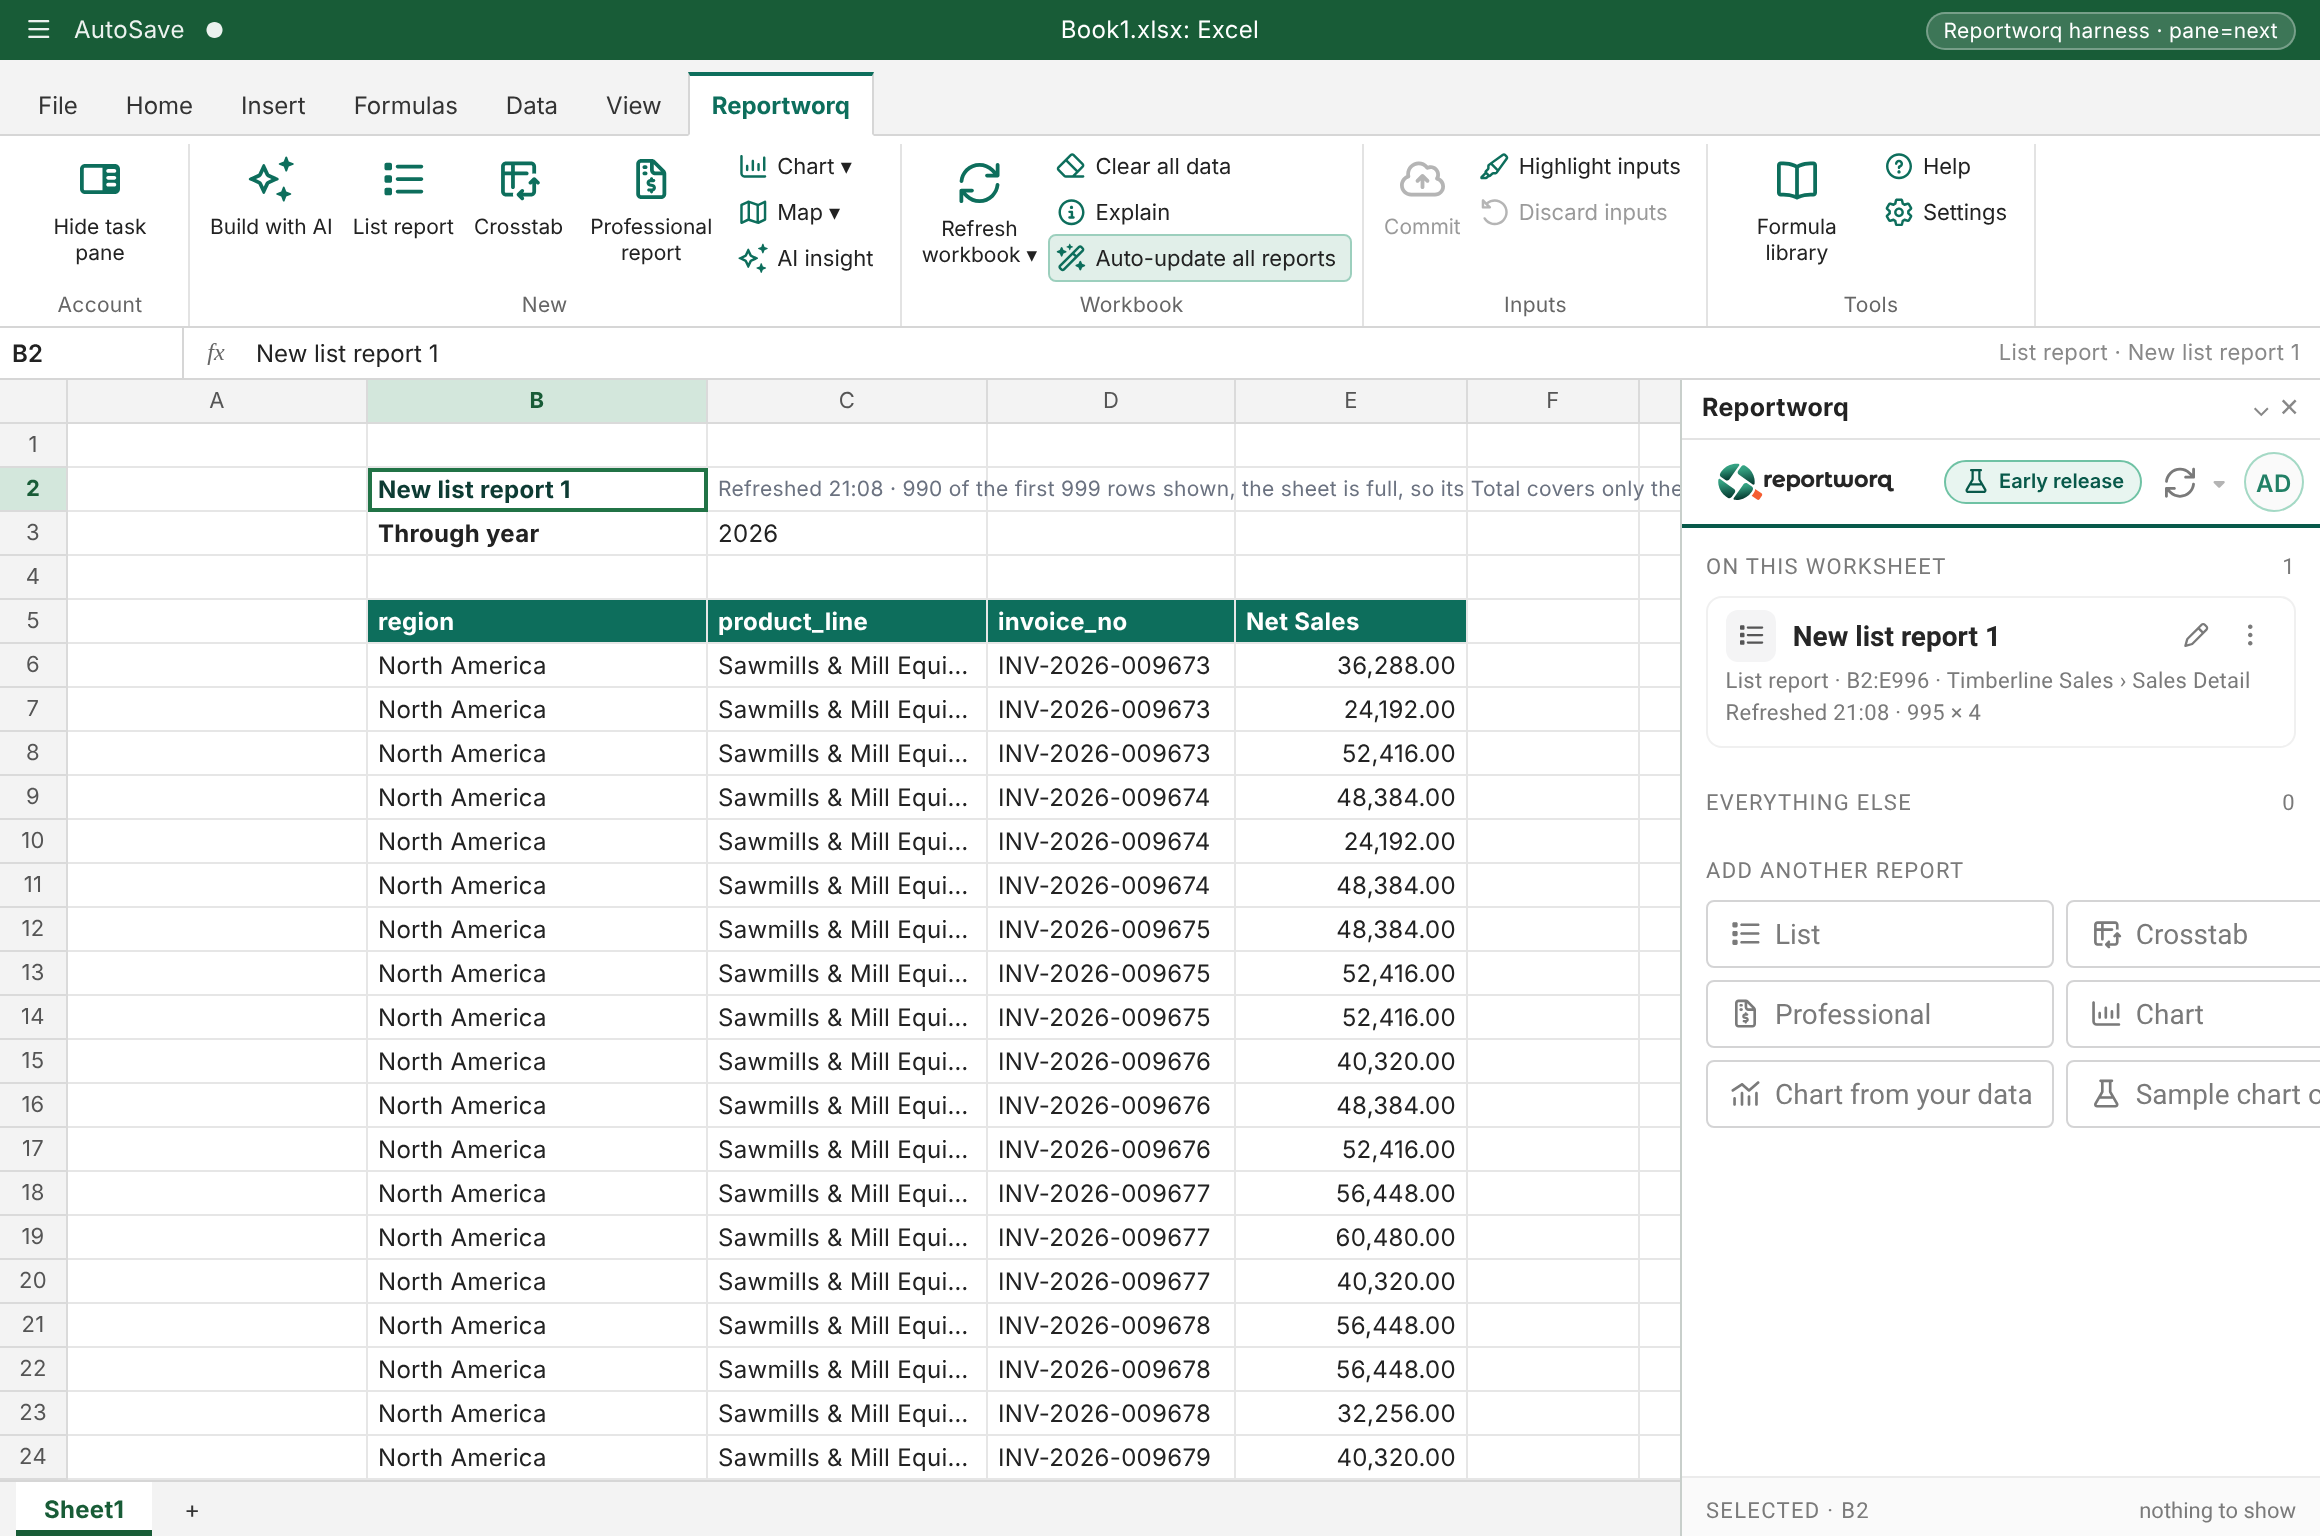
- In Excel, the pane sits in a task pane beside your real worksheet. Reports are written into your cells, and the workbook you save is the record.
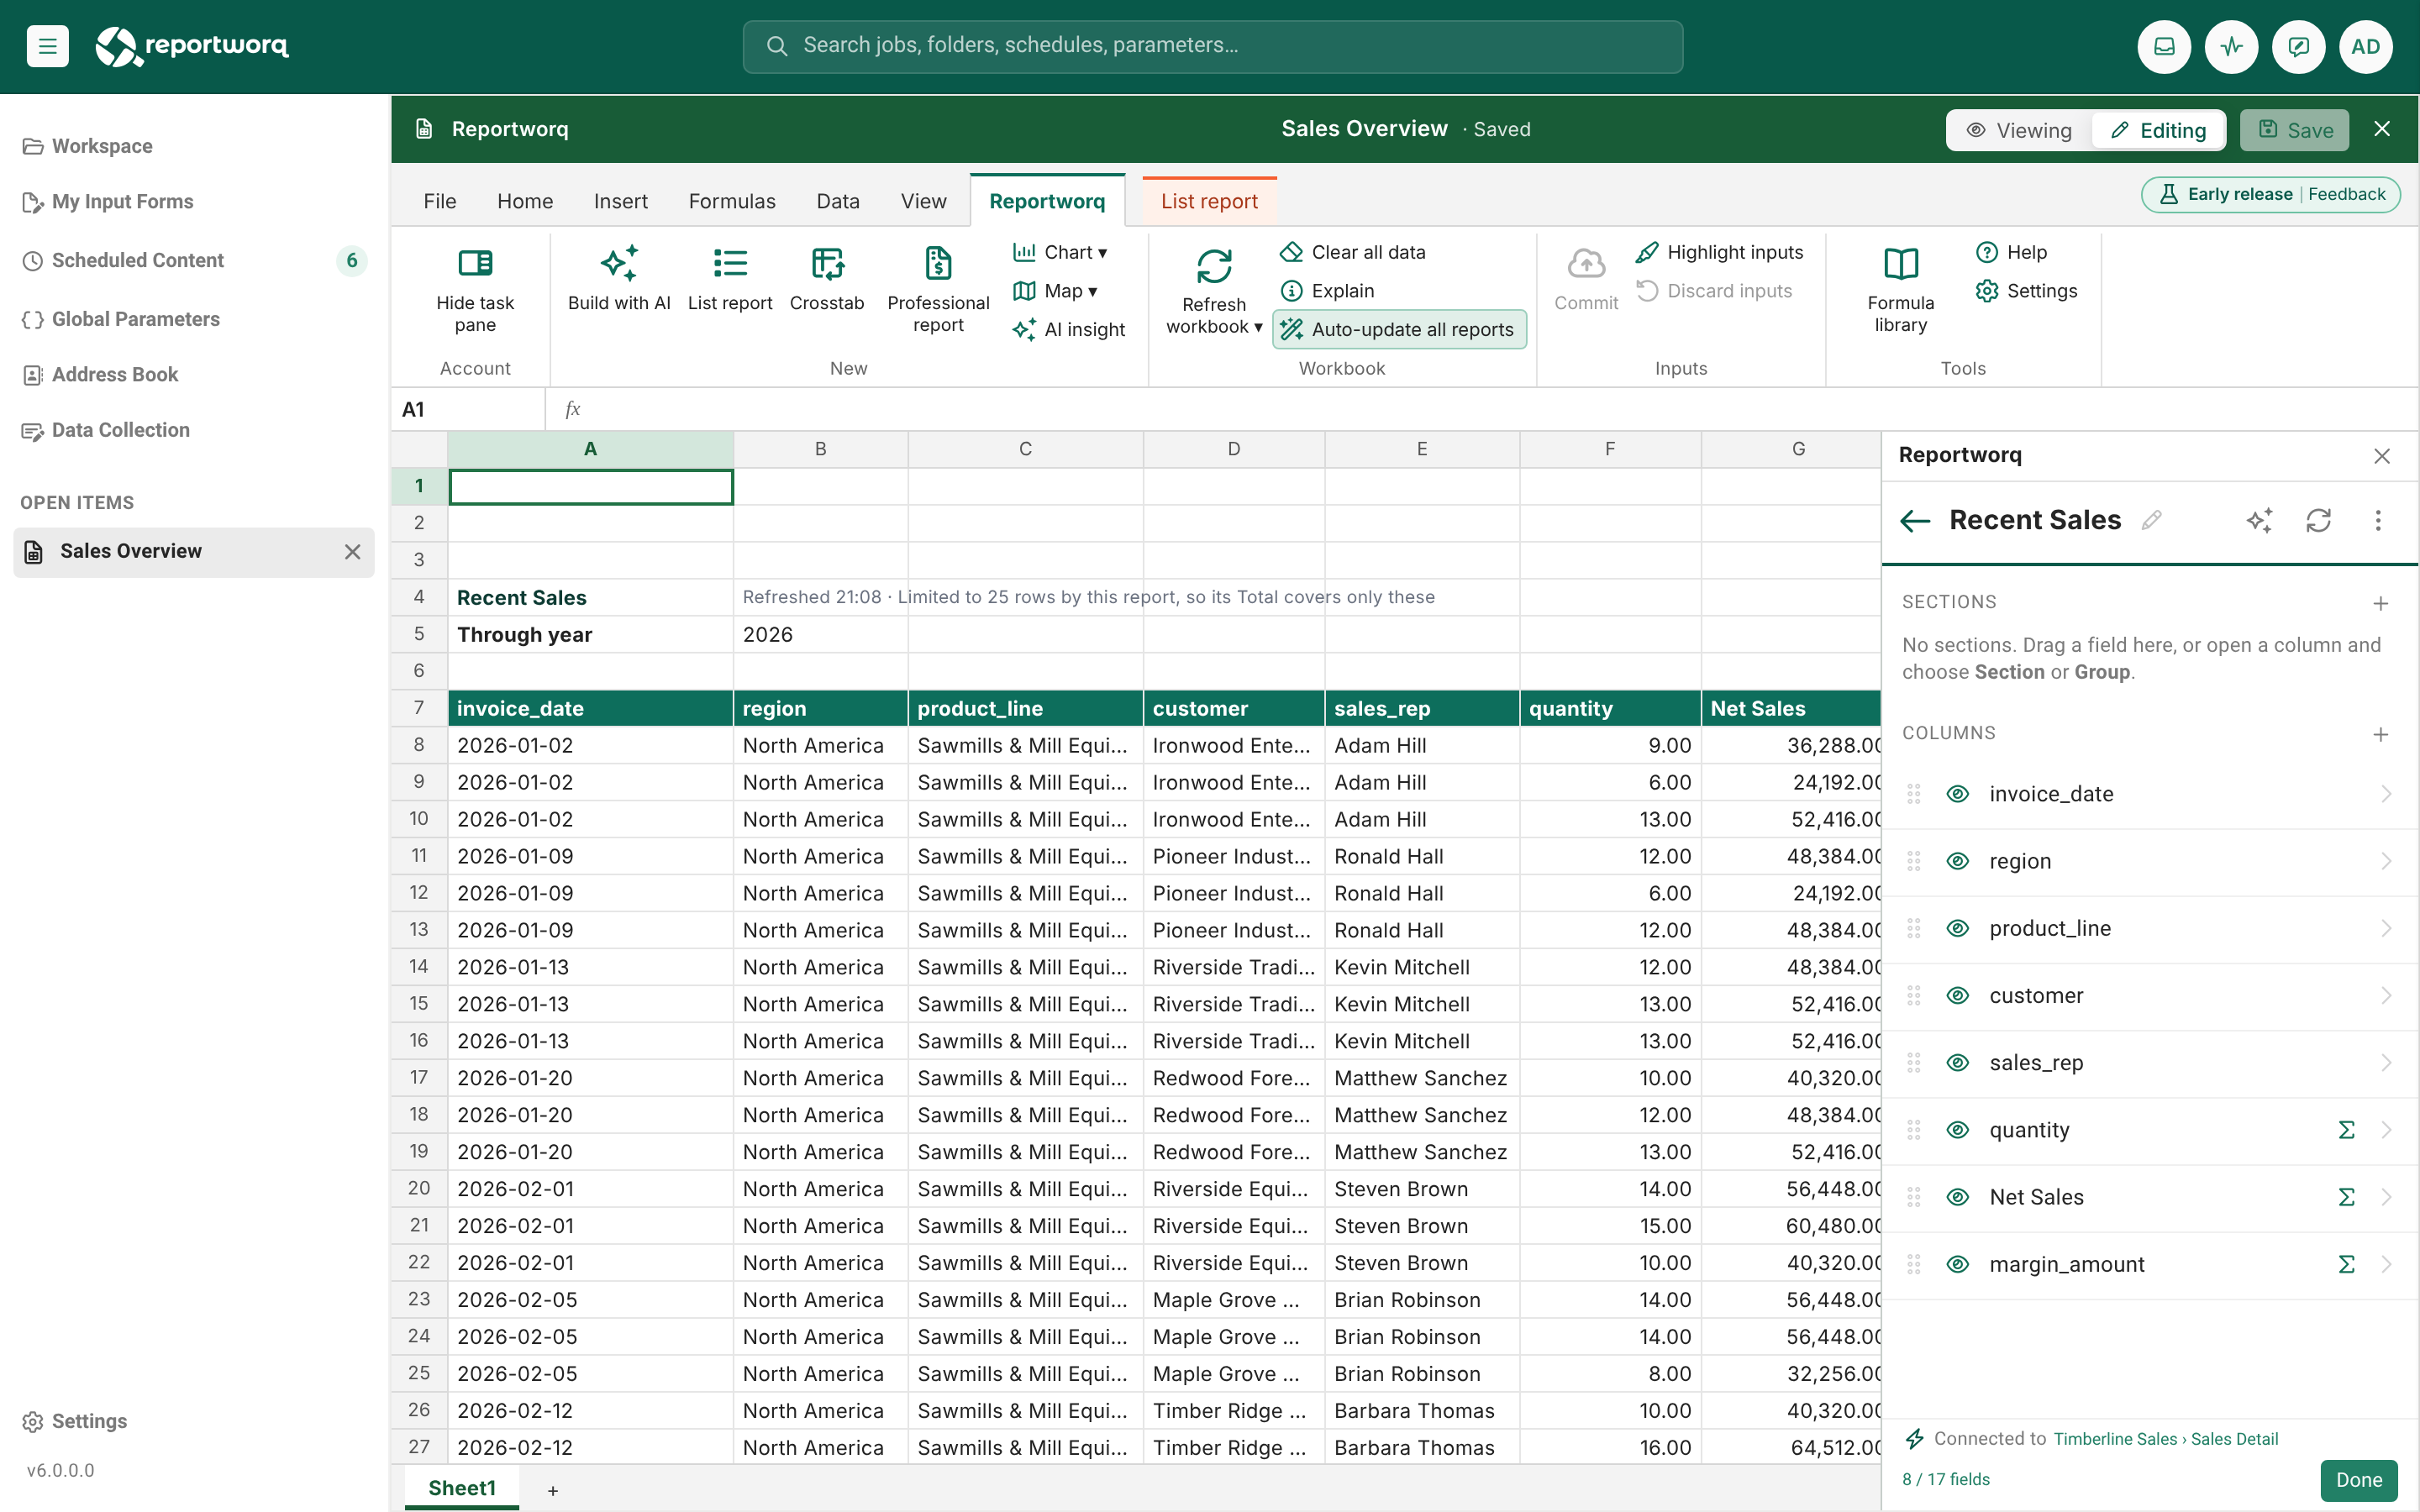
- In the web report studio, the same pane sits beside an Excel-like page in the browser. The report is saved to the workspace as a web report.
Because it is the same pane, the report types, the editors, the filters, the totals and the limits for a list or a crosstab behave the same way in both. A list you build in one is a list you can open in the other.
| Excel add-in | Web report studio | |
|---|---|---|
| Where the page lives | Your workbook | A web report in the workspace |
| How you open it | The Reportworq button on Excel's Reportworq tab | New, then New Web Report, or open an existing web report |
| Who can use it | Authors and system administrators | Authors and system administrators |
| Saved by | Saving the workbook in Excel | Save in the studio |
| Sheet size | Excel's whole sheet on current Excel for Windows, Mac and the web; a smaller window on an older client | 1,000 rows by 52 columns |
| Formulas in your own cells | Excel calculates them | The studio calculates a common list of Excel functions; others show #NAME? |
| Report types | List, crosstab, chart, map, AI insight | List, crosstab, professional report, chart, map, AI insight |
| Large reports | Asks before writing more than 100,000 cells (the default; an administrator can change it) | Writes without asking |
| Live viewing and the reader's page | Not available | Viewing mode and the viewer |
| Feeding a distribution job | The workbook itself is the job's source report | Convert the web report to an Excel workbook first |
Which should I start in?#
- Start in Excel when the finished product is an Excel workbook: a formatted package you send by a distribution job, or one you keep working on with formulas, charts and PivotTables beside the live reports. A workbook with Reportworq reports can be a job's source report as it is.
- Start in the studio when you want a live page people open in the browser, when you want a professional report, or when you need the Viewing mode with filters and drilling.
- Switch when you need to. The two hosts share the stored definition of each report, so you can move a report from one to the other (see below).
What is the same#
- The report types and editors. The Connection page, the field picker, a field's page, the Report filters, Variables, Place, Totals and Limit rows pages are the same.
- The data. Both read your data models (the Public views you can see) and, for crosstabs, saved cube connections. Neither can show a Hidden or Disabled view in its list.
- The limits that guard a report. The largest report, the rows read from the source and the read timeout are the same.
- The definition. Each report keeps its definition (its source view, fields, filters, totals and settings) with the page that holds it, in a workbook or in a web report. A report saved by a newer version of Reportworq cannot be read by an older server.
What is different#
- No Professional report in Excel. In Excel the professional report buttons are dim and say "Professional reports aren't in Excel yet." Build them in the studio. See Professional reports.
- Viewing only in the studio. The studio can show a web report as a live page, with filters, drilling and download. A workbook is just a workbook. See The viewer.
- Where a report may sit. In the studio, a report must lie inside rows 1 to 1,000 and columns A to AZ. In current Excel for Windows, Mac and the web, a report can sit anywhere up to XFD1048576. On an older or unrecognized client, Excel works in A1:AZ1000 as the studio does. Reportworq never moves a report for you; a report outside the area the host can hold is left alone and not treated as a report.
- The ribbon. In Excel, the add-in adds a Reportworq tab with an Open group (the Reportworq button that opens the pane) and a New report group with List, Crosstab, Professional (dim), Chart and Build with AI. In the studio, the Reportworq tab and a ribbon that looks like Excel's are part of the page.
- An administrator can turn the pane off in Excel. The setting is Use the analyst pane in Excel under Settings, Configuration, Excel add-in. If it is off, or Excel is too old, Excel shows the older Companion pane. The studio is not affected.
How a workbook relates to a web report#
A web report is not a file. A workbook is. You can move between them in five ways.
| You want to | Do this | What happens |
|---|---|---|
| Keep the web report and get a copy as a workbook | In the workspace, on the web report's row: Export as Excel | A connected .xlsx is saved beside the web report. The web report is untouched. No data is read; the workbook is the report as last saved. |
| Download the web report | In the studio: File, Excel, Export to Excel | The workbook is downloaded to your computer. |
| Put a workbook's reports onto an existing web report | In the studio: File, Excel, Import workbook | Replaces what is on the page. A connected workbook's reports come back live; other workbooks come in as a plain page. Nothing is saved until you choose Save. |
| Make a new web report from a workbook | In the studio: File, Excel, Open workbook | Creates a new web report in the same folder, in a tab of its own. |
| Replace a web report with a workbook that jobs will refresh | In the workspace, on the web report's row: Convert to Excel | Creates the workbook, points the distribution jobs at it, and deletes the web report. It cannot be undone. See Convert to Excel. |
A workbook that you build in the Excel add-in comes into the studio through Import workbook or Open workbook with its lists, crosstabs and other reports intact, and they refresh from their live sources. If a report in that workbook reaches past row 1,000 or column AZ, the studio shows the first 1,000 rows and 52 columns, will not change the report, and says "Edit it in Excel." Saving keeps its stored definition as it was.
A workbook made from a web report also carries a hidden Reportworq definitions sheet that explains each report in plain language: where it sits, what it reads and which filters and variables it uses. It is written from the same text as the pane's Explain this workbook.
Why not just use the web report as a job source? A distribution job produces static output and never carries a live report's viewing filters. A workbook is what a job knows how to refresh and send. That is why Convert to Excel exists. See A web report as a job source.
Who can use which#
Readers (people who only read output) cannot open a web report, and they cannot use the pane in Excel. The Excel add-in refuses a sign-in without author rights with "The Excel Addin requires the Author entitlement." Reports in the pane read data live, and Reportworq keeps that for authors and administrators. Readers receive what distribution jobs send.
Going deeper. The pane's limits, how a job handles a workbook saved from the pane, and the settings an administrator can change are in Excel: the analyst pane.
Feedback on this page
Comments, questions, requests, or something missing or unclear? Email us - the page you are on is filled in for you.
Email feedback on this pageOr write to support@reportworq.com directly.