
Combine report types on one sheet#
Early release. This feature is in early release, so its screens and behavior may change. Tell us what you think with Send feedback. See Early release features and Send feedback.
A web report or workbook can hold many reports at once, on one sheet or several: lists, crosstabs, professional reports, charts, maps and AI insights. Each is an independent report with its own definition, and several of them can be tied to the same data or cell so the sheet reads as one page.
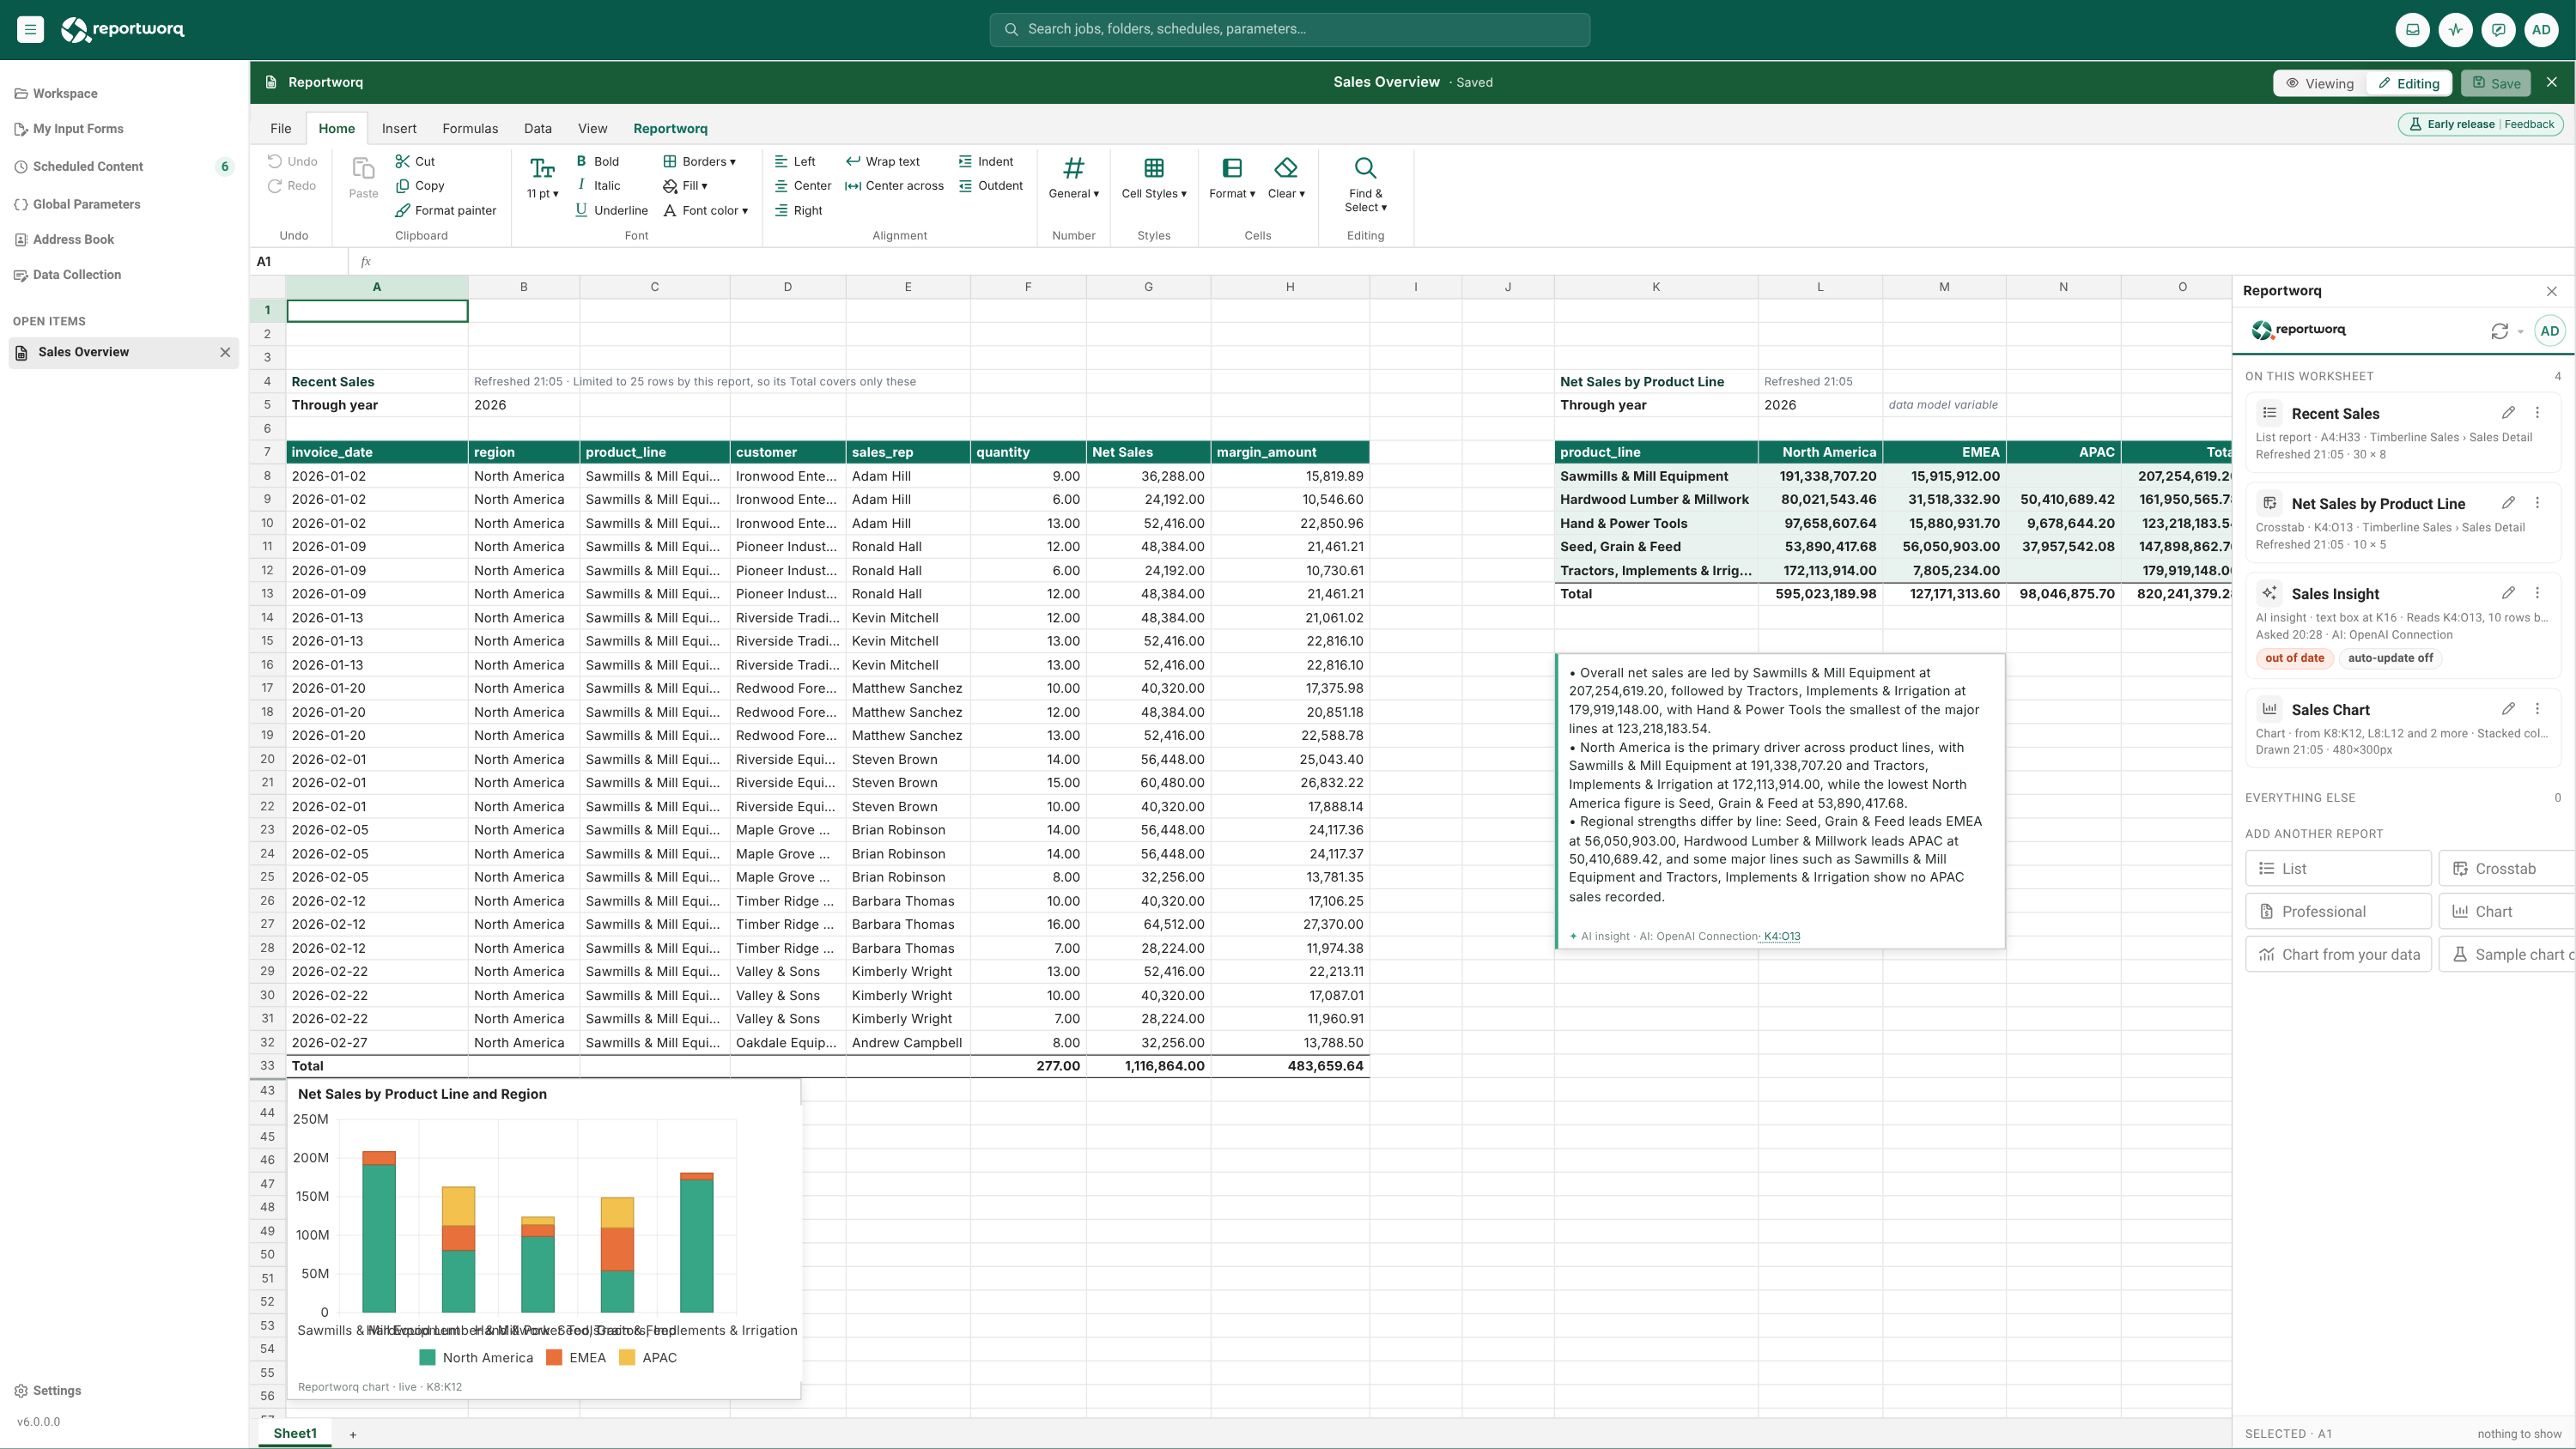
When to use it. A Timberline management page: a crosstab of revenue by region, a column chart beside it that grows with it, a short AI insight underneath that explains it, and a Period cell at the top that all of them respect.
Combinations that work#
| Combination | What you get | How |
|---|---|---|
| Chart over a list or crosstab | The chart draws every data row, grows and shrinks with the report, skips the Total row, and follows filters and burst parts | Select the report's cells and Chart from your data, or choose source mode Report on the chart's Data page. See Charts and maps |
| Map over a table of places | Markers or bubbles from a table, optionally on a floor plan | A list report or plain cells can hold the table |
| AI insight on a report | A written explanation that follows the report, whatever its filters | Source mode Report in the insight editor. See AI insights |
| AI insight on a chart or map | The insight reads the chart's data range, with its header row | Source mode Report over the chart |
| AI insight on top of a chart over a crosstab | One sheet with a table, a picture and a paragraph, each following the one before | Make the crosstab, the chart, then the insight, each with Use selection |
| One cell driving several reports | A Period, Region or Scenario cell that every report on the sheet reads | A report filter bound to a cell in each report. See Cell-driven variables |
| A job parameter driving several reports | One job value narrows the reports you map it to | Map the parameter once per report; a parameter mapped only to a cell reads "Mapped in: ..." |
| A crosstab converted to a professional report | A chart, map or AI insight that followed the crosstab follows the new report | Done for you by To professional report |
How the pieces relate#
- Following. A chart, map or AI insight made from a selection remembers whether it follows a report (Report), grows from cells (Grows) or reads a fixed range (Fixed). Following is bookkeeping done by the pane; renderers and job runs do not rewrite it.
- Placement. A new chart or map is placed two columns to the right of its selection and never on another picture. An AI insight text box is a picture on the page, so a chart made over the same selection moves clear of the box.
- Refresh order. Refresh all asks AI insights last, so they explain data that has just been refreshed.
- Copies. When you copy a sheet, a chart or insight on the copy follows the copy's report, not the original's.
- One sheet, one grid. A report that grows pushes the cells below it down. If doing so would run through another report on the sheet, the refresh is refused or, for a professional report, inserts cells only across its own columns. Leave room, or put reports side by side with a spare column or place them on different sheets.
What does not combine#
- A professional report is licensed and not built in the Excel add-in. See Professional reports. An AI insight is not asked over a professional report's cells on an unlicensed server.
- Reports on a hidden sheet are checked when you convert a web report for a job that narrows it by a filter or a cell. A list or crosstab there must be narrowed by the same filter, and a map or professional report there cannot be narrowed at all, so convert is refused. Move it to a visible sheet or remove it.
- A map is delivered as saved in a job. It does not re-read its places for each run, so a job that narrows a web report cannot narrow a map.
- A chart whose crosstab no longer has the column a series was named for leaves that series out. A series named "Series 1" is drawn from its column as it is.
- A Grows source stops at any report's cells, so an insight that grows from a cell never reads another report's title.
- A filter reads a cell on its own sheet only. Move the cell, or have the job write it there.
In a distribution job#
When the job uses the web report, lists and crosstabs are re-queried, charts are redrawn from that run's data, AI insights are asked again (or withdrawn with a warning if they fail), and maps and professional reports go out as saved. For the details see A web report as a job source.
Going deeper. The web report studio and The Excel add-in and the studio explain where each report type can be built.
Feedback on this page
Comments, questions, requests, or something missing or unclear? Email us - the page you are on is filled in for you.
Email feedback on this pageOr write to support@reportworq.com directly.