
Discover your data#
Early release. This feature is in early release, so its screens and behavior may change. Tell us what you think with Send feedback. See Early release features and Send feedback.
Before you build a report on a source, look at it. Reportworq gives you several ways to see what a source and a data model hold, from a quick look at one table to a live exploration of every view. Each is read-only: none of them changes the model, the source, or any report.
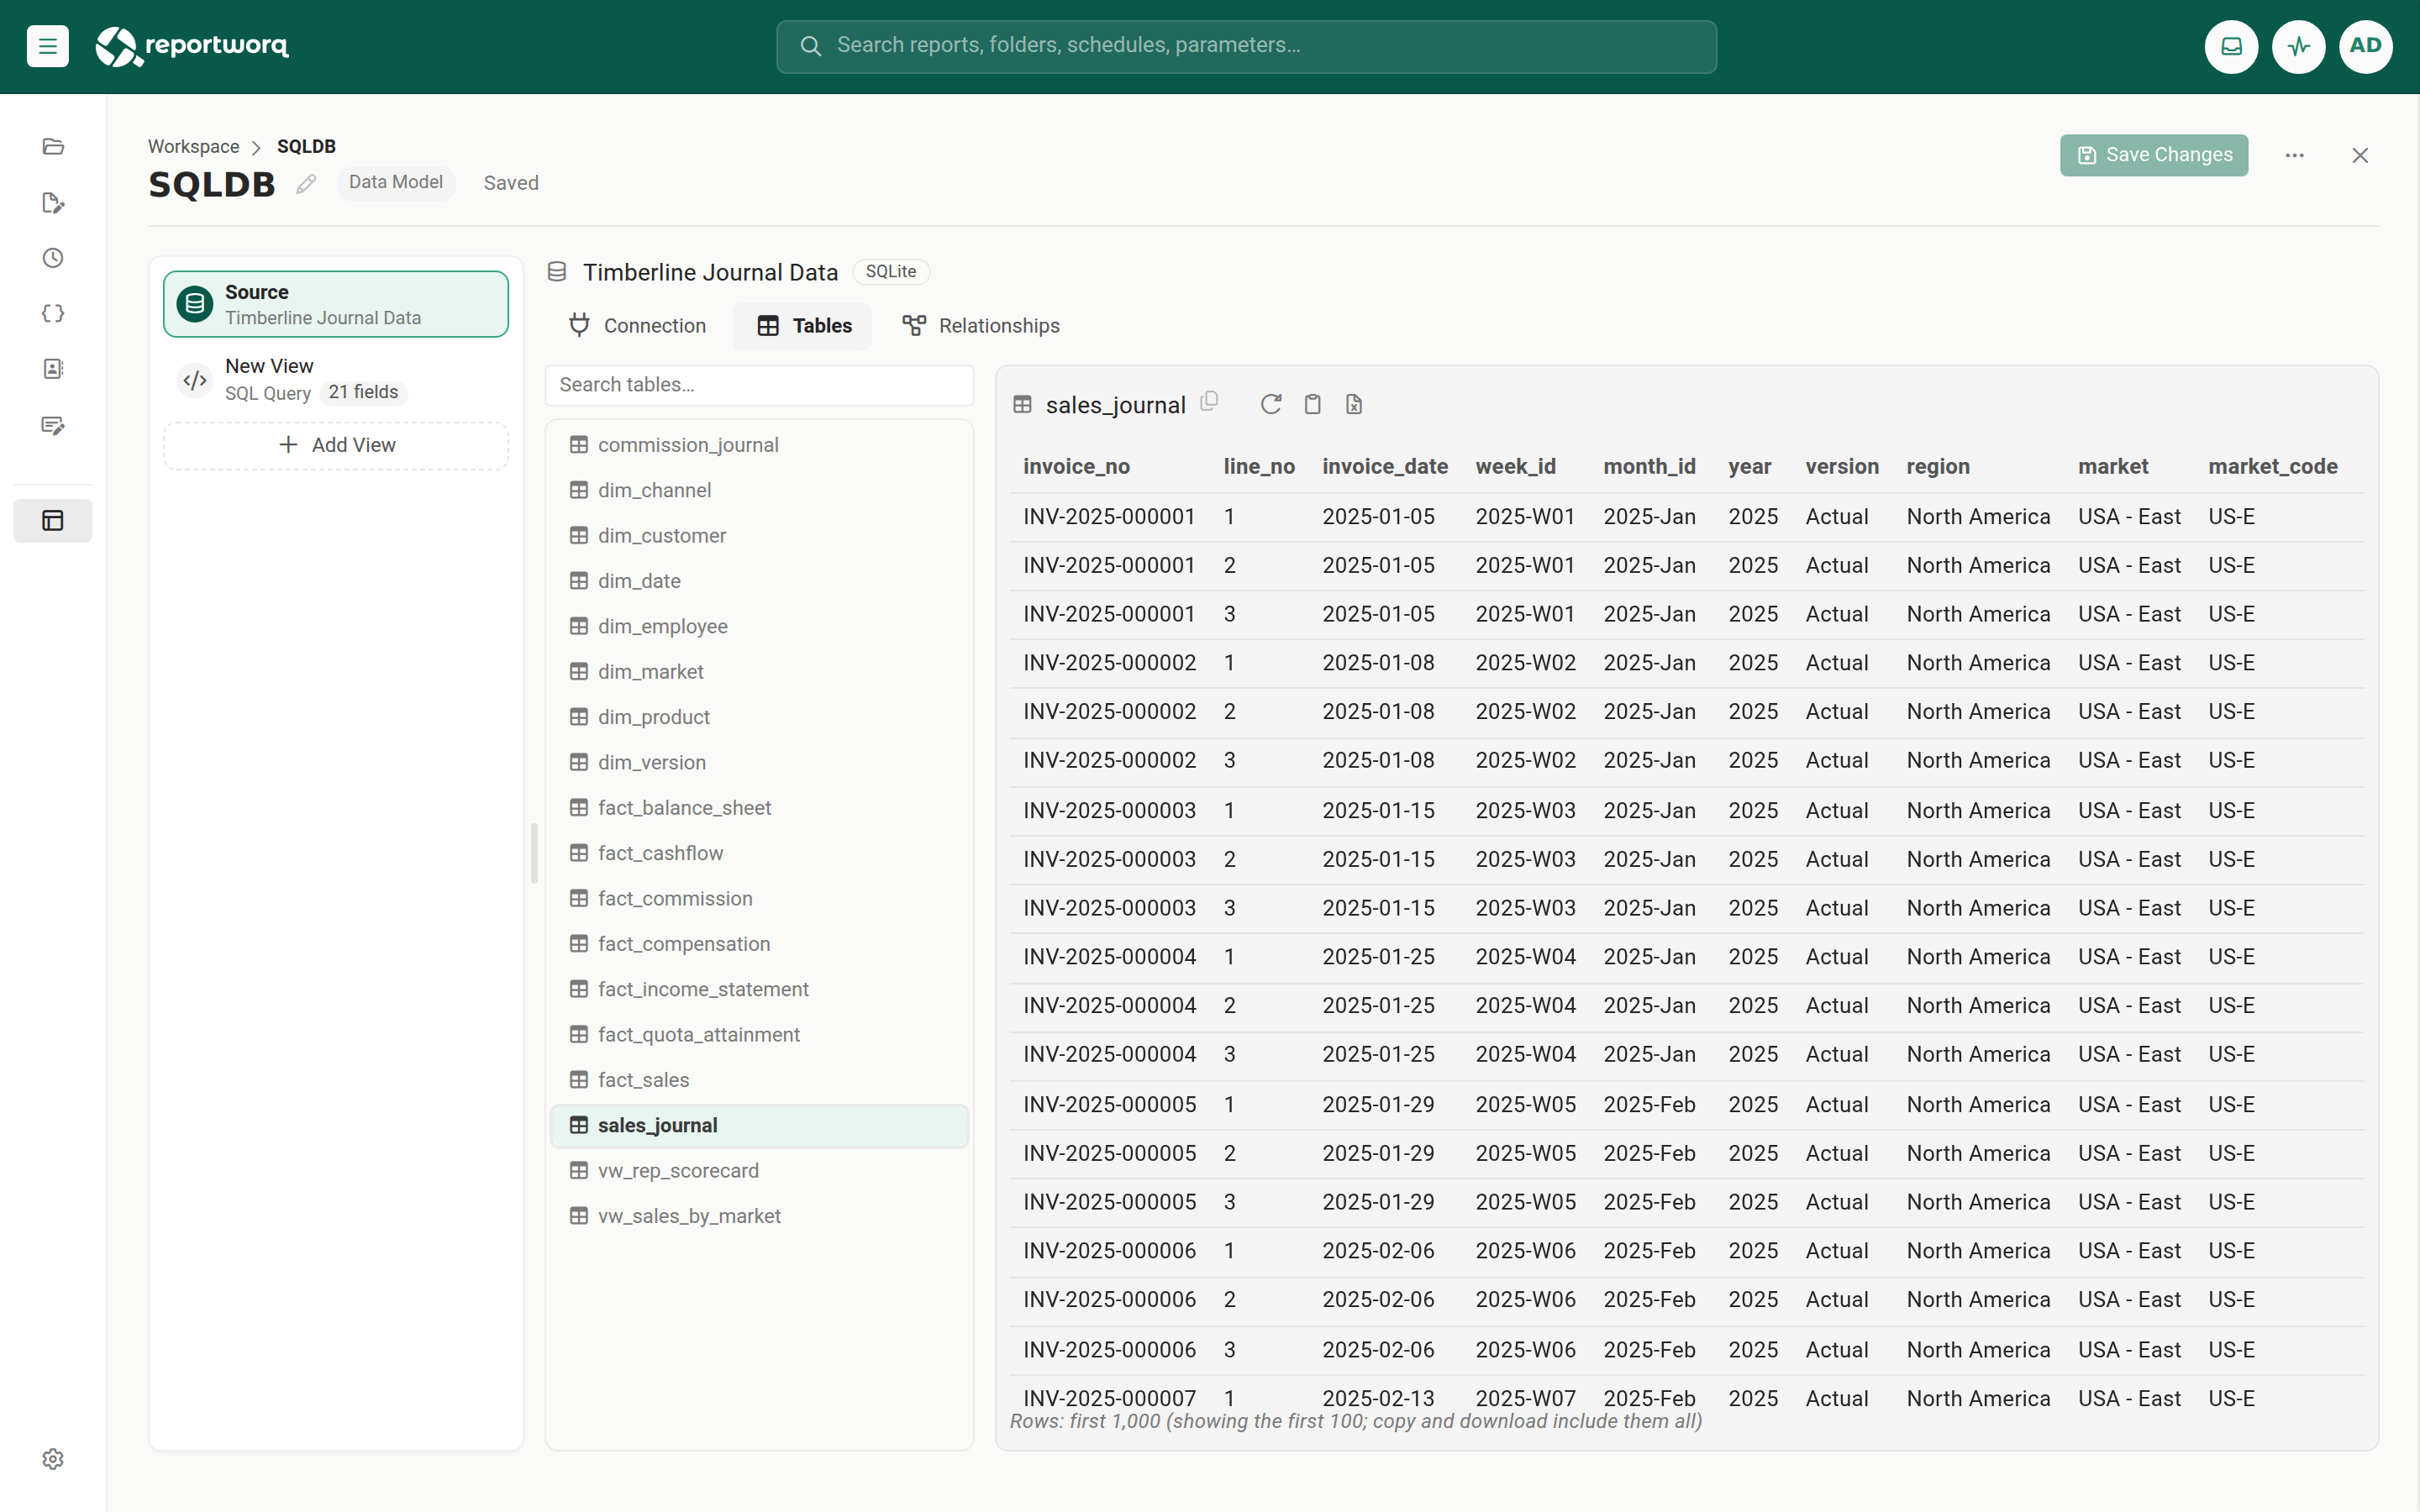
When to use it. Use these when you meet a source you do not know, when a view returns something you did not expect, or when you want to hand a snapshot of the data to someone. For example, at Timberline Harvest Co. you might browse sales_journal to see what one invoice line looks like, then explore the finished view with a pivot to check the totals before you publish it.
Pick the right tool#
| You want to | Use | Reads |
|---|---|---|
| See the raw rows of one table, before you model it | Browse a table | Up to 1,000 rows |
| Check what a view returns, with its variables | Preview a view | The rows you ask for, up to 10, 100, 1,000, or all |
| Pivot, drill, and total a whole model's views | Explore a model | A live list per view |
| Copy every table of a source into one workbook | Export a source to Excel | Every row, within a size budget |
| Check that two views match on a key | Check how views match | Up to 10,000 rows per view (1,000 for Discover relationship) |
| Check a hierarchy's members | Preview a hierarchy | The hierarchy's view, up to 1,000,000 rows |
| Have the data explained in plain words | Ask the assistant to explain | A small sample of rows |
Before you start#
- A data model with at least one source. See Data models.
- Permission to open the data model in the editor. Explore is for authors and administrators; a reader-only user cannot open it.
Browse a table before you model it#
- Open the data model and select Source in the rail.
- Select the Tables tab. It appears when the model has a SQL source to browse, including an Excel or SQLite workspace file.
- Select a table in the list. Search tables narrows a long list.
- Read the rows. The grid reads at most 1,000 rows, and the row count under it says how many were read. The Relationships section above the rows shows the table's links.
- Optional: use the clipboard button to copy the rows with a header row, ready to paste into Excel, or the Excel button to download a workbook of the table.
Preview a view#
Preview runs a view the way a report would and shows the resolved rows after the variables and field choices are applied.
- Open the view and select the Preview tab.
- Choose how many rows to read: 10, 100, 1,000, or All rows. The default is 100.
- If the view has variables, the Variable values pane is open. Enter values for this run only; Reset to defaults puts the defaults back.
- Select Run preview. After the first run the button reads Refresh.
The grid draws at most 5,000 rows. Copying the rows and downloading them as an Excel file take every row that was read. Nothing runs until you select Run preview. The full steps, including what a blank required variable does, are in Build a view with the designer and Data model variables.
Explore a model#
Explore opens the web report studio over a whole data model, so you can look at every view as a live list and pivot, drill, and total it, with nothing saved until you say so.
- In the workspace, select the ⋮ menu on the data model's row and choose View. (Selecting the model's name opens the editor instead.)
- The model opens in a tab headed Exploring and the model's name. The Views list on the left shows each view of the model that has fields.
- Select a view. It opens on its own sheet as a live list of all its fields. Select another to open it on a new sheet.
- Work with the data using the Reportworq pane: build a crosstab, drill into a value, filter, or total.
- Select Edit model to jump to the model editor, or Save as report to keep what you built as a web report. Choose a name and a folder in the dialog that opens.
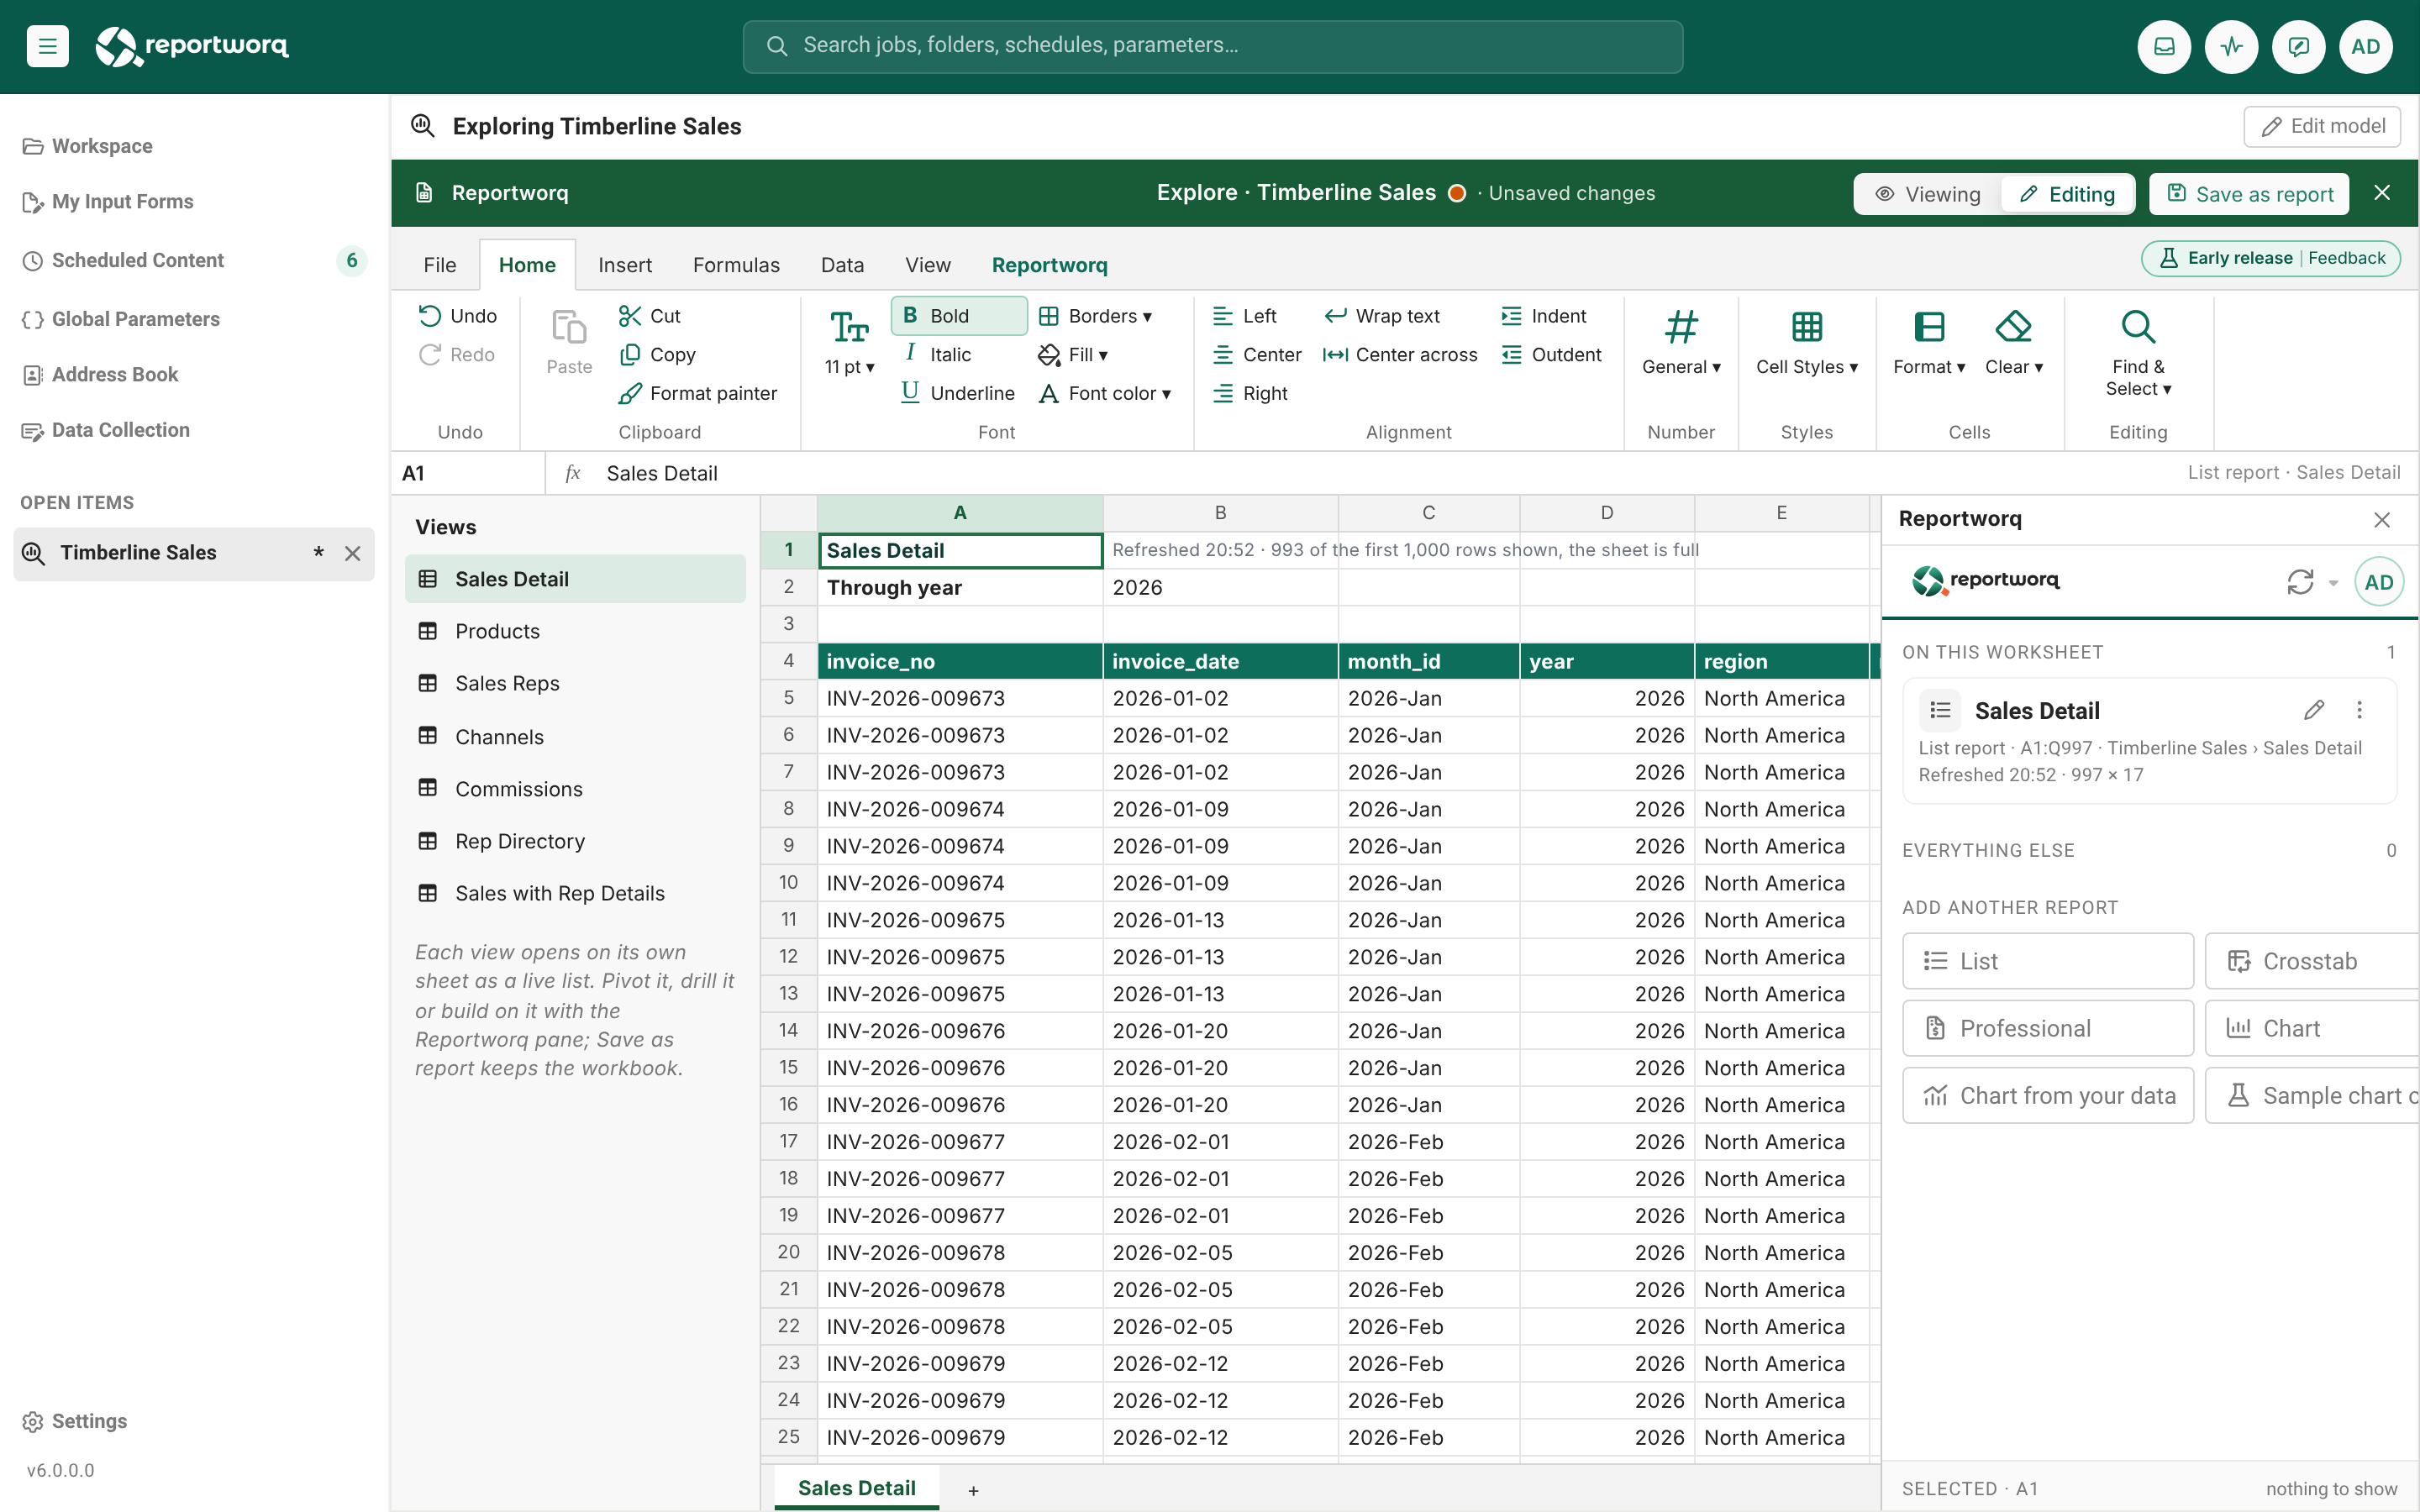
- Nothing is saved until you choose. The workbook is unsaved at first, and closing the tab asks whether to save or discard.
- Explore lists every view with fields, including Hidden ones. A Disabled view does not run; opening it fails with a message that names it. See Choose who sees a view.
- Large views. A list reads the rows that fit the sheet (about 1,000) and says so on the report when the source has more.
- Hierarchies roll up here. A hierarchy attached to a field shows subtotals in a crosstab. See Build hierarchies.
- Explore never writes the model.
Export a source to Excel#
Export copies every table of a source into one workbook, for example to hand a snapshot to someone without access or to read the tables side by side. It checks the size first and shows a verdict (Quick, Medium, or Large). Only a source past 10,000,000 cells is refused; a large table is cut to fit a sheet, never refused.
Select Source, open the Sources tab, and select Export on the source's row. The full steps, the workbook's sheets, and the cut-to-fit rules are in Export a whole source to Excel.
Check how views match#
On a joined view, three tools read real rows so you can trust a match before a report depends on it.
| Tool | What it tells you | Reads |
|---|---|---|
| Test match | How many rows of the left view find a match, how many repeat, and which matching options would find more. | Up to 10,000 rows of each view |
| Discover relationship | The four best pairs of fields to match on, each with its match rate. Use this fills in the key. | Up to 1,000 rows of each view |
| Explain | How the joined view runs, step by step, with each step graded as helping, worth a look, or hurting. | The starting view capped at 100 rows |
See Check a relationship on real rows and Read the Explain plan.
Preview a hierarchy#
On the Hierarchies tab of the Source screen, Preview tree reads the hierarchy's view as you have it in the editor, unsaved changes included, and shows the members it gives. Under What the data says it reports problems, such as a team that rolls up to two divisions. See Build hierarchies.
Ask the assistant to explain#
The data model assistant can describe what a source holds in plain words. On the Source screen, select Ask AI, then Analyze my data, or pick Explain what is in my sources under More things I can do and finish the request, for example "what each source holds". Nothing changes in the model when you ask for an explanation. To use it, an administrator must have set up an AI provider, and the assistant sends a small sample of real rows to that provider. See Ask AI on a data model for what it reads and sends.
Notes and limits#
- Every check reads a sample. Browsing reads 1,000 rows, Test match 10,000, Discover relationship 1,000, and Explain caps the starting view at 100. None of them proves the whole data.
- Credentials and reachability are tested when you read. The editor only checks that a source's connection or file still exists when the model opens. A wrong password shows when you browse, preview, or explore.
- Reading is not free on a database. Browsing, previewing, and exporting run queries against the source. Export warns when it would read more than 2,000,000 rows, and suggests running it outside working hours.
- There is no separate profiling screen. Counts and distributions come from previewing the view, or from a crosstab in Explore.
Related topics#
Feedback on this page
Comments, questions, requests, or something missing or unclear? Email us - the page you are on is filled in for you.
Email feedback on this pageOr write to support@reportworq.com directly.